VII. Macroeconomic Outlook - ಆರ್ಬಿಐ - Reserve Bank of India
VII. Macroeconomic Outlook
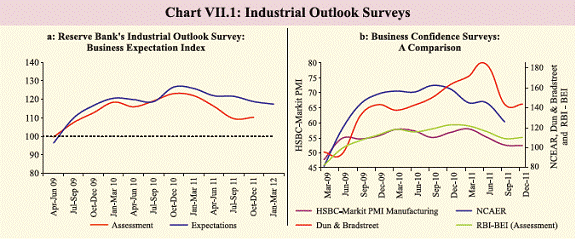
Both global and domestic factors have increased the downside risks to growth. Inflation has shown some moderation as anticipated though upside risks remain from incomplete pass-through of rupee depreciation, suppressed inflation in energy segment and expansionary fiscal policy. The weakening business climate is corroborated by business expectation surveys of various agencies, as well as the Reserve Bank’s industrial outlook survey. The professional forecasters’ survey also suggests growth moderation. Most international and domestic agencies have revised downward their earlier growth projections for the Indian economy. Even as growth slowdown emerges as the major challenge, inflation risks persist, posing a challenge for monetary policy in achieving low and stable inflation with minimal sacrifice of growth. Growth outlook weakens as global headwinds and domestic factors accentuate downside risks VII.1 Although a moderation in growth was anticipated previously, developments over the past few months in the global economy indicate that the degree and spread of the slowdown may turn out to be higher than earlier thought. EDEs too have started to face slowdown concerns as the contagion from unfavourable global environment is weighing in on growth prospects. OECD’s composite leading indicators (CLI) which are designed to provide early signals of business cycle movements, have declined for almost all major economies. Consumer and business confidence have been showing signs of growing pessimism. This could further delay recovery as fiscal space for stimulus in the debt ridden global economy is limited. VII.2 Amidst weakening global growth, India’s near-term growth outlook has deteriorated and poses challenges for economic management. The Reserve Bank in its Second Quarter Review of Monetary Policy 2011-12 on October 25, 2011 revised downwards the baseline projection of GDP growth for 2011-12 from 8.0 per cent to 7.6 per cent on the basis of the macro-economic situation prevailing then. Since then, developments on both the global and domestic fronts have not been favourable and the growth is likely to turn weaker than earlier anticipated. VII.3 Outlook for Agriculture in 2011-12 is encouraging. However, the headwinds facing the domestic economy thus far, viz., inflationary pressures, which resulted in high interest rates, global uncertainty and the domestic policy environment, have adversely impacted the industrial sector performance in 2011-12. A bigger risk arise from inflation and the downturn in investment cycle as they pose threat to growth sustainability. Services sector also faces downside risks both from weakening global demand and slowing industrial growth. VII.4 It is possible to raise growth from the current levels but restoration of business confidence is the key. The pause in the tightening of the monetary policy and further moderation in inflation should help activity regain some momentum. Higher IIP growth in November 2011 and rise in manufacturing and services PMI for December 2011 already indicates some improvement. However, on balance, the downside risks to real GDP growth during 2011-12 have increased. Inflation moderates, but risks remain as exchange rate pass-through has enlarged VII.5 Headline WPI inflation decelerated since November 2011. The recent decline in inflation has largely been on account of the base effects and seasonal fall in food prices, especially vegetables. Even though food inflation has been pushed into negative territory, inflation in protein-rich items persist in double digits. Therefore, once the seasonal moderation ends and base effect wanes, food inflation could revert course significantly. VII.6 Decline of growth to below potential is expected to ease pressures on aggregate demand and thereby have a softening impact on generalised inflation. Apart from this, declining international commodity prices, has also emerged as a favourable factor. The passthrough of rupee depreciation and expansionary fiscal policy, however, have emerged as major risks, offsetting the favourable impact from the lower demand pressures and commodity prices. The suppressed inflation from energy prices further complicates policy options as revisions in these prices could be inevitable. Wage inflation is still high in rural areas and real wages increased, though at a lower pace than previous year. VII.7 Overall, the emerging trend in inflation so far is broadly in line with the projected path towards 7.0 per cent by March 2012. The risks to softening of inflationary pressures, however, remain. The policy response to emerging macroeconomic conditions has to take these risks into account. Business expectations, industrial outlook surveys suggest confidence ebbs VII.8 Surveys conducted by different agencies corroborate the overall moderation in business climate. Both CII and FICCI business confidence indices declined from the previous quarter and the current levels are lower than what was recorded a year ago. The latest survey of NCAER on business confidence also shows a decline both on y-o-y basis and from the previous period of survey (Table VII.1). Dun & Bradstreet Business Optimism Index, however, showed some improvement over the survey period. Weakening demand, increased global uncertainties, lower availability of credit and higher input costs are seen to be the significant factors affecting the overall business sentiment.
Industrial Outlook Survey suggests weakening ahead VII.9 The 56th round of the Industrial Outlook Survey (/en/web/rbi/-/publications/quarterly-industrial-outlook-survey-october-december-2011-56th-round-*-14025) of the Reserve Bank conducted during October-December 2011, showed marginal increase in the Business Expectation Index (BEI) for the assessment quarter (October- December 2011) whereas marginal decline was recorded in expectation for the next quarter (January-March 2012) (Chart VII.1). The index is a composite indicator based on assessment of several business related parameters for the assessment quarter as well as for the expectation quarter. VII.10 Analysis of the net responses among various components of the BEI indicates that the assessment on ‘production’ was marginally higher in Q3 of 2011-12, while the expectation for Q4 of 2011-12 remains flat. Net response on ‘order books’ continued to decline for fourth consecutive quarter. Level of optimism on ‘availability of finance’ lowered further. While increasing proportion of respondents reported rise in ‘cost of finance’ over previous 7 quarters, the trend appears to have reversed for Q4 of 2011-12. Most of the respondents felt that pressure from ‘cost of raw material’ continued and was expected to elevate further in the next quarter. The optimism on ‘selling price’ and ‘profit margins’ further declined in both the assessment and expectation quarter (Table VII.2).
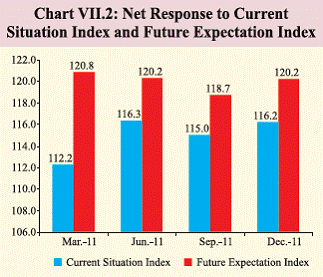
Consumer confidence indicate some improvement VII.11 The seventh round of Consumer Confidence Survey (/en/web/rbi/-/publications/consumer-confidence-survey-december-2011*-14027), conducted by the Reserve Bank in December 2011, indicates some improvement in positive perceptions of the household after recording marginal decline in the previous quarter (Chart VII.2). High inflation, however, continues to remain as the major drag factor on overall positive sentiments.
Agencies lower growth forecasts VII.12 The Government of India had revised downwards significantly its growth projection for 2011-12 to 7.5 per cent (+/- 0.25 per cent) on December 9, 2011 (Table VII.3). Some of the other agencies also had scaled down their projections earlier even as their updates are expected to be lower.
Survey of professional forecasters sees weak growth and softer inflation1 VII.13 In the 18th round of ‘Survey of Professional Forecasters’ (/en/web/rbi/-/publications/major-highlights-of-results-of-18th-round-q3-2011-12-of-survey-of-professional-forecasters-on-macroeconomic-indicators-14022), conducted by the Reserve Bank, GDP growth forecasts for 2011-12 and 2012- 13 have been revised downwards as compared to previous survey (Table VII.4). There has been a significant downward revision of growth forecast for industry for 2011- 12 and for services, it is revised downwards marginally. Average inflation is projected to decline over 2011-12 and 2012-13. The survey results indicate lower optimism on growth while inflation is expected to show gradual moderation. Inflation expectations remain sticky VII.14 The latest round of Inflation Expectations Survey of Households (IESH) (/en/web/rbi/-/publications/inflation-expectations-survey-of-households-december-2011-round-26-14029) indicate that the perception of current quarter inflation as well as the expectations on future inflation have increased. The rate of increase in expectations, however, has slowed down in the recent period. The survey was conducted among 4000 households across 12 cities and seven occupational categories in December 2011.
Heading into 2012-13, some challenges persist, others arise along with some opportunities VII.15 In the final quarter of 2011-12 and going forward into 2012-13, the Indian economy has to deal with several persistent challenges as well as some new ones. While inflation is showing welcome signs of moderation, which creates some space for monetary policy to address growth concerns, it is important to remember that demand-supply mismatches are never very far from the surface in a variety of commodities and services, not to mention human capital. A sharp inflationary response to even a modest recovery in growth is a persistent risk, which materialised in late 2009, and against which monetary policy has to be constantly on guard. Beyond this, adverse global conditions, both in terms of trade and capital flows amidst a hostile oil price environment have clouded growth and stability prospects for the past three years. VII.16 New challenges have emerged in the form of large and rapid movements in the exchange rate. The consequences of these movements for both flow (balance of payments, fiscal deficit) and stock (balance sheet) indicators are unquestionably adverse. However, in the event of a prolonged nonresolution of global problems, considerations of financial and external stability are critical. A prudent policy approach is to accommodate the pressure of depreciation in a way which reduces the likelihood of a much more severe and, perhaps uncontrollable, shock. As expectations of a quick and robust resolution to the European sovereign debt crisis diminish, it is all the more important for India to maintain adequate capacity to withstand further external shocks. VII.17 Finally, amidst these formidable challenges, there are clear opportunities. Several policy initiatives that address the critical bottlenecks of food availability, fiscal capacity, infrastructure investment, land acquisition and skill formation are in advanced stages of design. Credible progress in the implementation of even some of these initiatives will have a dramatic impact on the investment climate, which is essential to the sustainability of a high-growth and lowinflation environment. While in the short run, moderating inflation will provide some space for monetary policy to address growth concerns, in the absence of structural measures to address a range of supply bottlenecks, this will be, at best, temporary respite. 1 The forecasts reflect the views of professional forecasters and not of the Reserve Bank. |
|||||||||||||||||||||||||||||||||||||||||||||||||||||||||||||||||||||||||||||||||||||||||||||||||||||||||||||||||||||||||||||||||||||||||||||||||||||||||||||||||||||||||||||||||||||||||||||||||||||||||||||||||||||||||||||||||||||||||||||||||||||||||||||||||||||||||||||||||||||||||||||||||||||||||||||||||||||||||||||


