RbiSearchHeader

Press escape key to go back

Past Searches

Theme
Theme
Text Size
Text Size
S2

RbiAnnouncementWeb

RBI Announcements
RBI Announcements

Asset Publisher

135286994

Services and Infrastructure Outlook Survey for Q3:2024-25

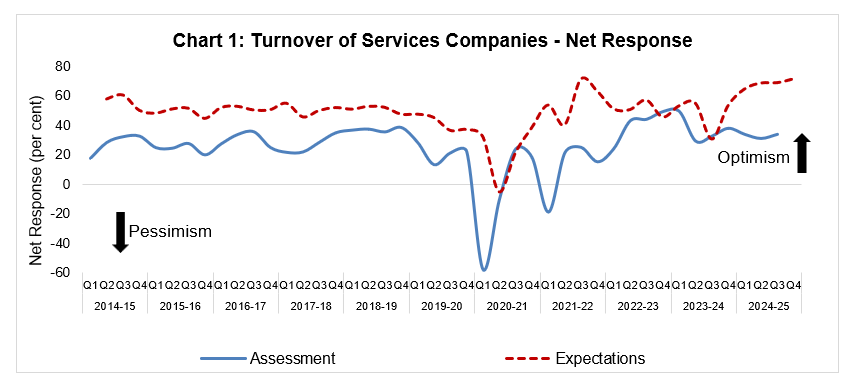
Today, the Reserve Bank released the results of 43rd round of its quarterly Services and Infrastructure Outlook Survey (SIOS) conducted during Q3:2024-25. This forward-looking survey1 captures qualitative assessment and expectations of Indian companies engaged in the services and infrastructure sectors on a set of business parameters relating to demand conditions, price situation and other business conditions. In the latest round of the survey2, 965 companies provided their assessment for Q3:2024-25 and expectations for Q4:2024-25 as well as outlook on key parameters for the subsequent two quarters.

Highlights:

A. Services Sector

Assessment for Q3:2024-25

  • Firms assessed improvement in overall business situation, employment conditions and their turnover during Q3:2024-25 (Chart 1 and Table A).

  • Pressures from input costs, salary outgo and cost of finance are gauged to have risen during the quarter.

  • Services firms reflected better pricing power, as measured in terms of selling prices and profit margins.

Expectations for Q4:2024-25

  • Outlook on demand condition in the services sector remains very positive with further improvements expected in overall business situation, turnover and job landscape (Chart 1 and Table A).

  • Responding firms expect cost pressures to increase; they also polled for higher growth in selling prices and profit margins.

Expectations for Q1:2025-26 and Q2:2025-26

  • Respondents remain optimistic on business conditions in the services sector during H1:2025-26. (Table C).

  • Input cost pressures are likely to persist, and selling prices are expected to rise in consonance.

Chart 1: Turnover of Services Companies - Net Response
  • Respondents reported that with their existing resources they could have provided 10.6 per cent additional services during Q2:2024-25 (Table S14).

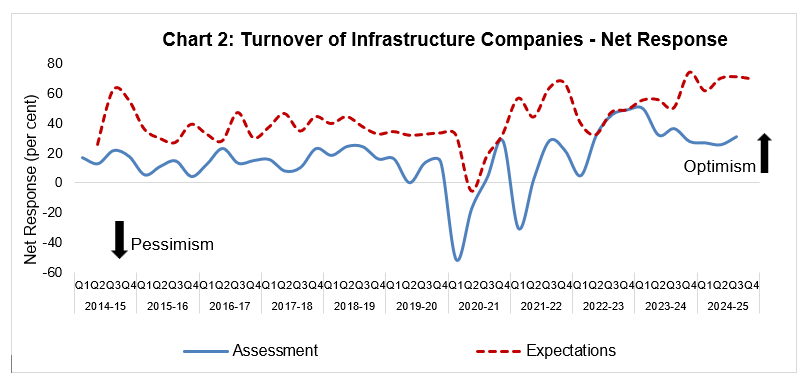
B. Infrastructure Sector

Assessment for Q3:2024-25

  • Respondents assessed improvement on overall business situation, turnover and employment, both full-time and part-time (Chart 2 and Table B).

  • Cost pressures in infrastructure sector are weighed to have risen with associated rise in selling prices and profit margins vis-à-vis the previous quarter.

Expectations for Q4:2024-25

  • Optimism of infrastructure companies on overall business situation and turnover stood a tad lower from that in the previous quarter (Chart 2 and Table B).

  • Responding firms expect improvement in employment conditions.

  • Cost pressures are expected to continue in Q4:2024-25, but associated rise in selling prices supports optimism on profit margins.

Expectations for Q1:2025-26 and Q2:2025-26

  • Infrastructure companies remain optimistic on demand conditions till Q2:2025-26 (Table D).

  • Majority of respondents expect further rise in input cost pressures and concomitant rise in selling prices during H1:2025-26.

Chart 2: Turnover of Infrastructure Companies - Net Response

Summary of Net Responses3 on Survey Parameters

Table A: Services Sector
(per cent)
Parameters Assessment period Expectations period
Q2:24-25 Q3:24-25 Q3:24-25 Q4:24-25
Overall Business Situation 30.2 33.9 68.0 69.2
Turnover 30.7 33.5 68.9 71.6
Full-time Employees 20.1 27.8 44.0 52.6
Part-time Employees 13.9 23.8 52.1 56.8
Availability of Finance 19.8 28.3 50.1 56.6
Cost of Finance -32.3 -35.4 -54.3 -59.2
Salary & Wages -25.8 -30.4 -44.5 -55.1
Cost of Inputs -40.6 -42.7 -64.2 -68.9
Selling Price 12.1 22.2 48.0 55.6
Profit Margin 4.2 15.0 38.4 48.9
Inventories 18.4 24.3 46.6 53.6
Technical/Service Capacity 18.5 29.0 58.3 63.6
Physical Investment 16.1 26.8 56.7 60.6
 
Table B: Infrastructure Sector
(per cent)
Parameters Assessment period Expectations period
Q2:24-25 Q3:24-25 Q3:24-25 Q4:24-25
Overall Business Situation 21.7 27.6 67.4 66.9
Turnover 25.4 30.7 71.0 69.5
Full-time Employees 18.1 22.0 39.3 45.3
Part-time Employees 9.7 22.2 48.9 58.0
Availability of Finance 18.2 26.2 54.4 59.2
Cost of Finance -26.6 -27.0 -60.3 -58.2
Salary & Wages -26.8 -31.0 -43.1 -47.6
Cost of Inputs -40.8 -41.6 -70.8 -70.4
Selling Price 10.9 17.1 50.0 56.4
Profit Margin 5.8 11.2 40.6 50.4
Inventories 20.5 28.0 56.4 60.7
Technical/Service Capacity 19.1 27.8 72.5 67.5
Physical Investment 25.7 26.7 75.3 71.1
 
Expectations of Select Parameters for extended period – Net response
(in per cent)
Table C: Services Sector
Parameter Round 42 Round 43
Q3:24-25 Q4:24-25 Q1:25-26 Q2:25-26
Overall Business Situation 68.0 69.2 71.9 73.0
Turnover 68.9 71.6 73.0 73.2
Full-time Employees 44.0 52.6 57.0 56.7
Part-time Employees 52.1 56.8 58.1 57.8
Cost of Inputs -64.2 -68.9 -64.7 -64.9
Selling Price 48.0 55.6 56.1 57.2
 
Table D: Infrastructure Sector
Parameter Round 42 Round 43
Q3:24-25 Q4:24-25 Q1:25-26 Q2:25-26
Overall Business Situation 67.4 66.9 68.3 68.0
Turnover 71.0 69.5 72.4 72.1
Full-time Employees 39.3 45.3 54.8 54.4
Part-time Employees 48.9 58.0 64.8 64.8
Cost of Inputs -70.8 -70.4 -66.7 -64.2
Selling Price 50.0 56.4 60.7 61.7

Note: Please see the excel file for time series data

Services Sector

Table S1: Assessment and Expectation for Overall Business Situation
(Percentage responses)@
Quarter Assessment Expectation
Better No Change Worse Net response# Better No Change Worse Net response
Q3:23-24 47.6 40.4 12.0 35.6 51.0 41.2 7.8 43.1
Q4:23-24 48.9 39.8 11.4 37.5 59.4 36.0 4.6 54.8
Q1:24-25 43.0 48.1 8.9 34.1 68.5 28.4 3.1 65.3
Q2:24-25 41.9 46.4 11.7 30.2 71.5 26.5 2.0 69.4
Q3:24-25 42.8 48.3 8.9 33.9 70.1 27.8 2.1 68.0
Q4:24-25         71.4 26.4 2.2 69.2
‘Increase’ in Overall business situation is optimistic.
@: Due to rounding off percentage may not add up to 100.
#: Net Response (NR) is the difference of percentage of the respondents reporting optimism and that reporting pessimism. The range is -100 to 100. Any value greater than zero indicates expansion/ optimism and any value less than zero indicates contraction/ pessimism.
 
Table S2: Assessment and Expectation for Turnover
(Percentage responses)
Quarter Assessment Expectation
Increase No Change Decrease Net response Increase No Change Decrease Net response
Q3:23-24 48.2 35.9 15.9 32.3 40.3 49.9 9.8 30.5
Q4:23-24 51.6 34.3 14.0 37.6 59.8 33.8 6.4 53.4
Q1:24-25 45.2 43.1 11.7 33.5 70.5 23.6 5.9 64.6
Q2:24-25 43.6 43.5 12.9 30.7 71.9 24.8 3.3 68.7
Q3:24-25 44.8 44.0 11.2 33.5 71.9 25.2 3.0 68.9
Q4:24-25         74.1 23.3 2.6 71.6
‘Increase’ in Turnover is optimistic. Footnotes @ and # given in Table S1 are applicable here.
 
Table S3: Assessment and Expectation for Full-time Employees
(Percentage responses)
Quarter Assessment Expectation
Increase No Change Decrease Net response Increase No Change Decrease Net response
Q3:23-24 29.9 61.6 8.5 21.4 26.4 63.7 9.9 16.5
Q4:23-24 33.9 57.1 9.0 24.8 32.4 64.0 3.6 28.8
Q1:24-25 34.8 58.2 7.0 27.8 48.4 49.5 2.1 46.3
Q2:24-25 29.0 62.0 9.0 20.1 52.2 46.0 1.7 50.5
Q3:24-25 34.5 58.7 6.8 27.8 45.8 52.4 1.8 44.0
Q4:24-25         54.3 44.0 1.7 52.6
‘Increase’ in Full-time Employees is optimistic. Footnotes @ and # given in Table S1 are applicable here.
 
Table S4: Assessment and Expectation for Part-time Employees
(Percentage responses)
Quarter Assessment Expectation
Increase No Change Decrease Net response Increase No Change Decrease Net response
Q3:23-24 21.5 70.3 8.2 13.2 31.0 52.3 16.7 14.4
Q4:23-24 30.2 62.4 7.5 22.7 28.8 65.4 5.8 23.1
Q1:24-25 28.9 65.0 6.1 22.7 50.8 46.7 2.5 48.3
Q2:24-25 22.2 69.6 8.3 13.9 55.4 42.1 2.5 52.9
Q3:24-25 29.7 64.4 5.9 23.8 54.1 43.8 2.1 52.1
Q4:24-25         59.0 38.9 2.2 56.8
‘Increase’ in Part-time Employees is optimistic. Footnotes @ and # given in Table S1 are applicable here.
 
Table S5: Assessment and Expectation for Availability of Finance
(Percentage responses)
Quarter Assessment Expectation
Improve No Change Worsen Net response Improve No Change Worsen Net response
Q3:23-24 32.3 60.3 7.4 24.9 31.5 61.1 7.3 24.2
Q4:23-24 36.3 55.3 8.4 27.8 40.4 56.7 2.9 37.4
Q1:24-25 37.9 56.2 5.9 32.0 56.4 42.5 1.1 55.3
Q2:24-25 28.5 62.8 8.7 19.8 58.8 40.0 1.2 57.6
Q3:24-25 34.7 58.9 6.4 28.3 51.4 47.2 1.4 50.1
Q4:24-25         58.0 40.6 1.4 56.6
‘Improve’ in Availability of Finance is optimistic. Footnotes @ and # given in Table S1 are applicable here.
 
Table S6: Assessment and Expectation for Cost of Finance
(Percentage responses)
Quarter Assessment Expectation
Increase No Change Decrease Net response Increase No Change Decrease Net response
Q3:23-24 36.5 59.3 4.2 -32.3 32.8 61.0 6.2 -26.6
Q4:23-24 38.0 55.6 6.5 -31.5 38.1 58.2 3.7 -34.4
Q1:24-25 40.0 55.1 4.9 -35.1 51.0 43.5 5.5 -45.5
Q2:24-25 36.6 59.0 4.3 -32.3 59.4 38.0 2.6 -56.9
Q3:24-25 38.9 57.7 3.4 -35.4 55.9 42.5 1.6 -54.3
Q4:24-25         61.1 37.0 1.9 -59.2
‘Decrease’ in Cost of Finance is optimistic. Footnotes @ and # given in Table S1 are applicable here.
 
Table S7: Assessment and Expectation for Salary/Wages
(Percentage responses)
Quarter Assessment Expectation
Increase No Change Decrease Net response Increase No Change Decrease Net response
Q3:23-24 42.4 53.5 4.0 -38.4 33.6 62.3 4.1 -29.5
Q4:23-24 34.8 60.7 4.5 -30.2 38.6 59.6 1.8 -36.8
Q1:24-25 45.3 52.0 2.7 -42.6 46.7 53.3 0.0 -46.7
Q2:24-25 29.9 66.0 4.1 -25.8 54.5 44.9 0.7 -53.8
Q3:24-25 33.5 63.5 3.0 -30.4 45.0 54.5 0.5 -44.5
Q4:24-25         55.7 43.7 0.6 -55.1
‘Decrease’ in Salary/Wages is optimistic. Footnotes @ and # given in Table S1 are applicable here.
 
Table S8: Assessment and Expectation for Cost of Inputs
(Percentage responses)
Quarter Assessment Expectation
Increase No Change Decrease Net response Increase No Change Decrease Net response
Q3:23-24 44.6 48.6 6.8 -37.9 32.1 57.9 9.9 -22.2
Q4:23-24 46.7 49.3 4.0 -42.8 47.4 50.9 1.7 -45.7
Q1:24-25 47.5 49.6 2.9 -44.7 57.1 42.5 0.4 -56.7
Q2:24-25 44.4 51.8 3.8 -40.6 66.5 32.9 0.6 -65.9
Q3:24-25 46.2 50.4 3.4 -42.7 65.6 33.1 1.3 -64.2
Q4:24-25         69.4 30.1 0.5 -68.9
‘Decrease’ in Cost of Inputs is optimistic. Footnotes @ and # given in Table S1 are applicable here.
 
Table S9: Assessment and Expectation for Selling Price
(Percentage responses)
Quarter Assessment Expectation
Increase No Change Decrease Net response Increase No Change Decrease Net response
Q3:23-24 24.3 66.6 9.2 15.1 26.4 61.5 12.1 14.2
Q4:23-24 29.9 62.6 7.5 22.4 35.3 60.0 4.7 30.7
Q1:24-25 26.9 67.9 5.2 21.7 52.4 46.0 1.6 50.8
Q2:24-25 20.5 71.1 8.4 12.1 55.5 43.2 1.4 54.1
Q3:24-25 29.0 64.1 6.9 22.2 50.4 47.3 2.3 48.0
Q4:24-25         57.9 39.8 2.3 55.6
‘Increase’ in Selling Price is optimistic. Footnotes @ and # given in Table S1 are applicable here.
 
Table S10: Assessment and Expectation for Profit Margin
(Percentage responses)
Quarter Assessment Expectation
Increase No Change Decrease Net response Increase No Change Decrease Net response
Q3:23-24 27.1 55.5 17.4 9.7 27.3 59.2 13.5 13.8
Q4:23-24 29.6 57.0 13.3 16.3 36.1 55.2 8.6 27.5
Q1:24-25 26.5 57.5 16.0 10.5 50.6 45.1 4.2 46.4
Q2:24-25 21.0 62.1 16.8 4.2 49.6 46.3 4.2 45.4
Q3:24-25 28.4 58.2 13.4 15.0 42.3 53.7 3.9 38.4
Q4:24-25         52.6 43.7 3.7 48.9
‘Increase’ in Profit Margin is optimistic. Footnotes @ and # given in Table S1 are applicable here.
 
Table S11: Assessment and Expectation for Inventories
(Percentage responses)
Quarter Assessment Expectation
Increase No Change Decrease Net response Increase No Change Decrease Net response
Q3:23-24 29.6 62.9 7.5 22.2 34.5 53.9 11.6 22.9
Q4:23-24 32.2 60.9 6.9 25.4 34.2 60.0 5.8 28.3
Q1:24-25 31.2 62.0 6.9 24.3 50.9 45.9 3.2 47.8
Q2:24-25 24.5 69.4 6.1 18.4 54.3 43.4 2.3 52.0
Q3:24-25 29.8 64.6 5.5 24.3 47.7 51.3 1.1 46.6
Q4:24-25         55.0 43.6 1.4 53.6
‘Increase’ in Inventories is optimistic. Footnotes @ and # given in Table S1 are applicable here.
 
Table S12: Assessment and Expectation for Technical/Service Capacity
(Percentage responses)
Quarter Assessment Expectation
Increase No Change Decrease Net response Increase No Change Decrease Net response
Q3:23-24 22.6 75.8 1.6 21.0 41.9 56.3 1.9 40.0
Q4:23-24 29.1 66.2 4.8 24.3 34.1 65.9 0.0 34.1
Q1:24-25 29.4 67.4 3.2 26.2 54.7 45.3 0.0 54.7
Q2:24-25 23.0 72.5 4.5 18.5 57.2 42.5 0.2 57.0
Q3:24-25 32.4 64.2 3.4 29.0 58.6 41.1 0.3 58.3
Q4:24-25         64.3 35.0 0.7 63.6
‘Increase’ in Technical/Service Capacity is optimistic. Footnotes @ and # given in Table S1 are applicable here.
 
Table S13: Assessment and Expectation for Physical Investment
(Percentage responses)
Quarter Assessment Expectation
Increase No Change Decrease Net response Increase No Change Decrease Net response
Q3:23-24 21.7 76.6 1.6 20.1 23.3 75.8 0.9 22.3
Q4:23-24 28.0 66.7 5.3 22.6 32.2 67.8 0.0 32.2
Q1:24-25 27.4 69.3 3.2 24.2 53.8 45.7 0.5 53.2
Q2:24-25 21.6 72.9 5.5 16.1 55.7 44.1 0.3 55.4
Q3:24-25 30.2 66.4 3.4 26.8 57.0 42.7 0.3 56.7
Q4:24-25         61.5 37.7 0.9 60.6
‘Increase’ in Physical Investment is optimistic. Footnotes @ and # given in Table S1 are applicable here.
 
Table S14: Estimated Spare Capacity for the Services Sector
Survey conducted during Reference quarter Response rate for the question on Spare Capacity
(per cent)
Spare Capacity
(per cent)
Q2:2022-23 Q1:2022-23 79.5 13.5
Q3:2022-23 Q2:2022-23 25.2 12.6
Q4:2022-23 Q3:2022-23 63.0 13.8
Q1:2023-24 Q4:2022-23 79.8 13.6
Q2:2023-24 Q1:2023-24 84.3 12.3
Q3:2023-24 Q2:2023-24 74.0 11.8
Q4:2023-24 Q3:2023-24 74.8 11.7
Q1:2024-25 Q4:2023-24 78.8 11.3
Q2:2024-25 Q1:2024-25 71.5 11.2
Q3:2024-25 Q2:2024-25 79.9 10.6

Infrastructure Sector

Table I1: Assessment and Expectation for Overall Business Situation
(Percentage responses)@
Quarter Assessment Expectation
Better No Change Worse Net response# Better No Change Worse Net response
Q3:23-24 44.2 45.8 10.0 34.2 67.3 29.8 2.9 64.4
Q4:23-24 45.0 42.5 12.5 32.5 73.1 21.8 5.0 68.1
Q1:24-25 37.7 51.3 11.0 26.6 70.3 25.4 4.2 66.1
Q2:24-25 38.4 44.9 16.7 21.7 76.5 21.6 2.0 74.5
Q3:24-25 40.2 47.2 12.6 27.6 70.3 26.8 2.9 67.4
Q4:24-25         70.9 25.2 3.9 66.9
‘Increase’ in Overall business situation is optimistic.
@: Due to rounding off percentage may not add up to 100.
#: Net Response (NR) is the difference of percentage of the respondents reporting optimism and that reporting pessimism. The range is -100 to 100. Any value greater than zero indicates expansion/ optimism and any value less than zero indicates contraction/ pessimism.
 
Table I2: Assessment and Expectation for Turnover
(Percentage responses)
Quarter Assessment Expectation
Increase No Change Decrease Net response Increase No Change Decrease Net response
Q3:23-24 47.9 40.3 11.8 36.1 53.8 42.3 3.8 50.0
Q4:23-24 42.5 42.5 15.0 27.5 75.6 22.7 1.7 73.9
Q1:24-25 37.7 51.3 11.0 26.6 68.4 24.8 6.8 61.5
Q2:24-25 41.3 42.8 15.9 25.4 73.2 23.5 3.3 69.9
Q3:24-25 44.1 42.5 13.4 30.7 73.2 24.6 2.2 71.0
Q4:24-25         72.7 24.2 3.1 69.5
‘Increase’ in Turnover is optimistic. Footnotes @ and # given in Table I1 are applicable here.
 
Table I3: Assessment and Expectation for Full-time Employees
(Percentage responses)
Quarter Assessment Expectation
Increase No Change Decrease Net response Increase No Change Decrease Net response
Q3:23-24 32.5 57.3 10.3 22.2 42.3 54.8 2.9 39.4
Q4:23-24 27.5 65.0 7.5 20.0 63.2 34.2 2.6 60.7
Q1:24-25 31.2 59.1 9.7 21.4 47.5 51.7 0.8 46.6
Q2:24-25 28.3 61.6 10.1 18.1 64.7 33.3 2.0 62.7
Q3:24-25 30.7 60.6 8.7 22.0 41.5 56.3 2.2 39.3
Q4:24-25         48.4 48.4 3.1 45.3
‘Increase’ in Full-time Employees is optimistic. Footnotes @ and # given in Table I1 are applicable here.
 
Table I4: Assessment and Expectation for Part-time Employees
(Percentage responses)
Quarter Assessment Expectation
Increase No Change Decrease Net response Increase No Change Decrease Net response
Q3:23-24 35.8 57.5 6.6 29.2 60.3 34.5 5.2 55.2
Q4:23-24 29.2 66.3 4.5 24.7 68.3 31.7 0.0 68.3
Q1:24-25 32.8 59.9 7.3 25.5 55.8 41.9 2.3 53.5
Q2:24-25 21.5 66.7 11.8 9.7 63.7 33.3 3.0 60.7
Q3:24-25 30.3 61.6 8.1 22.2 54.3 40.2 5.4 48.9
Q4:24-25         62.0 34.0 4.0 58.0
‘Increase’ in Part-time Employees is optimistic. Footnotes @ and # given in Table I1 are applicable here.
 
Table I5: Assessment and Expectation for Availability of Finance
(Percentage responses)
Quarter Assessment Expectation
Improve No Change Worsen Net response Improve No Change Worsen Net response
Q3:23-24 36.7 57.5 5.8 30.8 46.6 49.5 3.9 42.7
Q4:23-24 34.7 58.5 6.8 28.0 63.0 35.3 1.7 61.3
Q1:24-25 35.1 59.1 5.8 29.2 58.6 40.5 0.9 57.8
Q2:24-25 31.4 55.5 13.1 18.2 68.0 32.0 0.0 68.0
Q3:24-25 34.1 57.9 7.9 26.2 55.1 44.1 0.7 54.4
Q4:24-25         60.8 37.6 1.6 59.2
‘Improve’ in Availability of Finance is optimistic. Footnotes @ and # given in Table I1 are applicable here.
 
Table I6: Assessment and Expectation for Cost of Finance
(Percentage responses)
Quarter Assessment Expectation
Increase No Change Decrease Net response Increase No Change Decrease Net response
Q3:23-24 38.2 55.5 6.4 -31.8 54.2 45.8 0.0 -54.2
Q4:23-24 35.2 61.1 3.7 -31.5 61.7 37.4 0.9 -60.7
Q1:24-25 36.4 56.3 7.3 -29.1 60.4 38.7 0.9 -59.4
Q2:24-25 38.3 50.0 11.7 -26.6 65.1 32.2 2.7 -62.4
Q3:24-25 37.3 52.4 10.3 -27.0 63.5 33.3 3.2 -60.3
Q4:24-25         60.7 36.9 2.5 -58.2
‘Decrease’ in Cost of Finance is optimistic. Footnotes @ and # given in Table I1 are applicable here.
 
Table I7: Assessment and Expectation for Salary/Wages
(Percentage responses)
Quarter Assessment Expectation
Increase No Change Decrease Net response Increase No Change Decrease Net response
Q3:23-24 44.9 50.8 4.2 -40.7 41.2 56.9 2.0 -39.2
Q4:23-24 27.7 70.6 1.7 -26.1 59.8 39.3 0.9 -59.0
Q1:24-25 38.3 57.8 3.9 -34.4 55.2 44.8 0.0 -55.2
Q2:24-25 31.9 63.0 5.1 -26.8 70.6 29.4 0.0 -70.6
Q3:24-25 34.9 61.1 4.0 -31.0 43.1 56.9 0.0 -43.1
Q4:24-25         47.6 52.4 0.0 -47.6
‘Decrease’ in Salary/Wages is optimistic. Footnotes @ and # given in Table I1 are applicable here.
 
Table I8: Assessment and Expectation for Cost of Inputs
(Percentage responses)
Quarter Assessment Expectation
Increase No Change Decrease Net response Increase No Change Decrease Net response
Q3:23-24 52.1 43.6 4.3 -47.9 52.0 41.0 7.0 -45.0
Q4:23-24 52.6 43.9 3.5 -49.1 59.1 37.4 3.5 -55.7
Q1:24-25 42.2 51.7 6.1 -36.1 63.4 36.6 0.0 -63.4
Q2:24-25 49.2 42.3 8.5 -40.8 75.9 23.4 0.7 -75.2
Q3:24-25 48.0 45.6 6.4 -41.6 70.8 29.2 0.0 -70.8
Q4:24-25         70.4 29.6 0.0 -70.4
‘Decrease’ in Cost of Inputs is optimistic. Footnotes @ and # given in Table I1 are applicable here.
 
Table I9: Assessment and Expectation for Selling Price
(Percentage responses)
Quarter Assessment Expectation
Increase No Change Decrease Net response Increase No Change Decrease Net response
Q3:23-24 37.0 54.0 9.0 28.0 42.4 53.3 4.3 38.0
Q4:23-24 28.9 61.1 10.0 18.9 62.0 36.0 2.0 60.0
Q1:24-25 30.8 60.0 9.2 21.5 60.7 33.7 5.6 55.1
Q2:24-25 24.5 61.8 13.6 10.9 69.8 27.1 3.1 66.7
Q3:24-25 27.0 63.1 9.9 17.1 52.7 44.5 2.7 50.0
Q4:24-25         56.4 43.6 0.0 56.4
‘Increase’ in Selling Price is optimistic. Footnotes @ and # given in Table I1 are applicable here.
 
Table I10: Assessment and Expectation for Profit Margin
(Percentage responses)
Quarter Assessment Expectation
Increase No Change Decrease Net response Increase No Change Decrease Net response
Q3:23-24 35.0 55.0 10.0 25.0 37.3 56.9 5.9 31.4
Q4:23-24 26.1 56.3 17.6 8.4 56.3 36.1 7.6 48.7
Q1:24-25 28.6 59.7 11.7 16.9 54.7 38.5 6.8 47.9
Q2:24-25 26.8 52.2 21.0 5.8 65.1 31.6 3.3 61.8
Q3:24-25 28.0 55.2 16.8 11.2 45.7 49.3 5.1 40.6
Q4:24-25         55.2 40.0 4.8 50.4
‘Increase’ in Profit Margin is optimistic. Footnotes @ and # given in Table I1 are applicable here.
 
Table I11: Assessment and Expectation for Inventories
(Percentage responses)
Quarter Assessment Expectation
Increase No Change Decrease Net response Increase No Change Decrease Net response
Q3:23-24 41.7 53.4 4.9 36.9 60.5 36.8 2.6 57.9
Q4:23-24 34.0 62.1 3.9 30.1 75.2 23.8 1.0 74.3
Q1:24-25 34.8 59.4 5.8 29.0 58.0 39.0 3.0 55.0
Q2:24-25 30.4 59.8 9.8 20.5 71.5 27.0 1.5 70.1
Q3:24-25 35.6 56.8 7.6 28.0 59.1 38.2 2.7 56.4
Q4:24-25         62.4 35.9 1.7 60.7
‘Increase’ in Inventories is optimistic. Footnotes @ and # given in Table I1 are applicable here.
 
Table I12: Assessment and Expectation for Technical/Service Capacity
(Percentage responses)
Quarter Assessment Expectation
Increase No Change Decrease Net response Increase No Change Decrease Net response
Q3:23-24 39.8 55.9 4.3 35.5 66.7 33.3 0.0 66.7
Q4:23-24 32.5 64.9 2.6 29.9 75.0 25.0 0.0 75.0
Q1:24-25 36.2 59.5 4.3 31.9 66.2 32.4 1.4 64.9
Q2:24-25 30.9 57.4 11.8 19.1 79.1 20.9 0.0 79.1
Q3:24-25 32.9 62.0 5.1 27.8 72.5 27.5 0.0 72.5
Q4:24-25         68.8 30.0 1.3 67.5
‘Increase’ in Technical/Service Capacity is optimistic. Footnotes @ and # given in Table I1 are applicable here.
 
Table I13: Assessment and Expectation for Physical Investment
(Percentage responses)
Quarter Assessment Expectation
Increase No Change Decrease Net response Increase No Change Decrease Net response
Q3:23-24 35.8 60.0 4.2 31.6 46.8 53.2 0.0 46.8
Q4:23-24 28.6 68.8 2.6 26.0 75.3 24.7 0.0 75.3
Q1:24-25 33.1 61.2 5.8 27.3 64.0 36.0 0.0 64.0
Q2:24-25 36.5 52.7 10.8 25.7 75.8 24.2 0.0 75.8
Q3:24-25 32.6 61.6 5.8 26.7 75.3 24.7 0.0 75.3
Q4:24-25         71.1 28.9 0.0 71.1
‘Increase’ in Physical Investment is optimistic. Footnotes @ and # given in Table I1 are applicable here.

1 The survey results reflect the respondents’ views, which are not necessarily shared by the Reserve Bank.

2 Results of the previous survey round were released on the Bank’s website on October 09, 2024.

3 Net Response (NR) is the difference between the percentage of respondents reporting optimism and those reporting pessimism. It ranges between -100 to 100. Positive value indicates expansion/optimism and negative value indicates contraction/pessimism. In other words, NR = (I – D); where, I is the percentage response of ‘Increase/optimism’, D is the percentage response of ‘Decrease/pessimism’ and E is the percentage response as ‘no change/ equal’ (i.e., I+D+E=100).  For example, increase in turnover is optimism whereas decrease in cost of inputs is optimism.

RbiTtsCommonUtility

प्ले हो रहा है
ಕೇಳಿ

Related Assets

RBI-Install-RBI-Content-Global

RbiSocialMediaUtility

ಭಾರತೀಯ ರಿಸರ್ವ್ ಬ್ಯಾಂಕ್ ಮೊಬೈಲ್ ಅಪ್ಲಿಕೇಶನ್ ಅನ್ನು ಇನ್ಸ್ಟಾಲ್ ಮಾಡಿ ಮತ್ತು ಇತ್ತೀಚಿನ ಸುದ್ದಿಗಳಿಗೆ ತ್ವರಿತ ಅಕ್ಸೆಸ್ ಪಡೆಯಿರಿ!

Scan Your QR code to Install our app

RbiWasItHelpfulUtility

ಈ ಪುಟವು ಸಹಾಯಕವಾಗಿತ್ತೇ?