 IST,
IST,
V. Financial Markets
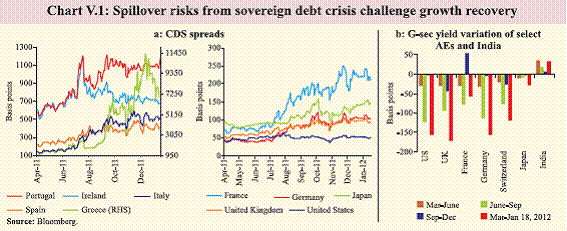
Global financial markets witnessed increased stress during Q3 of 2011-12. An adverse feedback loop between bank and sovereign debt brought euro area closer to contagion across region. Significant policy actions by the EU in December 2011 helped provide a temporary reprieve, but did not avert the sovereign rating downgrade of nine euro area countries in January 2012. Indian financial markets, especially currency and equity, witnessed pressures from global spillovers and weakening macroeconomy. Both dollar and rupee liquidity tightened, but countervailing steps helped mitigate the strains. Pressure on domestic liquidity was effectively contained by the OMO purchases by the Reserve Bank. Dollar flows were enhanced through capital account measures that curbed speculation. Going forward, markets may face more episodes of spillovers. Global financial markets witness stress amidst sovereign debt crisis V.1 Intensifying concerns over the fragile global recovery and debt sustainability, challenges involved in meeting fiscal austerity targets, European banks’ high balance sheet exposure to troubled sovereign debt loomed large over the global financial market functioning during Q3 of 2011-12. The EU responded with significant policy action during December 2011, but continued stress was reflected in rating downgrade of European Financial Stability Fund (EFSF) and nine euro area countries by S&P, of which four were downgraded by two notches. In this backdrop sovereign risk premia has risen sharply in the euro area (Chart V.1). Going forward, financial markets in 2012 are likely to witness continued volatility.
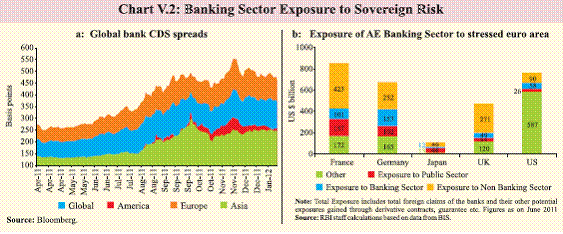
Bailouts in face of strong feedback loop between bank and sovereign debt provide temporary reprieve V.2 With euro area sovereigns compelled to fund bailouts for private debt to avert a meltdown, an adverse feedback loop has been generated from private to sovereign balance sheets and then from the latter to the former. With rising risk premia and the impact of large supply of government paper, losses have been inflicted on the existing bondholders. With falling value of sovereign guarantees and increasing sensitivity to sovereign debt shocks, both private and sovereign balance sheets have weakened. Initially, the bank CDS spreads in the euro area widened (Chart V.2a). Thereafter, with bailouts, sovereign spreads came under pressure.
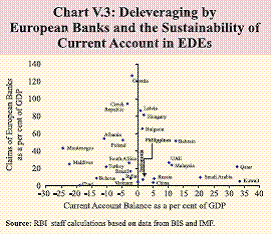
V.3 During Q3 of 2011-12, significant policy action has been taken to reduce stress. On October 26, 2011, euro area leaders reached a deal built on (i) bank recapitalisation (estimated at €106 billion); (ii) voluntary bond exchange at discount (implying 50 per cent haircut for private holders of Greek debt); and (iii) upscaling the €440 billion EFSF via bond insurance and Special Purpose Vehicles (SPVs) leveraging resources 4 to 5 times to a headline figure of around €1 trillion, aimed at preventing the spread of crisis. Again in December, the euro area countries reached a deal towards fiscal targets to be met, and to provide additional funding of €150 billion to the IMF to support further bailouts. The ECB also stepped in, first cutting policy rate and then lending €489 billion in a single operation of 3-year long-term repo to over 500 euro area banks. The US Fed, the ECB and four other central banks agreed to halve the cost of US$ swap lines to 50 bps over overnight index swaps (OIS). On January 18, 2012, the IMF has proposed to raise its funding potential by $500 billion. V.4 Most of these measures provided temporary reprieve but did not lead to resolution of debt crisis. Current assessment is that financial volatility may persist as haircuts required on Greek debt are larger than being sought. Extra repo funding by the ECB may not seamlessly flow to the sovereign debt markets. Wide scale downgrades of banks and sovereigns have made debt refinancing more difficult in the face of such uncertainty. Risk of contagion of euro area crisis to AE banking sector looms large V.5 Latest stress tests conducted by the European Banking Authority (EBA) show that the capital shortfall of German banks has trebled during October – December 2011 to € 13.1 billion while the combined Europe-wide capital deficit of banks rose from €106 billion to €115 billion. Banks in most AEs, including core euro area, have significant direct and indirect exposure to distressed euro area economies (such as Portugal, Ireland, Italy, Greece and Spain). The most exposed are the banks in euro area, like Germany and France, followed by US and UK (Chart V.2b). This increases the risk of a more generalised contagion to other AEs through the banking channel. V.6 In the event of a financial landslide in these distressed euro area economies, the vulnerability of the AE banks would limit the credit availability and the fallout on real activity of these AEs could be severe. According to the latest surveys, the deepening euro area debt crisis is limiting banks’ lending capacity in UK. Similarly, the US Fed’s latest survey of loan officers concluded that credit conditions in the recent months have tightened. Deleveraging by European banks may exacerbate capital outflows from EDEs V.7 Intensifying concern about the capital constraints of euro area banking system (due to the balance sheet effects of sovereign debt problems) is likely to trigger deleveraging by European banks and their lending to EDEs could decline. The dependence on European banks for funding can be expressed by the European banks’ claims in these countries as a proportion of their GDP (Chart V.3).
V.8 However, those EDEs which have both a CAD and a high exposure to European banks face an additional problem of sustaining their current account deficit in the event of deleveraging and capital outflows. India has low exposure to European claims. Nevertheless, India too may face some shrinkage in the availability of credit, particularly trade credit, and escalation in the cost of borrowing. Indian financial markets witness pressures from global spillovers V.9 The impact of the global financial instability on India has been discernible, though the impact has been limited by the flexibility of exchange rate. Equity and currency markets faced pressures. India is a structurally current account deficit country. The deficit is financed by capital inflows, which generally have been large and stable to finance CAD and support growth. However, global market turmoil resulted in rising risk aversion and moderation in capital inflows that resulted in currency pressures during August-December 2011, just as it did during July 2008 to February 2009. However, equity markets and exchange rate have recovered from their end-December 2011 levels in January 2012 (up to January 18, 2012) with net FII inflows on the back of moderation in the inflation, among other factors.
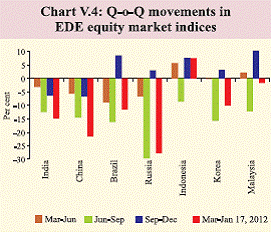
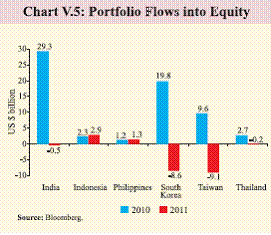
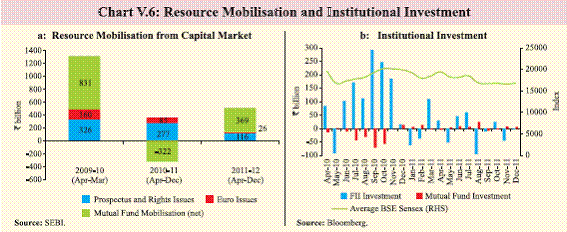
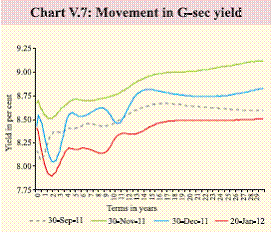
Indian equity markets face stress due to macro-risks and rupee depreciation V.10 Indian equity prices continued their declining trend in Q3 of 2011-12, led by worsening macroeconomic environment and anticipated lower earning growth that resulted in net sales by FIIs (Chart V.4). Heightened risk aversion and deleveraging induced by the euro area crisis impacted financial markets in EDEs, including India, in Q3 of 2011-12. The negative trend in S&P CNX Nifty was in line with EDE indices. As a result of significant correction, PE ratio of Indian equity market has moderated to 16.9 as at end-December 2011 from 17.6 as at end-March 2011. Equity markets, however, turned around during 2012 so far. Dampened capital inflows drive sharp fall in value of rupee V.11 Capital flow moderation coupled with higher trade deficit led to a sharp fall in the exchange rate of the Indian rupee during August-December 2011. Speculative trades reinforced this trend. After slipping to an all time low of ` 54.3 per US dollar on December 15, 2011, the rupee reversed to 50.3 as on January 20, 2012. The reversal followed measures to boost capital inflows. The rupee depreciation reflected drying up of portfolio flows to India and the resulting gap in financing higher CAD (please refer to Chart III.2, Chart V.5). Against the backdrop of the prevailing external economic environment, the confidence channel seem to have also played a significant role. An increase in the FII investment limit coupled with the high risk adjusted rate of return boosted net FII inflows into the debt segment during 2011. Primary market resource mobilisation dries up V.12 Firms abstained from mobilising resources by way of public issues during October- December 2011 when investors’ risk appetite was low. The continued negative returns in stock markets and IPOs after their listing during the first half of 2011-12 adversely affected investor and promoter sentiments (Chart V.6a). On the external front, resources mobilised through Euro issues were lower due to tight liquidity conditions in the European banking system on the back of the persisting euro area debt crisis. V.13 During 2011-12 (up to end-December), FIIs made net sales of `43.8 billion in the equity segment while mutual funds made net purchases of `42.2 billion (Chart V.6b). However, FIIs made net purchase of `54 billion in January 2012 (up to January 18, 2012). G-sec yields soften despite higher government borrowings V.14 During Q3, the G-sec yields hardened till mid-November 2011 in the wake of large government borrowing and market anticipation of fiscal slippage during the year. However, the G-sec yields softened since mid-November 2011 primarily due to enhancement of FII investment limit in debt, pause in monetary tightening, signs of softening in inflation and open market operations (OMOs). Inspite of the large additional market borrowing by the government, yield did not rise as the Reserve Bank purchased G-secs of `719 billion (up to January 20, 2012) through OMOs in response to the systemic liquidity deficit (Chart V.7). The Reserve Bank’s commitment to conduct further OMOs as and when deemed appropriate also assuaged market sentiment.
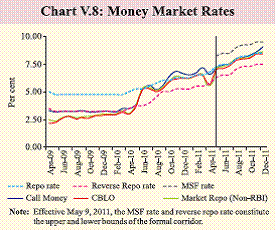
Interest rates stay firm V.15 Interest rates stayed firm during Q3 of 2011-12 on the back of October rate hike, large government borrowings, tight liquidity and interest rate deregulation. Unlike the forex and equity markets, the money and G-sec markets were relatively unaffected by the global factors, but continued to be predominantly conditioned by domestic macroeconomic dynamics. The money market rates continued to be relatively high in Q3 of 2011-12, reflecting tight liquidity conditions and the effect of successive hikes in policy rates by the Reserve Bank (Chart V.8).
V.16 The call rate hardened in December 2011, averaging 9.04 per cent on the backdrop of tight liquidity conditions largely on account of advance tax outflows. Tracking the call rate, the rates in the collateralised segments (i.e., CBLO and market repo) also rose. To ease the liquidity pressure in the system, apart from the purchase of G-secs through OMOs, the Reserve Bank allowed banks to avail overnight funds under the Marginal Standing Facility (MSF) also against their excess SLR holdings from December 21, 2011. V.17 The yields on auction Treasury Bills (TBs) firmed up till mid-December 2011 reflecting the marked increase in the short-term borrowings of the Centre through issuances of TBs and cash management bills and the rise in the policy rates in October 2011. The auction cut-offs declined following the mid-quarter guidance on policy rates, notwithstanding the seasonal hardening of liquidity conditions. Modest rise in deposit rates V.18 Following the move to deregulate the savings bank deposit interest rate as laid out in the Second Quarter Review of Monetary Policy 2011-12 (October 25, 2011), six scheduled commercial banks (SCBs) have raised their rates in the range of 100-300 bps so far. While the major banks with large outstanding CASA holdings did not raise their saving bank deposit rate in response to the deregulation of savings bank deposit rates, as per the latest available information, all public sector banks, major private sector banks and five foreign banks offered higher competitive rates to their NRE term deposit accounts following its deregulation effective December 16, 2011. These banks have so far increased their average NRE term deposit rates in the range of 430-516 bps across various maturities.
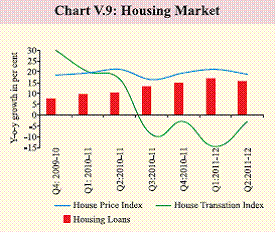
V.19 During Q3 of 2011-12, banks increased their deposit rates with relatively sharper rise for maturities up to 1 year, particularly by private sector and foreign banks. For maturity up to 1 year, the modal deposit rate for SCBs increased by 44 bps while the modal Base Rate continued to remain at 10.75 per cent during Q3 of 2011-12 (Table V.1). Housing market witness price rigidities amidst falling demand V.20 Despite the deceleration in overall credit off-take, housing loans continued to grow at a higher rate during Q2 of 2011-12 than the corresponding quarter of the previous year. Higher housing loans coupled with price rigidities in the housing market reflect the continued pricing power with the developers as also the increasingly stretched balance sheets of residential buyers. The lower volume of transactions implies that many other households are getting priced out from the housing market (Chart V.9). But data for Q2 of 2011-12 indicate further increase in property prices in most cities though at a slower pace. Also, in contrast with the preceding quarter, there was some increase in transaction volume. These volumes, however, remained lower on a y-o-y basis. Property markets are facing moderation in demand, but price correction has not occurred as real estate firms are holding land banks and slowing new launches and sales to retain pricing power.
V.21 The Reserve Bank’s Quarterly House Price Index (HPI), based on the data on transaction of properties collected from the registration departments of respective state governments, now covering 9 cities indicates a hike in q-o-q prices in all cities during Q2 of 2011-12 except for Bengaluru. On the other hand, the data on volume of transactions for the same period show increase in the number of transactions in six cities, except Mumbai and the recently included cities of Kanpur and Jaipur.
Financial stability risks may increase if euro area stress increases V.22 Going forward, the funding costs of the domestic banking and corporate sectors will be impacted by a host of domestic and global factors. The on-going deceleration in economic activity and a benign inflation environment can reduce the domestic funding costs. Reversal of capital flows cannot be ruled out if euro area stress increases further. The Indian banks continued to be resilient notwithstanding a marginal decline in capital adequacy and a slight increase in the level of non-performing assets in certain sectors in the recent period and should be able to withstand the adverse fallouts of the euro area crisis. V.23 Global factors aside, the rising import bill, decelerating export growth, pace of reform initiatives towards boosting capital flows and domestic growth concerns are likely to influence the movements in the Indian financial markets. As inflation moderates ahead, the policy priority will shift towards revival of growth, which should help boost investor confidence and restore market sentiment. Nonetheless, the policy logjam in the euro area, the pace of recovery in AEs and growth momentum in EDEs will continue to influence capital flows to EDEs, including India. |
|||||||||||||||||||||||||||||||||||||||||||||||||||||||||||||||||||||||||||||||||||||||||||||||||||||||||||||||
ಪೇಜ್ ಕೊನೆಯದಾಗಿ ಅಪ್ಡೇಟ್ ಆದ ದಿನಾಂಕ:


