 IST,
IST,


V. Outstanding Liabilities, Market Borrowings and Contingent Liabilities of State Governments
The outstanding liabilities of state governments to GDP ratio declined during 2012-13(RE) and is budgeted to decline further during 2013-14. Market borrowings remained a dominant component of the outstanding liabilities of the states. Weighted average yield of state government securities issued during 2012-13 was higher, reflecting the impact of increased market borrowings and tight liquidity conditions. Although most states continued to build surplus cash balances, some states took increased recourse to ways and means advances (WMAs) and overdrafts in 2012-13. While the declining trend in the consolidated debt-GDP ratio is expected to continue, the ongoing financial restructuring of state-owned distribution companies (discoms) is likely to increase the liabilities of participating state governments in the coming years. 1. Introduction 5.1 The outstanding state government liabilities as a ratio to GDP showed a declining trend. There was, however, an increase in market borrowings, which along with the tight liquidity situation, pushed up the average interest rate on fresh market borrowings during 2012-13. In their budgets for 2012-13 and 2013-14, most state governments have indicated a move towards fiscal consolidation. Accordingly, the consolidated debt-GDP ratio of the states declined in 2012-13 and is budgeted to decline further in 2013-14. Against this backdrop, this chapter analyses the state governments’ outstanding liabilities, market borrowings, contingent liabilities, liquidity positions and cash management. 2. Outstanding Liabilities 5.2 Outstanding liabilities of state governments (at the consolidated level) as a proportion of GDP has been on a declining trend from 2004-05, reflecting the combined impact of favourable macroeconomic conditions and fiscal consolidation at the state level, complemented by debt relief and interest relief provided by the centre. In recent years, efforts by state governments to adhere to the debt ceilings stipulated under their amended FRBM Acts also resulted in a graduated reduction in their individual debt-GSDP ratios. 5.3 Although the secular decline in the debt- GDP ratio continued during 2012-13 (RE), the pace of reduction slowed down considerably as compared to the previous year, reflecting the impact of deceleration in nominal GDP growth and the increase in the GFD-GDP ratio (Table V.1). Magnitude 5.4 The outstanding liabilities of state governments in nominal terms increased by 9.1 per cent in 2012-13 (RE), reflecting an increase in the GFD-GDP ratio at the consolidated level. The growth in outstanding liabilities was more than offset by the growth in nominal GDP due to high inflation, resulting in a decline in the debt-GDP ratio during the year. Resultantly, the consolidated debt1-GDP ratio of state governments declined by 0.5 percentage points in 2012-13 (RE) (1.3 percentage points in 2011-12). It is budgeted to decline by a further 0.3 percentage points to 21.4 per cent in 2013-14, which is much lower than 24.9 per cent stipulated by FC-XIII for the year.
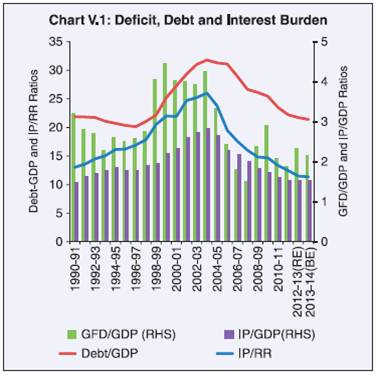
5.5 The overall debt sustainability of the states has improved over the years, as reflected in the indicator of interest payments to revenue receipts (IP-RR), which declined steadily from 26.0 per cent in 2003-04 to 11.5 per cent in 2012-13 (RE) and is budgeted to decline further to 11.4 per cent in 2013-14. The near stagnancy in the IP-RR ratio during 2012-13 (RE) and 2013-14 (BE) reflects the moderation in revenue growth, in the face of the economic slowdown (Chart V.1). Composition of Debt 5.6 The composition of states’ outstanding liabilities reveals increased reliance on market borrowings, which accounted for 40.2 per cent of their outstanding liabilities at end-March 2013. This is expected to rise further to 44.8 per cent by end-March 2014. On the other hand, the share of liabilities to NSSF has been steadily declining since end-March 2007. A steady decline in net collections under NSSF combined with increasing repayment obligations of the states has resulted in a decline in fresh investments by NSSF in state government securities. With a reduction in the mandatory allocation of net small savings collections from 80 per cent to 50 per cent from the fiscal year 2012-13, 17 states/UTs opted for a 50 per cent share in 2013-14 as was the case in the previous year (Table V.2). Similarly, the states’ dependence on loans from the centre continued to decline in 2012-13 (RE) and 2013- 14 (BE) (Table V.3). The share of public account items, which had risen at end-March 2011, has been declining since, although moderately. The detailed composition of the outstanding liabilities of state governments from 1990-91 to 2013-14 (BE) is given in Appendix Tables 11 and 12. The state-wise composition of outstanding liabilities is provided in Statements 18-20. 3. State-wise Debt Position 5.7 The states’ overall debt-GDP ratios have remained lower than the FC-XIII’s recommended targets for 2010-11 to 2013-14. The state-wise debt-GSDP position is given in Table V.4. Non-Special Category States 5.8 State-wise data reveal that in 2012-13, 15 of the 17 non-special category states recorded lower debt-GSDP ratios than they did in 2011- 12. Substantial improvement in debt-GSDP ratios was noted during the year in states like Odisha, Bihar, West Bengal and Karnataka. West Bengal continued to have the highest debt-GSDP ratio, followed by Punjab, Uttar Pradesh and Kerala. On the other hand, Chhattisgarh continued to have the lowest debt-GSDP ratio among all the states. As per budget estimates, 12 out of the 17 non-special category states are expected to record lower debt- GSDP ratios in 2013-14 than in 2012-13. The debt-GSDP ratio is budgeted to be higher in 2013- 14 in the case of Chhattisgarh, Karnataka, Punjab and Rajasthan, while it would remain unchanged at the previous year’s level for Madhya Pradesh. Debt-GSDP ratios during 2012-13 (RE) of all the 17 non-special category states remained lower than the recommended targets of the FC-XIII. This position is expected to be maintained in 2013-14 (BE) (Table V.4).
5.9 Consistent with the lower debt-GDP ratio, an improvement was noted in the debt servicing burden of the states. In 2012-13 (RE), most states were able to contain their interest payments to revenue receipts ratio (IP-RR) within 15 per cent, with the exception of West Bengal, Punjab, and Gujarat. Reflecting the magnitude of state debt, the IP-RR ratio was the lowest for Chhattisgarh at 4.0 per cent, and the highest for West Bengal, with interest payments pre-empting nearly one-fourth of the revenue receipts of the state. Special Category States 5.10 Special category states generally exhibit a higher debt-GSDP ratio than non-special category states, notwithstanding the receipt of higher grants from the centre. The geographic disabilities of these states result in cost disadvantages that increase their expenditure, on the one hand, and limit their fiscal capacity to raise their own resources, on the other. In 2012-13 (RE), the debt-GSDP ratio declined in all the special category states as compared to 2011-12 except in Tripura. With the exception of Assam, Jammu and Kashmir and Uttarakhand the debt-GSDP ratio is budgeted to decline during 2013-14 (BE) in all the special category states. It is budgeted to remain above 50 per cent in 2013-14 in Jammu and Kashmir, Manipur, Mizoram and Nagaland. Among the special category states, Meghalaya’s debt-GSDP ratio was marginally higher than FCXIII’s recommended targets in 2012-13 (RE). The debt-GSDP ratio of Jammu and Kashmir in 2013-14 is budgeted to be higher than FC-XIII’s recommended target. In all other special category states, debt-GSDP ratios have been budged to remain within the respective FC-XIII targets. 4. Market Borrowings Consolidated Position 5.11 Market borrowings have emerged as the most important source for financing the resource gaps of state governments in recent years. The outstanding stock of state development loans (SDLs) increased by 18.0 per cent in 2012-13. The interest profile of outstanding stock of SDLs shows that the share of high-cost market loans with interest rates of 10 per cent and above declined sharply over the years and as at end-March 2012, the state governments ceased to have any market loans with interest rates above 10 per cent (Table V.5). On the other hand, the share of market loans with interest rates ranging between 7-9 per cent increased from 80.1 per cent as at end-March 2008 to 82.6 per cent at end March 2013. Within this, almost two-thirds of the outstanding market loans had interest rates between 8-9 per cent, indicating that a major proportion of the incremental debt was raised at rates in this range. Allocation of Government Borrowings during 2012-13 and 2013-14 5.12 State governments’ gross market borrowings raised in 2012-13 were higher by 11.8 per cent than in 2011-12 (Table V.6). There were no instances of undersubscriptions in SDL auctions of 28 states as against 18 such instances last year. The issuances, however, witnessed subdued bidding by major investors like insurance companies and in such instances, the cut-off yields tended to be higher, leading to an increase in the interest payments of these states.
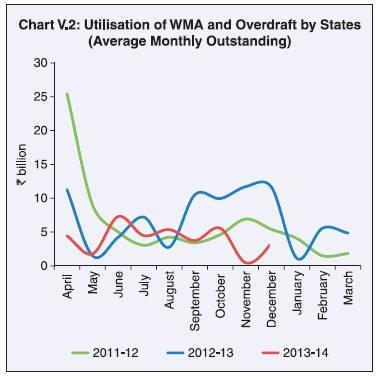
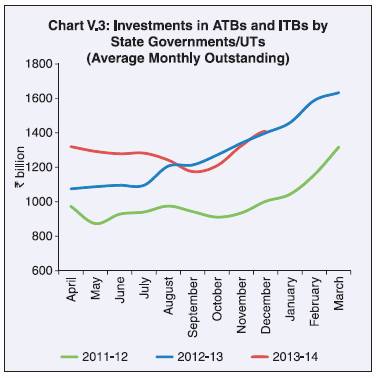
The weighted average cost of market borrowings of state governments increased marginally to 8.84 per cent in 2012-13 from 8.79 per cent in 2011-12, mainly on account of increased gross market borrowings over the previous year. The cut-off yields ranged between 8.42 per cent and 9.31 per cent. The weighted average spread2 in 2012-13 at 71 basis points was higher than 44 basis points in 2011-12. During 2013-14 so far (up to January 10, 2014), state governments have raised an aggregate amount of `1,410.6 billion on a gross basis, with cut-off yields ranging between 7.57- 9.94 per cent; weighted average interest rate during the period was 9.03 per cent. Maturity Profile of State Government Securities 5.13 Up to 2011-12, state government securities were issued for 10-year maturity only. Deviating from the normal issuance practice, some states were permitted to issue new SDL securities of 4-5 years tenor from July 2012, which attracted lower cut-off yields than that for the normal 10-year SDLs. The maturity profile of outstanding SDL stocks as at end-March 2013 reveals that a majority of the SDLs (around 77 per cent) were in the remaining maturity bucket of five years and above (Table V.7). The increase in market borrowings of state governments since 2008-09 entails large repayment obligations from 2017-18 onwards. Financial restructuring plans (FRPs) for state-owned power distribution companies (discoms) requires participating state governments to take over 50 per cent of their outstanding short-term liabilities as at end-March 2012 through issuance of special securities in favour of participating lenders in a phased manner over a timeframe of 2-5 years and redeem these from 2018-19 onwards in annual instalments over the next 10 years. As these special securities are likely to be significantly larger in size than the power bonds that will be extinguished by the fiscal year 2016-173, the overall repayment pressure could be further aggravated from 2018-19 for the states participating in FRPs. 5. Loans from the Centre 5.14 The share of loans from the centre in the total outstanding liabilities of the states has been progressively declining over the years, due to changes in accounting practices as well as changes in policies of the central government (Table V.3). Since 1999-2000, due to a change in the accounting system, loans, which were hitherto given by the centre to states against small savings collections, are being shown as NSSF’s investments in special state government securities. Based on the recommendation of the Twelfth Finance Commission, the centre does not extend any loans for state plans from 2005- 06. However, as states are not allowed to borrow directly from international institutions and other multilateral agencies, the centre continues to intermediate with respect to external loans, which are being passed on to the non-special category state governments on a back-to-back basis. Thus, the centre facilitates access to this source of finance which is usually meant for projects aimed at building infrastructure in the receiving states. 5.15 Central government assistance for externally aided projects varies across NSC states, with Andhra Pradesh, Tamil Nadu, Karnataka, Bihar, and Madhya Pradesh having a substantial share. These five states together account for more than 60 per cent of the total outstanding liabilities under external assistance. The maturity profile of outstanding central government assistance for externally aided projects shows that these loans are predominantly long-term, with less than one-third maturing within the next 10 years (Table V.8). While this augurs well for the states’ fiscal positions because a large share will not be payable in the immediate future, the flip side is that they will be subjected to exchange rate volatility as these loans are denominated in foreign currencies. An adverse movement in the exchange rate could affect the finances of state governments in terms of higher repayments and interest payments in rupee terms. 6. Contingent Liabilities 5.16 While the revenue accounts of several state governments continue to record surpluses despite the overall moderation in economic growth this needs to be seen in the light of poor performance of state public sector enterprises including stateowned power distribution companies (discoms). States that have decided to participate in the scheme for financial restructuring of state discoms announced by the central government in October 2012 are required to provide guarantees to the bonds to be issued by discoms to participating lenders4. This will add to the contingent liabilities of state governments. 5.17 On behalf of the state governments, the Reserve Bank, maintains the guarantee redemption fund (GRF), which provides for the servicing of contingent liabilities arising from invocation of guarantees issued with respect to borrowings by state level undertakings or other bodies. As at end-March 2013, 11 states had subscribed to GRF, with the outstanding investments under the fund amounting to `44 billion. A Committee on the Guarantee Redemption Fund (GRF) that was constituted with a view to determining/reviewing the right size, contribution, withdrawal norms and other related issues of GRF, submitted its report in August 2013. Its highlights are given in Box V.1. 5.18 The Reserve Bank also maintains a consolidated sinking fund (CSF), on behalf of the state governments, to provide a cushion for amortisation of market borrowing/liabilities. Net incremental annual investments in CSF qualify for enhanced limits for special WMAs of state governments. The Working Group on Investment Avenues for the Consolidated Sinking Fund, which submitted its report in October 2012, recommended the building of a minimum CSF corpus of 3-5 per cent of state government liabilities within the next five years and thereafter maintaining it on a rolling basis. During 2012-13, two state governments withdrew their accrued interest portions of the fund to repay some of their high cost liabilities. As on March 31, 2013, as many as 21 state governments had subscribed to CSF and the outstanding amount under the fund stood at `485 billion. Box V.1 Committee on the Guarantee Redemption Fund Consequent to the discussions held in the State Finance Secretaries (SFSs) Conference held in May 2013, a Committee on the Guarantee Redemption Fund (GRF) was constituted to determine/review the right size, contribution, withdrawal norms and other related issues of GRF . Its report was submitted in August 2013. The major highlights of the report are: • GRF’s objective is providing a cushion for servicing the contingent liabilities arising from the invocation of guarantees issued by the states with respect to bonds and other borrowings by state level undertakings or other bodies. • While guarantees do not form a part of the debt, as conventionally measured, these have, in the eventuality of default, the potential of exacerbating a sound fiscal system. The element of risk associated with such guarantees raises concerns regarding the optimal or sustainable level of such guarantees and their implications for the fiscal health of the state governments. • The Twelfth Finance Commission (FC-XII) recommended that the states set up GRFs while FC-XIII stated that contingent liabilities are to be reported fully and adequate provisioning should be made for such liabilities. • The Fiscal Responsibility and Budget Management Act (FRBM), 2003 and the Rules made thereunder, prescribed a limit of 0.5 per cent of GDP for guarantees to be given in any financial year beginning 2004-05. Subsequently, states have also taken initiatives to place ceilings (statutory or administrative) on guarantees. • In order to improve transparency levels on guarantee details, disclosure on guarantees issued, invoked, settled, etc. needs to be captured fully in budget documents in entirety. • It will be desirable to benchmark the initial contributions for the states to join the GRF scheme at a prescribed level of the outstanding guarantees, by contributing minimum of 1 per cent of outstanding guarantees, and thereafter a minimum of 0.5 per cent every year to achieve a minimum level of 3 per cent in the next five years. • The right size of the GRF may be a minimum of 3 per cent of the outstanding guarantees of the previous year and thereafter, the fund should be gradually increased to a desirable level of 5 per cent. If a state has concluded that some guarantees have been invoked or are likely to be invoked, additional funds (over and above 5 per cent) should be maintained in the GRF. • States may have the option to withdraw excess funds over 5 per cent of outstanding guarantees of the previous year. To begin with, states having excess funds over 5 per cent of their outstanding guarantees may be permitted to withdraw in the financial year 2013-14 and in convenient tranches. • States are encouraged to constitute GRF to maintain credibility. This will also send positive signals to lenders about the entity (for whom the guarantee has been issued), which can also lead to favourable pricing. • The committee was of view that it may be desirable for a state to constitute the GRF if its outstanding guarantees go beyond a prescribed benchmark level of 1 per cent of GSDP, to encourage more financial discipline among states. • States may improve transparency levels by reporting guarantee details in budget documents. A state-wise fund size may be disseminated in RBI’s publications, to boost investors’ confidence. 7. Liquidity Position and Cash Management 5.19 Many state governments have been accumulating sizeable cash surpluses in recent years. Liquidity pressures during 2012-13 were, thus, confined to a few states. The ways and means advances (WMA) limit for states including the union territory of Puducherry, which remained unchanged since 2006-07, has been increased by 50 per cent to `153.60 billion with effect from November 11, 2013. During 2012-13, eight states availed of normal WMAs, of which six were in overdraft. The rates of interest on normal and special WMAs and ODs continued to be linked to the repo rate. Although the monthly average utilisation of WMAs and ODs by all the states during the first quarter of 2012-13 was lower than the corresponding quarter of the previous year, it was significantly higher during the remaining months of the year, barring August 2012 and January 2013. During 2013-14, WMAs and ODs were higher in May, June and August 2013 than the comparable months of the previous year (Chart V.2). 8. Investment of Cash Balances 5.20 The surplus cash balances of state governments are automatically invested in 14-day intermediate treasury bills (ITBs), the discount rate of which is presently fixed at 5 per cent. The average investment in 14-day ITBs increased from `722 billion as at end-March 2012 to `849 billion as at end-March 2013. The outstanding investments in ITBs stood at `1,181 billion as at end-March 2013 as against `966 billion as at end-March 2012. The weekly average investment of the state governments in auction treasury bills (ATBs) increased to `441 billion in 2012-13 from `277 billion in the previous year. Outstanding investments in ATBs as at end-March 2013 stood at `286 billion, which were higher than `220 billion as at end-March 2012, reflecting the increased preference for this instrument, which yields higher returns than ITBs. The monthly average overall investment in ITBs and ATBs by the states increased from `1,000 billion in 2011-12 to `1,289 billion in 2012-13. During 2013-14, (up to December 31, 2013) average monthly investments in ITBs and ATBs stood at `1,281.5 billion. With the exception of September, October and November 2013 the average monthly investments in ITBs and ATBs during 2013-14 so far, have been higher than those in the corresponding months of the previous year (Chart V.3). 9. Debt Consolidation and Relief Facility 5.21 The Debt Consolidation and Relief Facility (DCRF) had provided considerable relief to the states in terms of debt write-off and interest relief on outstanding high-cost central government loans. All states that enacted their FRBM Act have benefitted from DCRF. Currently, the scheme is in operation in West Bengal and Sikkim, which enacted their FRBM Acts only in 2010-11. Average interest rate on outstanding liabilities of state governments which has been steadily declining since 2004-05, increased in 2012-13(RE) and is budgeted to further increase in 2013-14 as a result of the tapering off of the DCRF effect and the increasing yields on state government securities due to the increasing size of market borrowings (Table V.9). 10. Conclusion 5.22 The consolidated debt-GDP ratio of the states declined during 2012-13 (RE), reflecting the impact of a faster increase in nominal GDP relative to overall debt. The weighted average yield of state government securities issued during 2012-13 was also higher due to tight liquidity and increase in borrowings. States continued to accumulate surplus cash balances, while some states took increased recourse to WMAs and overdrafts during 2012-13. In 2013-14, so far, states’ investment in ITBs and ATBs have, in general, been higher and recourse to WMAs and ODs, lower than a year ago. 1 Refers to the outstanding liabilities of the state governments. 2 Refers to the difference between the weighted average primary market yield of SDL on the day of auction and the secondary market yield of corresponding maturity of Government of India dated security on the same day. 3 To clear outstanding overdues of state electricity boards to the central public sector undertakings (CPSUs), power bonds, aggregating ` 336 billion, were issued by the state governments with retrospective effect from October 1, 2001 in 20 equal parts to facilitate trading and redemption of the bonds; each part carried a fixed tenor with bullet redemption, the last being on April 1, 2016. 4 Also refer to Chapter II for implications of the scheme on state finances. |
||||||||||||||||||||||||||||||||||||||||||||||||||||||||||||||||||||||||||||||||||||||||||||||||||||||||||||||||||||||||||||||||||||||||||||||||||||||||||||||||||||||||||||||||||||||||||||||||||||||||||||||||||||||||||||||||||||||||||||||||||||||||||||||||||||||||||||||||||||||||||||||||||||||||||||||||||||||||||||||||||||||||||||||||||||||||||||||||||||||||||||||||||||||||||||||||||||||||||||||||||||||||||||||||||||||||||||||||||||||||||||||||||||||||||||||||||||||||||||||||||||||||||||||||||||||||||||||||||||||||||||||||||||||||||||||||||||||||||||||||||||||||||||||||||||||||||||||||||||||||||||||||||||||||||||||||||||||||||||||||||||||||||||||||||||||||||||||||||||||

ಈ ಪುಟವನ್ನು ಹಂಚಿಕೊಳ್ಳಿ:


ಭಾರತೀಯ ರಿಸರ್ವ್ ಬ್ಯಾಂಕ್ ಮೊಬೈಲ್ ಅಪ್ಲಿಕೇಶನ್ ಅನ್ನು ಇನ್ಸ್ಟಾಲ್ ಮಾಡಿ ಮತ್ತು ಇತ್ತೀಚಿನ ಸುದ್ದಿಗಳಿಗೆ ತ್ವರಿತ ಅಕ್ಸೆಸ್ ಪಡೆಯಿರಿ!
ನಮ್ಮ ಅಪ್ಲಿಕೇಶನ್ ಅನ್ನು ಸ್ಥಾಪಿಸಲು QR ಕೋಡ್ ಅನ್ನು ಸ್ಕ್ಯಾನ್ ಮಾಡಿ


ಪೇಜ್ ಕೊನೆಯದಾಗಿ ಅಪ್ಡೇಟ್ ಆದ ದಿನಾಂಕ:


