 IST,
IST,


VII External Sector (Part 2 of 2)
Foreign Exchange Reserves - Approach, Developments and Issues
Concluding Observations
7.45 It has been noted that developing countries typically run CAD in their early stages of development to supplement their domestic saving to achieve higher level of investment and growth. This process enables recipient countries to achieve higher growth without cutting their current consumption; at the same time, higher productivity of capital in developing countries benefits foreign lenders by earning higher returns on their capital. This raises the question of an optimal CAD level for a country which, however, needs to be circumscribed by a sustainable level of capital flows. The external payments problems faced by India in 1991 and the East Asian crisis in 1997 have highlighted, inter alia, the role of large current account deficits and the consequent build-up of external debt, in precipitating the crisis (Rangarajan, 1993; RBI, 1999 and 2002a).
7.46 The current account sustainability depends upon external as well as domestic macroeconomic factors (Ghosh and Ostry, 1994; Milesi-Ferretti, Gian and Razin, 1997). Accordingly, a sustainable level of CAD would have elements of time and country specificity. Ultimately it is determined by the foreign investors’ confidence in the domestic economy, depending upon the various external and domestic factors identified above. While a ratio of CAD-GDP of 8 per cent or so turned out to be unsustainable in the case of Thailand, the same ratio continues to remain sustainable in the case of New Zealand. This level of deficit need not be a cause for alarm as long as transparent and consistent policies remain (Brash, 1998).
7.47 In the Indian context, as mentioned before, it was recommended that the CAD be contained at 1.6 per cent of GDP, given the level of normal capital flows. The Report of the Committee on Capital Account Convertibility, 1997 (Chairman: S.S. Tarapore) felt that a sustainable CAD-GDP ratio cannot be static for all times. It, therefore, recommended that the CAD-GDP ratio could be varied in line with the servicing capacity of the economy proxied by trends in current receipts/ GDP ratio. The actual outcome of CAD-GDP ratio averaging just over 1 per cent in the 1990s so far could be reflective of the limited absorptive capacity and infrastructural and other bottlenecks in the economy that hamper higher levels of investment (RBI, 1999).
7.48 In recent years, the current account deficits have been progressively narrowing and now turning into a modest surplus in 2001-02 and first two quarters of 2002-03, which reflects the underlying conditions of weakening aggregate demand. The target growth path in the Tenth Five Year Plan would presage a greater recourse to higher imports and enlarged capital flows. At the same time, there remains considerable degree of concern regarding the sustainable level of the current account deficit for an economy of India’s size and diversity. Clearly, exports hold the key to achieving a sustainable balance between the requirements of higher growth and the imperative of ensuring viability in the external sector. The projections of import growth underlying the growth rate of 8 per cent for the Tenth Plan have to be modulated and conditioned by the achievement of export targets along the course charted by the Medium-Term Export Strategy, 2002-07 (RBI, 2002b).
7.49 Against this background, financing of an average current account deficit of about 2.8 per cent of GDP as projected in the Tenth Five Year Plan may require a two-fold increase in the size of annual capital flows from the current levels. From a policy perspective, international investor confidence is critical to mobilise capital flows of this order. For this purpose, accumulation of reserves at a high level is an important pre-requisite.
7.50 In sum, during the decade of 1990s, the reform measures coupled with sound macroeconomic management succeeded in reducing the current account deficit well within the sustainable level for India. Given the sluggish export performance, the moderate current account deficit experienced in the recent years, including the condition of modest surplus recorded in 2001-02 can be largely attributed to sustained buoyancy in invisibles receipts. This reflects sharp rise in software service exports and subdued non-oil import demand, which in turn is symptomatic of a slowdown in industrial growth. There is, thus, a need for concerted policy efforts to raise the CAD-GDP ratio in line with the Tenth Plan projections so that higher growth is feasible over the medium term.
III. CAPITAL ACCOUNT, EXTERNAL DEBT AND EXCHANGE RATE: APPROACH, DEVELOPMENTS AND ISSUES
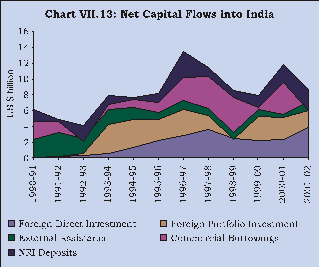
7.51 Reflecting the inward oriented economic policies in pursuit of self-reliance through export bias and import substitution, the role of the capital account during the 1980s was basically that of financing the current account deficits (RBI, 1999). The widening of the current account deficit during the 1980s coupled with the drying up of traditional source of official concessional flows necessitated a recourse to additional sources of financing in the form of debt creating commercial borrowings, non-resident deposits and exceptional financing in the form of IMF loans. 7.52 The external payment crisis of 1991 brought to the fore the weaknesses of the debt-dominated capital account financing. Recognising this, structural reforms and external financial liberalisation measures were introduced during the 1990s. The policy shift underscored the need for gradually liberalising capital account recognising that this is a process rather than a single event (Jalan, 1999). Throughout the 1990s the role assigned to foreign capital in India has been guided by the consideration of financing a level of current account deficit that is sustainable and consistent with absorptive capacities of the economy (Rangarajan, 1993; Tarapore, 1995; Reddy, 2000). In India, the move towards full capital account liberalisation has been approached with extreme caution. Taking lessons from the international experience, the Committee on Capital Account Convertibility, 1997 (Chairman: S. S. Tarapore) suggested a number of pre-conditions, attainment of which was considered necessary for the success of the capital account liberalisation programme in India (Box VII.5). The need for supplementing debt capital with non-debt capital with a clear prioritisation in favour of the latter has characterised the policy framework for capital inflows in the 1990s. The High Level Committee on BoP had recommended the need for achieving this compositional shift. Keeping in line with the policy thrust, capital flows have undergone a major compositional change in the 1990s in favour of non-debt flows (Chart VII.13).
Box VII.5 With the growing role of private capital flows and the possibility of occasional sharp reversals, the issue of capital account liberalisation and convertibility has spurred extensive debate since 1992 - the period which witnessed a series of currency crises; in Europe (1992-93), Mexico (1994-95), East Asia (1997-98), Russia (1998), Brazil (1999), Turkey (2000) and Argentina (2001-02). These crises have raised the question of desirability of liberalisation and whether it is advisable to vest the IMF with the responsibility for promoting the orderly liberalisation of capital flows. The IMF in its study (1998) stated that 'as liberalised systems afford opportunities for individuals, enterprises and financial institutions to undertake greater and sometimes imprudent risks, they create the potential for systematic disturbances. There is no way to completely suppress these dangers other than through draconian financial repression, which is more damaging.' The view of IMF itself has changed over time (RBI, 2001). While opening up of the capital account may be conducive to economic growth as it could make available larger stocks of capital at a lower cost for a capital-deficient country, the actual performance of the economy, however, typically depends on a host of other factors. For a successful liberalised capital account, emerging market countries could: (i) pursue sound macroeconomic policies; (ii) strengthen the domestic financial system; (iii) phase capital account liberalisation appropriately and (iv) provide information to the market. At the international level, there is also the role of surveillance to consider, including the provision of information and the potential need for financing (Fischer, 1997). In India, the move towards full capital account liberalisation has been approached with extreme caution. The Report of the Committee on Capital Account Convertibility, 1997 (Chairman: S.S.Tarapore) taking into account lessons from international experience suggested a number of signposts, the attainment of which are a necessary concomitant in the move towards capital account convertibility. Fiscal consolidation, lower inflation and a stronger financial system were seen as crucial signposts for India (Table 7.12).
| ||||||||||||||||||||||||||||||||||||||||||||||||||||||||||||||||||||||||||||
7.53 India followed a gradualist approach to liberalisation of its capital account. India did not experience reversal of its policies towards the capital account as was the case with some emerging market economies that had followed a relatively rapid liberalisation without entrenching the necessary preconditions (Box VII.6). This is particularly important since cross-country studies do not provide clear evidence of increase in capital flows resulting from capital account openness across all developing countries, with only 14 developing countries accounting for about 95 per cent of net private flows to developing countries in the 1990s. Besides, empirical evidence on the positive effects of financial capital flows on economic growth is not yet conclusive (Edison et al, 2002).
Foreign Investment
7.54 During the first three decades after independence, foreign investment in India was highly regulated. In the 1980s, there was some easing in foreign investment policy in line with the industrial policy regime of the time. The major policy thrust towards attracting foreign direct investment (FDI) was outlined in the New Industrial Policy Statement of 1991. Since then, continuous efforts have been made to liberalise and simplify the norms and procedures pertaining to FDI. At present, FDI is permitted under automatic route subject to specific guidelines except for a small negative list. In the recent period, a number of measures have been taken to further promote FDI. These include: raising the foreign ownership cap to 100 per cent in most of the sectors, ending state monopoly in insurance and telecommunications, opening up of banking and manufacturing to competition and disinvestment of state ownership in Public Sector Undertakings (PSUs). Though the FDI companies have generally performed better than the domestic companies, FDI to India has been attracted mainly by the lure of the large market (RBI, 2002b).
Box VII.6 A number of Southern Cone countries in Latin America undertook rapid liberalisation of their capital account in the late 1970s in conjunction with a pre-announced or fixed exchange rate. Asian countries, such as Malaysia, Indonesia and Singapore also liberalised their capital account against the background of strong balance of payments positions (Rangarajan and Prasad, 1999 and 2001). Many countries prematurely opened their capital account. There was a reversal in the process of liberalisation among many developing countries in the early 1980s. Pre-existing weaknesses in the banking system led to the emergence of serious banking problems which in turn led to the reimposition of controls in Southern Cone countries and debt crisis in Latin America. Restrictions in the capital account were relaxed in the Latin American countries towards the end of 1980s with the resolution of the debt crisis under the Brady Plan and significant reorientation of macroeconomic and structural policies leading to the restoration of international investor confidence. The process of capital account opening in developing countries accelerated in the 1990s, especially with emerging market economies substantially liberalising their capital controls in Asia, Latin America (Argentina, Venezuela) and transition economies (Czech Republic, Hungary, Estonia, Poland). Among these countries, Argentina had to reimpose controls in its capital account in December 2001 in the wake of an unprecedented sovereign debt crisis. In the aftermath of the Asian crisis of 1997, the international perception on liberalisation of capital controls and the national policy thinking on the relative benefits of an open capital account vis-à-vis the associated costs have changed considerably. The policy debate now centres around the contours of an orderly liberalisation framework and countries like Malaysia have even reverted to capital controls as the key instrument of crisis management. Reversal to the process of capital account liberalisation can be prevented if reforms are appropriately sequenced. Appropriate sequencing of capital flows depends, inter-alia, on the initial conditions. It is generally agreed that capital account liberalisation should be preceded by macroeconomic stabilisation. Countries which complete the process of macroeconomic stabilisation first, can remove exchange controls on current account transactions to begin with, to be followed by capital account openness as the benefits of domestic reforms on growth and financial stability become visible and appear durable (Arteta, Eichengreen and Wyplosz, 2001). In general, liberalisation of the capital account should follow the current account since the former may involve a real appreciation of the exchange rate whereas the latter may require a real depreciation to offset the adverse impact of the dismantling of tariff and non-tariff protection on the balance of payments. Since goods market takes a longer time to clear than financial asset markets, the current account needs to be liberalised first. This is also borne out by the successful experience of Chile as opposed to that of Argentina. Reform of domestic financial markets before capital account liberalisation is generally considered critical, since domestic financial institutions can then be better equipped to face international competition and to intermediate movement of funds efficiently without exposing the system to avoidable risks. |
7.55 Responding to the policy efforts, foreign investment inflows to India (direct and portfolio investments taken together) picked up sharply in 1993-94 and have been sustained at a higher level with an aberration in 1998-99, when global capital flows were affected by contagion from the East Asian crisis. Total foreign investment has averaged at US $ 5.4 billion during the three year period 1999-2000 to 2001-02 as against negligible levels of the 1980s. However, this level of flows matches the average recorded in the earlier three-year period 1994-95 to 1996-97. FDI, which was US $ 0.6 billion in 1993-94 increased sharply over the years to US $ 3.9 billion in 2001-02. Foreign portfolio investment (FPI) on the other hand, has shown larger year-to-year variations, moving in the range of a net inflow of US $ 3.8 billion in 1994-95 to a net outflow of US $ 61 million in 1998-99 (Chart VII.14).
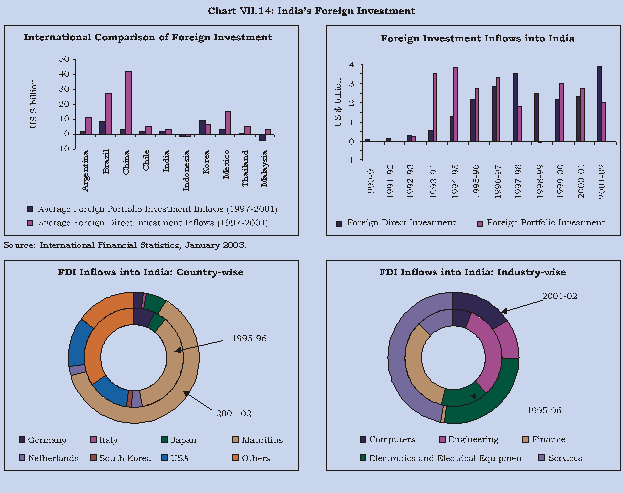
7.56 An industry-wise breakup reveals that the direction of FDI inflows has undergone a structural change over the reform period in line with the policy efforts. During the year 2001-02, computers, electronics and electrical equipments accounted for 34 per cent while services accounted for around 38 per cent of total FDI (excluding NRI investment). A country-wise breakup of FDI inflows reflects the increasing importance of Mauritius as the source of FDI in India during the recent years. This pattern highlights, in a sense, the role of tax policies in influencing the pattern of FDI flows at the global level.
7.57 Although India took significant steps towards inviting FDI in pursuance of its policy of emphasising non-debt creating capital inflows during the reform period, the actual FDI inflows did not pick up on the expected lines. FDI inflows in India remained low in comparison to other emerging market economies. An international comparison of annual average FDI and FPI inflows for the period 1997-2001 shows that such inflows to India were lower than those to emerging market economies like Argentina, Brazil, China, Korea, Mexico, Thailand and Malaysia. India’s failure to attract enhanced inflows of FDI strongly underlines the need for further reforms in this context (Bhagwati, 2001). Given the projected need for financing infrastructure projects, on a rough and ready estimate, about 15 per cent of the total infrastructure financing may have to come from foreign sources. Since the ratio of infrastructure investment to GDP is projected to increase from 5.5 per cent in 1995-96 to about 8 per cent by 2006, with a foreign financing of about 15 per cent, foreign capital of about 1.2 per cent of GDP has to be earmarked only for the infrastructure sector to achieve the GDP growth rate of about 8 per cent (RBI, 2001b).
7.58 While inward FDI has been actively pursued, the policy framework has also been substantially liberalised in regard to direct investment from India to other countries during the 1990s. Overseas investment in Joint Ventures (JVs) or Wholly Owned Subsidiaries (WOS) have been recognised as important instruments for promoting global business by Indian entrepreneurs. Continuing with the direction of liberalisation of the capital account, companies have been allowed to invest abroad in JVs or WOS with limits which have been relaxed from time to time. At present, the complete use of American Depository Receipts (ADR)/ Global Depository Receipts (GDR) proceeds and the EEFC account balance for this purpose is also permitted. Taking advantage of the policy, the Indian investment abroad has increased from very meagre amounts in early 1990s to US $ 190 million in 1995-96 and further to US $ 639 million in 2001-02. The current levels, however, do not reflect the full potential of the Indian business and its improved competitiveness after a decade of wide-ranging reforms.
7.59 Like FDI, the environment for FPI was also made more congenial through procedural changes for investment and by offering more facilities for investment in equity securities as well as in debt securities to a select category of portfolio investors, viz., the Foreign Institutional Investors (FIIs). Furthermore, the sectoral limits for FIIs in the Indian companies were progressively increased over time; these limits have been done away with altogether, except in select specified sectors. The NRIs, Overseas Corporate Bodies (OCBs) and Persons of Indian Origin (PIOs) are also permitted to invest in shares and debentures of Indian companies, government securities, commercial papers, company deposits and mutual funds floated by public sector banks and financial institutions.
NRI Deposits
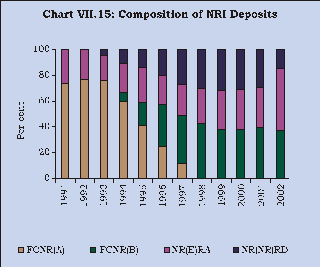
7.60 NRI deposits in the form of Non-Resident (External) Rupee Account (NR(E)RA) and Foreign Currency Non-Resident Account (FCNR(A)) emerged as a steady flow of foreign capital in India from the 1970s, following the labour migration boom in West Asia in the wake of the first oil shock. The onset of the 1990s saw the introduction of as many as five NRI deposit schemes [Foreign Currency Bank and Ordinary (FC(B&O)), Foreign Currency Ordinary NonResident (FC(ON)), Non-Resident Non-Repatriable Rupee Deposit (NR(NR)RD), Non-Resident Special Rupee Account (NR(S)RA) and Foreign Currency NonResident Bank (FCNR(B))] between 1990 and 1993 designed to attract foreign exchange in the face of external payments crisis of 1991. With the recovery of the external sector, taking into account the lessons of the experience of various NRI deposit schemes during the 1980s and their contribution in aggravating the payments imbalance of 1990-91, the policies with regard to NRI deposits during the 1990s have been aimed at attracting stable deposits. This has been achieved through: (i) a policy induced shift in favour of local currency denominated deposits; (ii) rationalisation of interest rates on rupee denominated NRI deposits; (iii) linking of the interest rates to LIBOR for foreign currency denominated deposits; (iv) de-emphasising short-term deposits (up to 12 months) in case of foreign currency denominated deposits; and (v) withdrawal of exchange rate guarantees on various deposits. The Reserve Bank has also made an active use of reserve requirements on these deposits as an instrument to influence monetary and exchange rate management and to regulate the size of the inflows depending on the country’s requirements. Continuing with the policy of progressive liberalisation of capital account, the NR(NR)RD scheme was discontinued with effect from April 1, 2002 and the maturity proceeds of NR(NR)RD can be credited to the account holder’s NRE account only on maturity.
7.61 In line with the above policy perspective, the 1990s witnessed the discontinuation of all foreign currency denominated schemes, where exchange guarantee was provided by the Reserve Bank. In order to minimise the short-term debt burden of the country, the minimum maturity for FCNR(B) deposits has been raised from six months to one year. In view of the Government’s policy of deregulating the interest rates, the banks are free to determine the interest rates on rupee denominated NRI deposits. The interest rate on foreign currency denominated FCNR(B) deposits has been linked to LIBOR in order to reduce the arbitrage possibilities.
7.62 An analysis of the movement in NRI deposits reveals that outstanding NRI deposits grew steadily from US $ 13.7 billion at end-March 1991 to US $ 25.2 billion at end-March 2002. Deposits under the FCNR(B) scheme increased from US $ 1.1 billion at end-March 1994 to US $ 9.7 billion at end-March 2002. In case of NR(E)RA scheme, the deposits increased from US $ 3.6 billion as at end-March 1991 to US $ 8.4 billion as at end-March 2002. On the other hand, for the non-repatriable rupee denominated NR(NR)RD scheme, the outstanding balances increased from US $ 621 million in 1993 to US $ 7.1 billion at end-March 2002.
7.63 The NRI deposits have emerged as a major source of capital inflows during the 1990s. Apart from the size, the success of the policy towards NRI deposits is also reflected in an increase in the proportion of local currency denominated deposits (from around one-fourth in 1991 to almost two-third by 2002) and a substantial decline in short-term NRI deposits (Chart VII.15).
External Commercial Borrowings
7.64 Commercial debt capital includes a whole range of sources of foreign capital where the overriding consideration is commercial. External commercial loans include bank loans, buyers’ credit, suppliers’ credit, securitised instruments such as Floating Rate Notes and Fixed Rate Bonds, commercial borrowings and the private sector window of multilateral financial institutions.
7.65 The policies towards External Commercial Borrowings (ECBs) since the reform programme have been guided by the overall consideration of prudent external debt management by keeping the maturities long and cost low. ECBs are approved within an overall annual ceiling. Over time, the policy has been guided by a priority for projects in the infrastructure and core sectors such as power, oil exploration, telecom, railways, roads and bridges, ports, industrial parks, urban infrastructure and for 100 per cent Export Oriented Units (EOUs). To allow further flexibility to borrowers, end-use and maturity prescriptions have been substantially liberalised. Moreover, corporates have been allowed to borrow upto a certain limit under the ‘automatic route’. Apart from these, special bonds (India Development Bonds (IDBs), Resurgent India Bonds (RIBs) and India Millennium Deposits (IMDs)) were issued by the State Bank of India aimed at NRIs. The success in mobilising foreign exchange resources through such exceptional schemes reflected the confidence of the global investor community in the Indian economy and imparted an element of stability to the external sector and the overall balance of payments position.
7.66 At times, the rationale behind raising such high cost debt capital has been questioned. Experience, however, would suggest that each time this option was resorted to, it helped in strengthening the confidence in the Rupee and the ability of the country to honour its obligations. The costs of an exchange rate crisis are too severe in relation to cost of debt capital. In a situation of moderate debt-service ratio, such debt capital makes more sense than allowing the exchange rate to fall under pressure. As in the event of payments crisis such as that in 1991, servicing of short-term debt can become difficult, the policies in the 1990s have regulated build-up of short-term debt by allowing short-term credits only for trade-related purposes. Until recently, suppliers’ credits of more than 180 days and buyers’ credit of all maturities required prior approval from the Reserve Bank. Effective September 2002, with a view to simplify and liberalise the exchange control procedures, the prior approval of the Reserve Bank has been dispensed with for amounts not exceeding US $ 20 million per import transaction. 7.67 Over the same period, official aid has waned in importance. This reflected mainly growing amortisation payments in the face of sluggish disbursements of external assistance as also availability of alternative private capital flows. Unlike aid, the share of ECBs in total capital flows have increased from around 31 per cent in 1990-91 to around 40 per cent in 1997-98. This has been mainly on account of the higher appetite for ECBs in view of the strong import demand and industrial growth. Subsequently, the increase in ECBs was entirely on account of RIBs and IMDs in 1998-99 and 2000-01, respectively, as the demand for ECBs remained low on account of weak investment demand.
7.68 The impact of the continuum of reforms initiated in the aftermath of the balance of payments crisis of 1991 on India’s current account and capital account resulted in an accumulation of foreign exchange reserves of over US $ 70 billion as at end-February 2003. Capital account surplus increased from US $ 3.9 billion during the 1980s to US $ 8.6 billion during 1992-2002 with a steadily rising foreign investment. As a proportion of GDP, capital flows increased from 1.6 per cent during 1980s to 2.3 per cent during 1992-2002. The significant increase in capital flows during the 1990s raises the issue of their determinants as well as their impact on growth. Granger-causality tests indicate a unidirectional causation from net capital flows in the Indian context to growth in GDP over the 1970-2000 period. On the other hand, a componentwise analysis suggests that non-debt creating flows seem to Granger cause GDP growth. Capital flows, both debt and non-debt, have also been found to crowd-in investment. Non-debt creating flows are discouraged by a higher fiscal deficit and exchange rate depreciation while greater openness and higher reserves have a positive effect on such flows (RBI, 2002b).
7.69 The sustained increase in capital inflows as discussed above, coupled with the moderate current account deficit, resulted in a surplus from 1993-94 onwards (excepting 1995-96) in the overall balance of payments (Table 7.13). The surplus amounted to US $ 11.8 billion in 2001-02 as against a deficit of US $ 0.6 billion in 1992-93 (Chart VII.16).
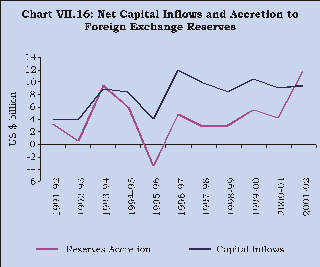
Table 7.13: Balance of Payments - Key Indicators | |||||||||
(Per cent) | |||||||||
Item | 1990-91 | 1995-96 | 1999-00 | 2000-01 | 2001-02 | ||||
1 | 2 | 3 | 4 | 5 | |||||
1. Trade | |||||||||
i) | Exports/GDP | 5.8 | 9.1 | 8.4 | 9.8 | 9.3 | |||
ii) | Imports/GDP | 8.8 | 12.3 | 12.4 | 12.9 | 12.0 | |||
iii) | Trade Balance/GDP | -3.0 | -3.2 | -4.0 | -3.1 | -2.7 | |||
2. Invisibles Account | |||||||||
i) | Invisible Receipts/GDP | 2.4 | 5.0 | 6.8 | 7.5 | 7.4 | |||
ii) | Invisible Payments/GDP 2.4 | 3.5 | 3.8 | 4.9 | 4.5 | ||||
iii) | Invisibles (Net)/GDP | -0.1 | 1.6 | 3.0 | 2.6 | 2.9 | |||
3. Current Account | |||||||||
i) | Current Receipts@/ | ||||||||
GDP | 8.0 | 14.0 | 15.1 | 17.2 | 16.7 | ||||
ii) | Current Receipts | ||||||||
Growth@ | 6.6 | 18.2 | 12.9 | 17.1 | 1.4 | ||||
iii) | Current Receipts@/ | ||||||||
Current Payments | 71.5 | 88.8 | 93.0 | 96.4 | 101.2 | ||||
iv) | CAD/GDP | -3.1 | -1.7 | -1.0 | -0.5 | 0.3 | |||
4. Capital Account | |||||||||
i) | Foreign Investment / | ||||||||
GDP | - | 1.4 | 1.2 | 1.1 | 1.2 | ||||
ii) | Foreign Investment / | ||||||||
Exports | 0.6 | 14.9 | 13.8 | 11.4 | 13.2 | ||||
5. Others | |||||||||
i) | Debt-GDP Ratio | 28.7 | 27.0 | 22.2 | 22.3 | 20.8 | |||
ii) | Debt Service Ratio | 35.3 | 24.3 | 16.2 | 17.3 | 14.1 | |||
iii) | Liability Service Ratio | 35.6 | 24.7 | 17.0 | 18.3 | 15.3 | |||
iv) | Import Cover of | ||||||||
Reserves (in months) | 2.5 | 6.0 | 8.2 | 8.6 | 11.3 | ||||
@ Excluding official transfers. | - | Negligible. | |||||||
7.70 The evolution of capital flows over the 1990s reveals a shift in emphasis from debt to non-debt flows with the declining importance of external assistance and ECBs and the increased share of foreign investment - both direct and portfolio. Apart from financing the current account gap, capital flows have played a significant role in India’s growth performance. Evidence of strong complementarity with domestic investment suggests that capital flows brighten the overall investment climate and stimulate domestic investment even when a part of the capital flows actually gets absorbed in the form of accretion to reserves. The growth-augmenting role of foreign capital, particularly FDI, however, seems to have been constrained by the low levels of actual and planned absorption of foreign capital in India (RBI, 2001). The key indicators of balance of payments as explained in Table 7.13 show considerable improvement in India’s balance of payments since 1991.
External Debt Management
7.71 Efforts towards prudent management of external debt, keeping in view sustainability, solvency and liquidity were put in place in most of the countries in response to the Latin American debt crisis of 1982. Subsequently, the financial crisis of Mexico in 1994-95 and Indonesia, Korea, Malaysia, Thailand and other Asian countries in 1997 highlighted the need for a sound macroeconomic policy for managing short term private capital flows, particularly the debt creating ones. The East Asian crisis emphasised the need for monitoring: (i) both public and private debt; (ii) the size as well as the composition and maturity structure of external debt; (iii) inter company debt between direct investors and subsidiaries, branches and associates; (iv) trade credits, buyers and suppliers credits; (v) money market instruments; (vi) loans from foreign financial institutions for normal inter bank transactions and other commercial purposes; and (vii) foreign currency denominated deposits held by non-residents (Kappagoda, 1999). The East Asian crisis not only highlighted the need for monitoring the short-term debt, but it also emphasised the need for compilation of external debt (both long-term and short-term) on residual maturity basis, rather than original maturity basis. The former gives a better picture of the scheduled foreign exchange drain in the coming years on account of amortisation payments. In addition, the need for greater transparency and accountability, particularly in information disclosed by the private sector, has also been recognised as essential for avoidance of payments crisis (Kumar, 1999; Das, 1999; Williamson, 1999; Mohanty et al, 1999; Patra et al, 1999).
7.72 Apart from the need to contain current account deficit to sustainable level, one of the lessons from the external payment crisis of 1991, was to avoid excessive reliance on commercial debt especially of short-term maturity to finance the current account deficit. The approach to the external debt management was broadly based on the recommendations of the Rangarajan Committee, 1993. Following these recommendations, the strategy for external debt management during the 1990s has been guided by: (i) the continuation of an annual cap, minimum maturity restrictions and prioritising the use of ECBs; (ii) LIBOR based ceilings on interest rates and minimum maturity requirements on foreign currency denominated NRI deposits to discourage the volatile component of such deposits; (iii) reduction of short-term debt together with controls to prevent its undue increase in future; (iv) retiring/ restructuring/ refinancing of more expensive external debt; (v) measures to encourage non-debt creating financial flows such as FDI and FPI; (vi) incentives and schemes to promote exports and other current receipts; and (vii) conscious build-up of foreign exchange reserves to provide effective insurance against external sector uncertainties.
7.73 Key indicators of debt sustainability point to the continuing consolidation and improved solvency in the 1990s. Although, in nominal terms, India’s total outstanding external debt increased from US $ 83.8 billion at end-March 1991 to US $ 98.5 billion at end-March 2002, external debt to GDP ratio declined sharply from 28.7 per cent at end-March 1991 to 20.9 per cent at end-March 2002 (Charts VII.17 and VII.18). Prudent external debt management is also reflected in the proportion of short-term debt to total debt declining from 10.2 per cent in 1991 to 2.8 per cent in 2002 and in the ratio of short-term debt to foreign exchange reserves from a high of 146.5 per cent in the crisis period of 1991 to only 5.1 per cent in 2001-02. Debt service ratio declined from 35.3 per cent in 1990-91 to 14.1 per cent in 2001-02 (Table 7.14). Interest payments to current receipts ratio declined from 15.5 per cent in 1990-91 to 5.4 per cent in 2001-02.
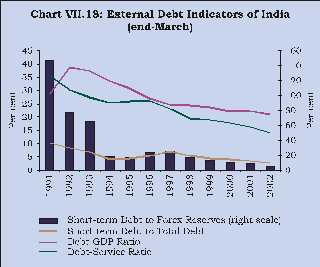
Table 7.14: Major Indicators of External Debt (as at end-March) | ||||||
(Per cent) | ||||||
Items | 1991 | 1996 | 2000 | 2001 | 2002 | |
1 | 2 | 3 | 4 | 5 | ||
I. | Total Debt to GDP | 28.7 | 27.0 | 22.1 | 22.4 | 20.9 |
II. | Short-term Debt | 2.9 | 1.4 | 0.9 | 0.8 | 0.6 |
(original maturity) | ||||||
to GDP | ||||||
III. | Concessional Debt | 45.9 | 44.7 | 38.9 | 35.5 | 36.0 |
to Total Debt | ||||||
IV. | Short-term Debt | 146.5 | 23.2 | 10.3 | 8.6 | 5.1 |
(original maturity) | ||||||
to Foreign Exchange | ||||||
Reserves | ||||||
V. | Short-term Debt | 382.1 | 29.5 | 11.2 | 9.2 | 5.4 |
(original maturity) to | ||||||
Foreign Currency Assets | ||||||
VI. | Non-Debt Liabilities | 148.2 | 92.3 | 99.9 | 100.8 | 88.4 |
and Short-term Debt | ||||||
to Reserves | ||||||
VII. | Short-term Debt | 146.6 | 71.1 | 59.0 | 58.5 | 48.1 |
and Non-debt | ||||||
Reversible Liabilities | ||||||
to Reserves | ||||||
VIII. | Debt Service Ratio | 35.3 | 24.3 | 16.2 | 17.5 | 14.1 |
IX. | Debt to Current | 328.9 | 188.9 | 145.6 | 126.2 | 122.5 |
Receipts | ||||||
X. | Liability Service Ratio | 35.6 | 24.7 | 17.0 | 18.3 | 15.3 |
7.74 The decade of 1990s witnessed a steady move towards consolidation of India’s external debt statistics in terms of size, composition and indicators of solvency and liquidity. Containing the increase in the size of external debt to a modest level in the face of a tremendous growth in foreign exchange reserves during the decade definitely points towards the success of India’s debt management strategy. Reflecting this, in terms of indebtedness classification, the World Bank has categorised India as a less indebted country since 1999. Among the top 15 debtor countries of the world, India improved its rank from third debtor after Brazil and Mexico in 1991 to ninth in 2000 after Brazil, Russian Federation, Mexico, China, Argentina, Indonesia, Korean Republic and Turkey. Moreover, among them, key external debt indicators such as short-term debt to total debt and short-term debt to forex reserve ratios are the lowest for India; the concessional to total debt ratio is the highest, while debt to GNP ratio is the second lowest after China.
Exchange Rate Management
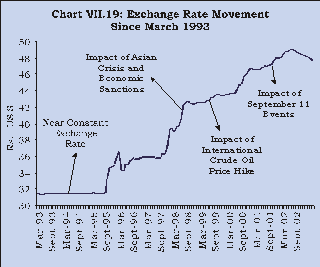
7.75 In the context of globalisation and currency crises, recent years, particularly, have seen a renewed interest on the issues relating to exchange rate regime, which is evident in the large and growing body of theoretical and empirical literature on the subject. Nevertheless, both in theory as well as in practice, the state of the debate is unsettled. A worldwide consensus is still evolving in search of an appropriate and credible exchange rate regime. Contemporaneously, in India also, discussion and debate on issues relating to the appropriate exchange rate system, policies on intervention, capital control and foreign exchange reserves figure very prominently. This is especially relevant with the introduction of a market-based exchange rate system in March 1993 and in the context of global currency crises, particularly the East Asian Crisis.
7.76 The task of determining appropriate exchange rate and market intervention policies is extremely difficult for central banks all over the world. In principle, and in theory, there is a strong case for either freely floating exchange rates (without intervention) or a currency board type arrangement of fixed rates (Edwards, 2000; Summers, 2000; Buiter 2000). In practice, however, because of the operational realities of foreign exchange markets, empirical research shows that most countries have adopted intermediate regimes of various types including crawling pegs, fixed rates within bands, managed floats with no pre-announced path, and independent floats with market intervention moderating the rate of change and preventing undue fluctuations (Williamson, 2000). By and large, most countries have some variety of 'managed' floats and central banks intervene in the markets periodically.
7.77 Reflecting the growing role of private capital flows in the 1990s, there has been a shift in the exchange rate regimes with a trend towards corners-either fixed regimes or floating regimes. For instance, about half of the IMF member countries as at end-December 2001 were at the corners. In contrast, the proportion of countries at the corners was only one-fourth as at end-December, 1991. As at end-December 2001, 41 countries had independent float exchange rate system, 42 countries had managed float with no pre-announced path for exchange rate, 40 countries had exchange arrangements with no separate legal tender, 40 countries had other conventional fixed pegged arrangements, eight countries had currency board arrangements, five countries had pegged exchange rates within horizontal bands, four countries had crawling pegs and six countries had exchange rates within crawling bands.
7.78 In India the exchange rate system has undergone a paradigm shift from a system of fixed exchange rate (until March 1992) to a market-determined regime in March 1993. Since the switchover to a market determined exchange rate regime in March 1993, the behaviour of the exchange rate has remained largely orderly, interspersed by occasional episodes of pressures, which were relieved through appropriate intervention operations consistent with the stated policy of avoiding undue volatility in the exchange rate without reference to any target, whether explicit or implicit. The financial crises encountered by the emerging markets in the last decade have brought to the fore the importance of an appropriate exchange rate policy. The present Indian regime of managed flexibility that focuses on managing volatility without reference to any target has gained increasing international acceptance and well served the requirements of the country in the face of significant liberalisation of external sector transactions. This is particularly so in the context of the series of exchange rate crises experienced by several emerging economies undertaking similar macroeconomic reforms.
7.79 In the post-Bretton Woods period, the Rupee was effectively pegged to a basket of currencies of India’s major trading partners from September 1975. This system continued through the 1980s, though the exchange rate was allowed to fluctuate in a wider margin and to depreciate modestly with a view to maintain competitiveness. However, the need for adjusting exchange rate became precipitous in the face of the external payments crisis of 1991.
7.80 As a part of the overall macroeconomic stabilisation programme, the exchange rate of the Rupee was devalued in two stages by 18 per cent in terms of the US dollar in July 1991. The transition to market determined exchange rate system took place in two stages and the sequencing was based on the Report of the High Level Committee on Balance of Payments, 1993 (Chairman: C. Rangarajan). The Liberalised Exchange Rate Management System (LERMS) instituted in March 1992 was a dual exchange rate arrangement under which 40 per cent of the current receipts were required to be surrendered to the Reserve Bank at the official exchange rate while the rest 60 per cent could be converted at the market rate. The 40 per cent portion surrendered at the official rate was for meeting the essential imports at a lower cost. Although the experience with the dual exchange rate system in terms of volatility in the market determined segment of the forex market was satisfactory, it involved an implicit tax on exports and other invisibles receipts and thereby emerged as a source of distortion. As a system in transition, the LERMS performed well in terms of creating the conditions for transferring an augmented volume of foreign exchange transactions on to the market.
7.81 The unified market determined exchange rate regime replaced the dual regime on March 1, 1993 and since then 'the objective of exchange rate management has been to ensure that the external value of the Rupee is realistic and credible as evidenced by a sustainable current account deficit and manageable foreign exchange situation. Subject to this predominant objective, the exchange rate policy is guided by the need to reduce excess volatility, prevent the emergence of destabilising speculative activities, help maintain adequate level of reserves, and develop an orderly foreign exchange market' (Jalan, 1999). In order to reduce the excess volatility in the foreign exchange market, the Reserve Bank has undertaken market clearing sale and purchase operations in the foreign exchange market to moderate the impact on exchange rate arising from lumpy demand and supply as well as leads and lags in merchant transactions. Such interventions, however, are not governed by any predetermined target or band around the exchange rate.
7.82 The experience with the market determined exchange rate regime has been satisfactory, although the exchange rate management had to occasionally contend with a few episodes of volatility. The period from March 1993 till August 1995 was a phase of significant stability. Capital inflows coupled with robust export growth exerted upward pressure on the exchange rate. However, the Reserve Bank absorbed the excess supplies of foreign exchange. In the process, the nominal exchange rate of the Rupee vis-à-vis the US Dollar remained virtually unchanged at around Rs.31.37 per US Dollar over the extended period from March 1993 to August 1995. The real appreciation that resulted from the positive inflation differentials prevailing during this period triggered off market expectations and resulted in a market led correction of the exchange rate of the Rupee during September 1995-February 1996. In response to the upheavals, the Reserve Bank intervened in the market and also resorted to monetary tightening so as to restore orderly conditions in the market after a phase of orderly correction for the perceived misalignment (RBI, 1996).
7.83 The period since 1997 has witnessed a number of adverse internal as well as external developments. The important internal developments include the economic sanctions imposed in the aftermath of nuclear tests conducted during May 1998 and the border conflict during May-June 1999. The external developments included, inter alia, the contagion from the Asian crisis, the Russian crisis during 1997-98, sharp increases in international crude oil prices in the period beginning with 1999, especially May 2000 onwards, and the post-September 11, 2001 developments in the US. These developments created a large degree of uncertainty in the foreign exchange market at various points of time, leading to excess demand conditions in the market (Chart VII.19). The Reserve Bank responded through appropriate intervention supported by monetary and other administrative measures like variations in the bank rate, repo rate, cash reserve requirements, refinance to banks, surcharge on import finance and minimum interest rates on overdue export bills. These measures helped in curbing destabilising speculation, while at the same time allowing an orderly correction in the value of the Rupee (Pattnaik, Kapur and Dhal, 2002).10
7.84 A related issue that has figured in the literature is whether the exchange rate should be managed by monitoring Nominal Effective Exchange Rate (NEER) or Real Effective Exchange Rate (REER). 'From a competitive point of view and also in the medium term perspective, it is the REER, which should be monitored as it reflects changes in the external value of a currency in relation to its trading partners in real terms. However, it is no good for monitoring short term and day-to-day movements as ‘nominal’ rates are the ones which are most sensitive of capital flows... Thus, in the short run, there is no option but to monitor the nominal rate' (Jalan, 2002).
7.85 Since the introduction of the market determined regime in March 1993, the Rupee has depreciated by 35 per cent upto February 2003 against the US dollar, i.e., from Rs.31.52 to Rs.48.73 per US dollar. In terms of effective exchange rates, the NEER depreciated by 31.1 per cent, while the REER (5 country trade based index) recorded a depreciation of 2.2 per cent during the period 1993-94 to 2002-03 (up to February 2003) (Table 7.15). A notable feature of the exchange rate in the recent years has been the two-way movement that has increased the risk profile of such market players who maintain open positions guided by the perception that the exchange rate can move only one way in India.
Table 7.15: Exchange Rate and the REER and NEER of the Indian Rupee | |||
Year | Rupees per | REER | NEER |
US Dollar | (5 country trade weights | ||
with 1993-94=100) | |||
1 | 2 | 3 | |
1990-91 | 17.94 | 141.69 | 175.04 |
1991-92 | 24.47 | 116.48 | 131.54 |
1992-93 | 30.65 | 112.31 | 117.81 |
1993-94 | 31.37 | 100.00 | 100.00 |
1994-95 | 31.40 | 105.81 | 96.09 |
1995-96 | 33.45 | 102.29 | 87.69 |
1996-97 | 35.50 | 103.43 | 86.38 |
1997-98 | 37.16 | 105.84 | 86.43 |
1998-99 | 42.07 | 97.79 | 76.45 |
1999-00 | 43.33 | 96.74 | 74.22 |
2000-01 | 45.68 | 100.76 | 73.77 |
2001-02 | 47.69 | 102.09 | 73.18 |
2002-03 (up to Feb ‘03) | 48.46 | 97.77 | 68.88 |
7.86 The Indian Rupee depreciated against all the other major currencies during the 10-year period 1993-94 to 2002-03 (up to February 2003). The Rupee depreciated against the Pound Sterling and the Japanese Yen by 37 per cent and 27 per cent, respectively, during this period. It depreciated against the Euro by 6 per cent between 1999-2000 and 2002-03 (up to February 2003) (Chart VII.20).

7.87 As a whole, India’s current exchange rate policy seems to have stood the test of time. It has focused on the management of volatility without fixed rate target, while underlying demand and supply conditions are allowed to determine the exchange rate movements in an orderly way. The Reserve Bank will continue to follow the approach of watchfulness, caution and flexibility by closely monitoring the developments in the domestic and financial markets in home and abroad. It will co-ordinate its market operations carefully, particularly in regard to forex market with appropriate monetary, regulatory and other measures as considered necessary from time to time (RBI, 2002c).
IV. FOREIGN EXCHANGE RESERVES: APPROACH, DEVELOPMENTS AND ISSUES
Approach
7.88 The subject of foreign exchange reserves has received renewed interest in recent times in the context of increasing globalisation, acceleration of capital flows and integration of financial markets. The debt-banking-financial crises in several countries have also necessitated the need for an international financial architecture in which the management of foreign exchange reserves has emerged as one of the critical issues.
7.89 Contextually, the subject of foreign exchange reserves may be broadly classified into two inter-linked areas, viz., the theory of reserves and the management of reserves. The theory of reserves encompasses issues relating to institutional and legal arrangements for holding reserve assets, conceptual and definitional aspects, objectives for holding reserve assets, exchange rate regimes and conceptualisation of the appropriate level of foreign reserves. In essence, a theoretical framework for reserves provides the rationale for holding foreign exchange reserves. Reserve management is mainly guided by the portfolio management consideration, i.e., how best to deploy foreign reserve assets subject to statutory stipulations? The portfolio considerations take into account inter alia, safety, liquidity and yield on reserves as the principal objectives of reserve management. The institutional and legal arrangements are largely country specific and these differences should be recognised in approaching the critical issues relating to both reserve management practices and policy-making (Reddy, 2002).
7.90 The motives for holding reserves may be broadly classified under three categories, viz., transaction, speculative and precautionary. International trade gives rise to currency flows, which are assumed to be handled by banks driven by the transaction motive. Similarly, speculative motive is left to individuals or corporates. Central bank reserves, however, are characterised primarily as a last resort stock of foreign currency for unpredictable flows, which is consistent with precautionary motive for holding foreign assets. Precautionary motive for holding foreign currency, like the demand for money, can be positively related to wealth and the cost of covering unplanned deficit, and negatively related to the return from alternative assets. Furthermore, foreign exchange reserves are instruments to maintain or manage the exchange rate, while enabling orderly absorption of international capital flows. Official reserves are mainly held for precautionary and transaction motives keeping in view the aggregate of national interests, to achieve balance between demand for and supply of foreign currencies, for intervention, and to preserve confidence in the country’s ability to carry out external transactions.
7.91 The objectives for maintaining reserves are: (i) maintaining confidence in monetary and exchange rate policies; (ii) enhancing capacity to intervene in foreign exchange markets; (iii) limiting external vulnerability by maintaining foreign currency liquidity to absorb shocks during times of crisis including national disasters or emergencies; (iv) providing confidence to the markets, including credit rating agencies, that external obligations can always be met (thus reducing the overall costs at which foreign exchange resources are available to all the market participants); and (v) adding to the comfort of the market participants, by demonstrating the backing of domestic currency by external assets.
7.92 India’s approach to reserve management, until the balance of payments crisis of 1991 was essentially based on the traditional approach, i.e., to maintain an appropriate level of import cover defined in terms of number of months of imports equivalent to reserves. For example, the import cover of reserves shrank to three weeks of imports by the end of December 1990, and the emphasis on import cover constituted the primary concern say, till 1993-94. The approach to reserve management, as part of exchange rate management, and indeed the overall external sector policy underwent a paradigm shift with the adoption of the recommendations of the High Level Committee on Balance of Payments, 1993 (Chairman: C. Rangarajan). The Committee had recommended that the foreign exchange reserve targets be fixed in such a way that they are generally in a position to accommodate imports of three months. In the view of the Committee, the factors that are to be taken into consideration in determining the desirable level of reserves are: (i) the need to ensure a reasonable level of confidence in the international financial and trading communities about the capacity of the country to honour its obligations and maintain trade and financial flows; (ii) the need to take care of the seasonal factors in any balance of payments transaction with reference to the possible uncertainties in the monsoon conditions of India; (iii) the amount of foreign currency reserves required to counter speculative tendencies or anticipatory actions amongst players in the foreign exchange market; and, (iv) the capacity to maintain the reserves so that the cost of carrying liquidity is minimal.
7.93 With the introduction of market determined exchange rate, a change in the approach to reserve management was warranted and the emphasis on import cover had to be supplemented with the objective of smoothening out the volatility in the exchange rate, which has been reflective of the underlying market condition (RBI, 1996). Against the backdrop of currency crises in East-Asian countries and in the light of country experiences of volatile cross-border capital flows, there emerged a need to take into consideration a host of factors. The shift in the pattern of leads and lags in payments/receipts during exchange market uncertainties brought to the fore the fact that besides the size of reserves, the quality of reserves also assumes importance. Unencumbered reserve assets (defined as reserve assets net of encumbrances such as forward commitments, lines of credit to domestic entities, guarantees and other contingent liabilities) must be available at any point of time to the authorities for fulfilling various objectives assigned to reserves (RBI, 1998). As a part of prudent management of external liabilities, the policy is to keep forward liabilities at a relatively low level as a proportion of gross reserves (RBI, 1999).
7.94 The overall approach to management of foreign exchange reserves reflected the changing composition of balance of payments and liquidity risks associated with different types of flows and other requirements. The policy for reserve management is built upon a host of identifiable factors and other contingencies, including, inter alia, the size of the current account deficit and short-term liabilities (including current repayment obligations on long-term loans), the possible variability in FPI and other types of capital flows, the unanticipated pressures on the balance of payments arising out of external shocks and movements in repatriable foreign currency NRI deposits (RBI, 2000).
7.95 An important issue which has figured prominently in the current debate on foreign exchange management is the question of appropriate policy for management of foreign exchange reserves. In a regime of free float, it can be argued that there is no need for reserves. In the light of volatility induced by capital flows and self-fulfilling expectations that this can generate, there is now a growing consensus among emerging market economies to maintain ‘adequate’ reserves (Jalan, 2002). Therefore, while focusing on prudent management of foreign exchange reserves in recent years, the ‘liquidity at risk’ associated with different types of flows has come to the fore (RBI, 2001). With the changing profile of capital flows, the traditional approach to assessing reserve adequacy in terms of import cover has been broadened to include a number of parameters which take into account the size, composition, and risk profiles of various types of capital flows as well as the types of external shocks to which the economy is vulnerable. A sufficiently high level of reserves is necessary to ensure that even if there is prolonged uncertainty, reserves can cover the liquidity at risk on all accounts over a fairly long period. Taking these considerations into account, India’s foreign exchange reserves have reached a very comfortable level. The current thinking in this regard has been clearly articulated: 'The prevalent national security environment further underscores the need for strong reserves. We must continue to ensure that, leaving aside short-term variations in reserves level, the quantum of reserves in the long-run is in line with the growth of the economy, the size of risk-adjusted capital flows and national security requirements. This will provide us with greater security against unfavourable or unanticipated developments, which can occur quite suddenly' (RBI, 2002c). In the context of the uncertain ramifications of the current developments in Iraq, the relevance of a comfortable reserve level appears particularly important. Unlike 1990-91, implications of such developments in the Gulf region for the external sector appears modest and manageable, mainly due to the comfortable reserve level.
7.96 The foregoing discussion points to the evolving considerations and a paradigm shift in India’s approach to reserve management. The shift has occurred from a single indicator to a menu or multiple indicators approach. Furthermore, the policy of reserve management is built upon a host of factors, some of which are not quantifiable, and in any case, weights attached to each of them do change from time to time.
Developments
7.97 In India, reserves have been steadily built up by encouraging non-debt creating flows and de-emphasising debt creating flows, particularly short-term debt. This strategy, coupled with the maintenance of an acceptable level of current account deficit and market determined exchange rate regime was the cornerstone of the policy of external sector management. In the context of the changing interface with the external sector and the importance of the capital account, reserve adequacy is now evaluated by the Reserve Bank in terms of several indicators and not merely through conventional norms, such as, the import cover. As a matter of policy, as far as possible, foreign exchange reserves are kept at a level which is adequate to withstand both cyclical and unanticipated shocks (RBI, 1999).
7.98 In the context of increasing cross-border linkages and the growing importance of the capital account, it became necessary to evaluate reserve adequacy in terms of both conventional indicators and non-conventional norms (Reddy, 1997). The Report of the Committee on Capital Account Convertibility, 1997 (Chairman: S. S. Tarapore) suggested four alternative measures to assess reserve adequacy: (i) import cover of six months; (ii) import cover of three months plus 50 per cent of annual debt service payments plus one month’s imports and exports to take into account the possibility of leads and lags; (iii) ratio of short-term debt and stock of portfolio investment related non-debt liabilities to reserves at not more than 60 per cent; and (iv) the net foreign exchange assets to currency ratio (NFA/currency ratio) at around 70 per cent with a minimum of 40 per cent for this ratio to be stipulated by the RBI Act. In recent times, Pablo Guidotti has suggested that emerging market economies must maintain usable forex reserves exceeding scheduled amortisation of foreign currency debts falling due (assuming no roll-overs) during the following year. The concept of ‘usable reserves’ merits particular attention in view of the developments experienced by Korea and Thailand during the 1997 crisis. A large part of the gross reserves was not available to the authorities to defend the falling exchange rates. Greenspan (1999) suggested a ‘liquidity-at-risk’ rule and observed that 'countries could be expected to hold sufficient liquid reserves to ensure that they could avoid new borrowing for one year with a certain ex ante probability, such as 95 per cent of the time'.
7.99 India is amongst the top ten reserve holding emerging market nations (Charts VII.21-23 and Table 7.16). Reserve adequacy indicators also place India at a comfortable position vis-à-vis emerging market economies (Table 7.17).


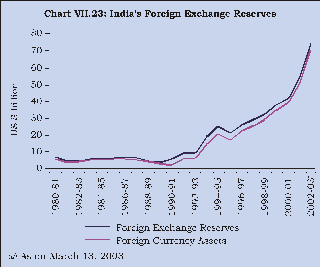
Table 7.16: Total International Reserves minus Gold | ||||||
(SDR billion) | ||||||
Countries/Country Groups | 1963 | 1973 | 1983 | 1993 | 2002 | |
(Nov) | ||||||
1 | 2 | 3 | 4 | 5 | ||
1. All countries | 26.6 | 116.8 | 362.3 | 797.7 | 1837.3 | |
2. Industrial countries | 19.2 | 79.9 | 206.2 | 413.4 | 727.0 | |
3. Developing countries | 7.5 | 36.9 | 156.1 | 384.3 | 1110.3 | |
4. Asia | 2.7 | 8.6 | 54.6 | 220.3 | 703.8 | |
of which: | ||||||
i. | China, People’s Rep. | - | - | 14.3 | 16.3 | 204.2 @ |
ii. | Hong Kong | - | - | - | - | 83.8 |
iii. | India | 0.4 | 0.7 | 4.7 | 7.4 | 48.5 |
iv. | Indonesia | 0.0 | 0.7 | 3.6 | 8.2 | 21.9 |
v. | Korea, Republic of | 0.1 | 0.7 | 2.2 | 14.7 | 89.3 |
vi. | Malaysia | 0.4 | 1.1 | 3.6 | 19.8 | 25.7 |
vii. | Philippines | 0.1 | 0.8 | 0.7 | 3.4 | 9.8 |
viii. | Singapore | 0.4 | 1.9 | 8.9 | 35.2 | 60.6 |
ix. | Thailand | 0.5 | 1.0 | 1.5 | 17.8 | 27.8 |
@ Data refer to October 2002. | ||||||
Source : International Financial Statistics, Yearbook 2002 and December2002. | ||||||
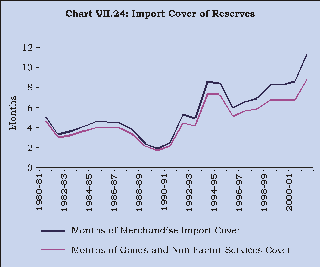
7.100 India’s foreign exchange reserves increased from US $ 4.7 billion in June 1991 to US $ 73.9 billion as on March 13, 2003. The predominant component of foreign exchange reserves is in the form of foreign currency assets that increased from US $ 1.1 billion to US $ 71.7 billion during the same period (Chart VII.23). The gold holdings of the Reserve Bank remained broadly stable at around US $ 3-4 billion during the same period. SDR holdings of the Government came down from US $ 63 million in June 1991 to US $ 4 million as on March 13, 2003. The movement in India’s foreign exchange reserves since 1993-94 can be divided into three phases: (i) the period March 1993 to March 1995, when reserves increased sharply from US $ 9.8 billion to US $ 25.2 billion, (ii) the period March 1995 to March 1999, when reserves increased moderately to US $ 32.5 billion, and (iii) finally since 1999-2000, when there was a phenomenal increase in reserves - as much as US $ 41.3 billion cumulatively (by US $ 5.5 billion in 1999-2000, US $ 4.2 billion in 2000-01, US $ 11.8 billion in 2001-02, and US $ 19.8 billion during 2002-03 (up to March 13, 2003).
.Table 7.17: Indicators of Reserve Adequacy | |||||||||
Country | Reserves/Imports | Reserves/Short term | Reserves/ External | ||||||
(Weeks of Imports) | External Debt (Per cent) | Debt (Per cent) | |||||||
1999 | 2000 | 2001 | 1999 | 2000 | 1999 | 2000 | |||
1 | 2 | 3 | 4 | 5 | 6 | 7 | |||
Brazil | 35.00 | 28.88 | 33.40 | 119.06 | 104.87 | 14.28 | 13.65 | ||
Chile | 46.86 | 41.38 | 41.51 | 1231.62 | 582.21 | 42.04 | 39.83 | ||
India | 36.14 | 38.41 | 48.08 | 831.3 | 1095.38 | 33.28 | 37.76 | ||
Indonesia | 57.29 | 44.21 | 45.69 | 132.00 | 125.88 | 17.53 | 20.1 | ||
Korea | 32.11 | 31.15 | 37.87 | 212.84 | 237.59 | 56.74 | 71.51 | ||
Mexico | 11.64 | 10.58 | 13.83 | 132.09 | 187.59 | 18.96 | 23.63 | ||
Philippines | 21.12 | 20.07 | 22.29 | 230.09 | 219.33 | 24.95 | 26.07 | ||
Thailand | 35.12 | 26.78 | 27.12 | 145.49 | 215.19 | 35.20 | 40.19 | ||
China | 49.46 | 42.46 | 46.04 | 891.97 | 980.20 | 102.26 | 112.35 | ||
Hungary | 20.32 | 18.12 | 16.54 | 309.32 | 269.64 | 36.71 | 38.04 | ||
Malaysia | 24.49 | 18.66 | 21.47 | 509.15 | 635.78 | 73.03 | 70.57 | ||
Turkey | 29.84 | 21.86 | 23.87 | 99.49 | 77.79 | 22.88 | 19.35 | ||
Venezuela | 41.15 | 42.09 | 26.3 | 596.12 | 743.75 | 32.16 | 34.28 | ||
Argentina | 53.51 | 51.81 | 37.25 | 89.23 | 88.81 | 18.07 | 17.21 | ||
Hong Kong SAR | 27.88 | 26.28 | 28.75 | - | - | - | - | ||
Sources : | (1), | International Financial Statistics Yearbook, 2002 | |||||||
(2) | Global Development Finance, World Bank 2002, | ||||||||
(3) | International Financial Statistics, January 2003. | ||||||||
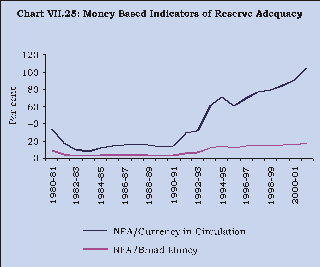
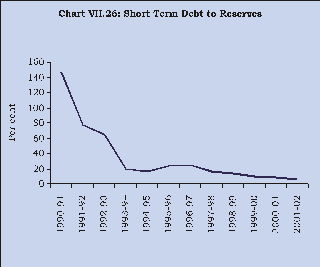
7.101 The traditional trade-based indicator of reserve adequacy, i.e., the import cover of reserves (foreign currency assets), which fell to a low of two weeks of imports in June 1991 improved to 11.3 months of imports as at end-March 2002. Import cover of reserves further increased to nearly 14 months of imports by March 2003 (Chart VII.24). In terms of the money-based indicators, the ratio of net foreign exchange assets of the Reserve Bank to currency in circulation sharply increased from 14.4 per cent at end-March 1991 to 105.2 per cent at end-March 2002 while that of net foreign exchange assets to broad money increased from 3.0 per cent to 17.6 per cent over the same period (Chart VII.25). The debt-based indicators of reserve adequacy also steadily improved in the 1990s. The ratio of volatile capital flows (defined as cumulative portfolio flows and short-term debt to reserves), which was 71.1 per cent as at end-March 1996 fell to 48.1 per cent as at end-March 2002. The ratio of short-term debt to reserves declined from 146.5 per cent in 1990-91 to 5.1 per cent in 2001-02 (Chart VII.26). Taking these factors into account, India’s foreign exchange reserves are at present comfortable and consistent with the rate of growth, the share of external sector in the economy and the size of the risk adjusted capital flows (RBI, 2002c).
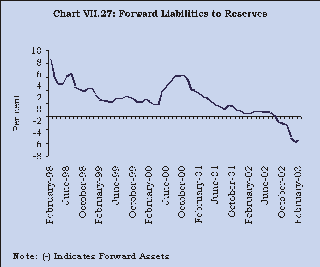
7.102 As a part of prudent reserve management policy, the net forward liabilities have been kept at relatively low levels. The proportion of forward liabilities declined from 6.1 per cent of gross reserves at end-March 1998 to 0.3 per cent at end-August 2002 (Chart VII.27). In the subsequent months, these have been fully retired and the Reserve Bank held net forward assets of US $ 2.6 billion in February 2003.
7.103 While the significant accretion to foreign exchange reserves has provided comfort on external sector management, two contentious issues have come to the fore. These are the trade-off between costs and benefits accruing from the reserves accretion and the associated monetary impact that emanates from it.
International Reserves and Optimality
7.104 The policy of accretion to reserves to meet the transactions and precautionary needs generally involves both financial and economic cost to the country. In the absence of any unique definition of the opportunity cost, one comes across several interpretations in the literature, the applicability of which depends on the particular economic context. When an economy is both foreign exchange and saving constrained, the opportunity cost could be the rate of return on domestic investment (assuming that the foreign exchange used to finance unsatiated investment demand would have fetched the return on domestic investment). When an economy is only foreign exchange constrained, the opportunity cost could be in terms of foregone consumption. When an economy is not foreign exchange constrained ( i.e., all productive forex demand are met before the reserves are built up), the opportunity cost would depend on the difference between the cost of borrowing and the return on reserve assets. If high cost borrowings are used to build reserves on which modest returns are obtained because of the emphasis on safety and liquidity of reserve assets, such reserve build-up policies may prove more costly. Another form of cost - often known as the quasi-fiscal cost - arises from the higher rate of return on domestic assets vis-à-vis foreign assets. Since sterilised intervention gives rise to an offsetting change in the domestic asset holding of a central bank when its foreign assets increase, the overall profits arising from the total asset portfolio of the central bank’s balance sheet may decline. As a result, the profits transferred to the Government -which represents a major source of non-tax revenue for the Government - may decline. For countries operating with large fiscal imbalances, such a decline in non-tax revenue could prove more costly, forcing a higher mobilisation of tax revenue or a cut in expenditure that may affect growth and development.
7.105 The development of money demand theory along the lines of optimal inventory control or buffer stock model provides a natural theoretical benchmark for the study of optimal reserve accumulation and has spurred a large body of empirical literature in the late 1960s and early 1970s (Grubel, 1971; Kelly, 1970). Heller (1966) used a cost-benefit approach and stressed that the issue is one of choosing an optimal level of reserves at which the central bank minimises the total expected cost i.e., the sum of the adjustment cost that is incurred when reserves reach some lower bound and the opportunity cost. Heller’s estimation indicated that optimal reserves are directly proportional to the variability of exports and are inversely related to the opportunity cost variable (defined as foregone earnings or economic welfare). Frankel and Jovanovic (1981) and Landell-Mills (1989) also found a negative relationship between the demand for reserves and its opportunity cost. Flood and Marion (2001), however, did not find any relationship between reserves and opportunity cost. The sign of the propensity to import has also turned out to be ambiguous in the literature. Several studies have found an inverse relationship, (Heller, 1966; Kelly, 1970; Heller and Kahn, 1978; Landell-Mills, 1989) while some others found a positive relationship between import propensity and reserves (Frankel, 1974; Edwards, 1984). While the inverse relationship between reserves and the propensity to import has been interpreted as the extent of adjustment to an external shock, the direct relationship is an indicator of the degree of openness. Eaton and Gersovitz (1980) formally introduced the concept of transactions demand for reserves. In addition to the ‘conventional’ variables, Ben-Bassat and Gottlieb (1992) introduced risk of default or sovereign risk into the assessment of precautionary demand for reserves. Lane and Burke (2001) adopted a broad approach to identify the potential determinants of reserves and found: (i) trade openness to be the most important variable along with financial deepening (M2/GDP); (ii) smaller and more volatile industrial countries hold larger reserves than their larger, less volatile counterparts; and (iii) more indebted developing countries had smaller reserve ratios. The traditional determinants identified in the empirical literature on foreign exchange reserve holdings are presented in Table 7.18.
Table 7.18: Determinants of the Demand for Reserves | ||||
Variables | Description | |||
Scalar variable Propensity to import Variability measure | Imports, per capita income, GDP, population Marginal/average propensity to import Exports, imports, terms of trade, receipts, payments, nominal effective exchange rate, balance of payments, reserves | |||
Opportunity cost | Marginal product of capital (MPK) or in the absence of MPK, per capita output (as an inverse proxy for marginal product of capital), marginal utility of consumption, rate of interest on borrowing from abroad, net foreign indebtedness, the government bond yield, the spread between the government bond yield and short-term International interest rates, marginal productivity of social capital, one-year deposit rate. | |||
7.106 Analytically and empirically, reserve holding appears to be an under-researched area. Clear standard methodologies have yet to evolve on this subject. However, relatively high demand for international reserves by countries in Far East and relatively low demand by some other countries has attracted attention. Aizenman and Marion (2002) recently showed that for 125 developing countries, reserve-holding over 1980-1996 period could be predicted by the size of international transactions, their volatility, the exchange rate arrangement and political considerations. Sovereign risk and fiscal liabilities led to relatively large precautionary demand for reserves.
7.107 Aizenman and Marion (2002) showed that there has been a structural break in the equation for the demand for reserves in several Asian countries that were affected by crisis in 1997. Using a standard estimating equation, they found that over the period 1960-96, their model over-predicted the reserve holdings of countries such as China, Taiwan, Hong Kong, South Korea and Singapore implying thereby that their reserves were low in relation to what was estimated as desirable in the model. Out of sample forecasts of desirable levels generated for 1997-99, however, under predicted the reserve holding (i.e., actual reserves holdings exceeded the predicted desirable level). Such a result has to be assessed in the context of the overall change in policy stance of the emerging market economies in the aftermath of the Asian crisis that viewed high reserves as an appropriate policy of 'self-insurance'.
7.108 In India, the determinants of reserve holdings appear to have changed considerably and evolved over the recent years with the gradual opening up of the capital account, the Asian crisis (with contagion emerging as a significant determinant), the imposition of sanctions following the nuclear explosion in Pokhran in May 1998 and the subsequent rating downgrade on foreign currency borrowings. These new factors, by their very qualitative nature, are difficult to quantify. Taking recourse to exceptional external borrowings in the form of RIBs (1998-99) and IMDs (2000-01) could be interpreted as the manifestation of the precautionary demand for reserves by the authorities; but for RIBs and IMDs, accretion to reserves during these two years would have been negative.
7.109 The substantial growth in reserves since 2001-02 has generated a debate regarding the cost of holding reserves. While the cost of reserves is secondary to properly meeting the overall objective behind holding reserves, it is important to note that in India, in the last few years, almost the whole addition to reserves has been made without increasing the overall level of external debt, which has hovered around US $ 100 billion during the previous five years. The increase in reserves largely reflects higher remittances, quicker repatriation of export proceeds and non-debt flows (RBI, 2003). Even after taking into account foreign currency denominated NRI flows (where interest rates are linked to LIBOR), the financial cost of additional reserve accretion in India in the recent period is low (RBI, 2002).
Monetary Impact of Foreign Exchange Reserves
7.110 While the reserve build up policies of the emerging market economies like India reflect the importance of appropriate reaction to the vastly altered conditions prevailing at both national and global levels, high reserve policies also entail several other implications, particularly for monetary management and in terms of the quasi-fiscal costs, both of which pose a different type of challenge to the policy makers.
7.111 Cross-country experiences of surges in capital inflows indicate that in the context of the limited capacity of the economy to absorb capital flows in the form of higher productive investment and the resultant implications for the exchange rate, monetary authorities often intervene in the foreign exchange market to absorb the surplus in the market and thereby avoid nominal appreciation of the exchange rate. A non-sterilised (or partially sterilised) intervention can, however, cause a sharp rise in the monetary base and hence higher inflation. Real appreciation resulting from higher inflation could erode external competitiveness; lower interest rates could also fuel lending and consumption boom, that can potentially lead to a sharp deterioration in the current account balance and culminate in a possible currency crisis. When the conflict between the policy objectives of checking nominal appreciation and limiting inflation emerges, central banks attempt to counter inflation through sterilised intervention, which by nature appears money supply neutral.
7.112 Among the instruments available for sterilisation, recourse to open market operations (OMOs) is particularly effective if inflows are temporary and there exists a near perfect elastic demand for domestic government securities. However, if the demand for government securities is not perfectly elastic in view of the limited absorptive capacity of market participants and the underdeveloped nature of the financial markets, OMOs can cause domestic interest rates to rise, nullifying the impact of sterilisation as higher interest rates could attract larger capital inflows. Sterilisation typically involves exchanging high-yielding domestic assets for low-yielding foreign assets and, therefore has quasi-fiscal costs. The degree of effectiveness of sterilised intervention would therefore depend on: (i) the sensitivity of domestic interest rates to OMOs and (ii) the degree to which foreign capital flows respond to such interest rate variations. The combined effect, which is captured through the estimated 'offset coefficient', indicates that the value of the coefficient may range between 0 and (-) 1, with values close to zero indicating 'effectiveness of sterilisation' and values close to (-) 1 indicating 'ineffective sterilisation'. Over the period April 1993 to March 1997, the offset coefficient for India turned out to be (-) 0.3, suggesting that sterilisation of the surges in capital flows experienced during the 1990s was effective (Pattanaik, 1997). Sterilisation induced increase in interest rates, however at times, may be more than offset by the change in the stance of monetary policy. When capital flows are persistent and sterilisation proves ineffective, cross-country studies show that countries often attempt a few options available to them. These include: fiscal adjustment, easing of restrictions on capital outflows, accelerated trade liberalisation, lower interest rates on foreign currency deposits, prepayment of costly debt, adoption of new sterilisation techniques such as foreign exchange swaps, switching of government deposits from the banking system to the central bank, imposition of taxes on domestic assets purchased by foreigners, fixing of ceilings on foreign borrowings by domestic residents, and recourse to indirect capital controls, such as variable unremunerated reserve requirements on certain categories of foreign borrowing. In the Indian case, capital flows have had a softening effect on interest rates and positive effect on broad money growth.
7.113 Capital inflows have served the twin purpose of meeting India’s domestic investment-saving gap and the need for reserve accretion consistent with the standard indicators of reserve adequacy. The latter objective has become more prominent recently in tandem with the pattern seen in many Asian countries in the aftermath of the Asian crisis.
7.114 The surge in capital flows often poses a challenge to the conduct of monetary and exchange rate policy. As a result of large accretion to reserves resulting from surges in capital flows in the face of low domestic absorption, there has been a substantial increase in net foreign exchange assets (NFA) of the Reserve Bank. In the period since 1992-93, the NFAs have grown at a higher rate than net domestic assets (NDAs) (excepting 1995-96). In fact, NDAs held by the Reserve Bank had to be brought down by sterilisation through OMOs (particularly since 1996-97) to check the expansion in the monetary base. The extent of sterilisation, however, varied from year-to-year, depending on the requirements to modulate liquidity conditions. With sustained surge in capital flows since 1999-2000, the NDAs of the Reserve Bank even recorded a decline in absolute terms on account of significant OMOs (net sales) (Chart VII.28).
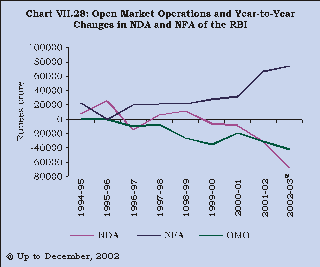
7.115 There is hardly any formal analysis available for emerging market economies (including India) to evaluate the monetary impact of large capital flows econometrically. One way to assess the impact is to simulate the emerging monetary condition in counterfactual scenarios where reserve accretion is placed at lower levels. For this purpose, an interest rate reaction function has been estimated that relates domestic interest rate to its possible determinants like inflation, output and capital flows along with a conventional money demand equation in terms of income and interest rate (Box VII.7). Controlling for the impact on interest rates from the accretion to reserves, the counterfactual path generated through a simulation exercise under lower reserves accumulation points towards a perceptible monetary impact of reserves in the 1990s in terms of higher broad money demand (Charts VII.29 and VII.30).
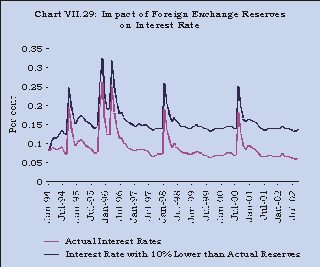

Box VII.7 One way to assess the monetary impact of reserves is through the approach adopted for Mexico and India (Kamin and Wood, 1998; Rath, 2002). This approach involves two equations: (1) an interest rate reaction function and (2) a money demand function. The money demand function is of the following form: log (RM3) =a - b i + d log(Y) + e M (1) where, RM3 is real demand for money, i is domestic interest rate and Y is real income. A rise in real income would lead to higher demand for real money balances while increase in the relative return from holding non-monetary assets would lead to a decline in money holding. With a stable money demand function, the impact of forex reserves on money would emanate through the interest rate channel. Unlike the standard Taylor type reaction function where the interest rate responds to inflation-gap (for a given inflation target) and output-gap (for given potential output), the interest rate reaction function presented below is posited to respond positively to both inflation and output growth. In this framework, interest rates may be modulated in response to increase in capital flows (proxied by reserves) i = v + l p + f y - q R +e1 (2) where, p is the rate of inflation, y is the growth in real output and R is the level of reserves. In the model, the impact of reserves on money demand is indirect through its impact on interest rate (i) derived from (2) and then through interest rate on money demand given by (1), as: dRM3 / dR = (dRM3 / di ) * di / dR = (-b ) (-q) > 0 (3) Through simulation exercise, counterfactual paths of interest rates and money balances are charted that would have occured under lower reserve build up. Using the monthly data during September 1980 to September 2002, equations (1) and (2) are estimated. In the Indian context, since monthly data on real GDP is not available index of industrial production (IIP) has been used as the proxy variable. As regards the interest rate, the call rate is assumed to be a proxy for the short-term money market rate of interest. Inflation is measured by change in wholesale price index. Extreme fluctuations in the call rate and the seasonal effects on money demand have been captured through the inclusion of appropriate dummies (represented as D) in the equation. The estimated equations are:
The signs of the coefficients of the variables in equations (4) and (5) are along expected lines. The impact of foreign exchange reserves on interest rate and money demand is then analysed through simulation of the two equations and comparing the forecast values with another simulation under the assumption that reserves are ten per cent lower than the baseline. |

7.116 In the period of surge in capital flows and significant accretion to foreign exchange reserves with the monetary authority, the literature points to the emergence of newer channels of monetary expansion, especially, if there is a disassociation between the growth of broad money and reserve money. In India, over the 1980s and 1990s, notwithstanding a fall in reserve money growth, broad money grew almost at the same level in the two decades, which may be symptomatic of such a disassociation. The stylised simulation model in Box VII.7 is an attempt at exploring the likely mechanism that characterises the underlying process of monetary expansion. The exercise suggests that had there been a lower reserve accumulation with the Reserve Bank, the interest rate would perhaps have been higher, thus, possibly signifying that the liquidity effect of reserve accumulation would have outweighed the sterilisation effect in the Indian context.
7.117 In the 1990s, composition of reserve money expansion has shifted from domestic assets to foreign assets reflective of the surge in capital flows, accumulation of reserves and sterilisation operations of the Reserve Bank. Sterilisation operations have so far been successful in arresting reserve money growth to levels where the inflationary potential of capital flows has been kept in control. However, future concerns on monetary management may arise, among others, from the following factors:
need to ensure sufficient stock of Government securities at the hands of the Reserve Bank for sterilisation operations of the required magnitude;
the absorption capacity of the financial system for Government securities once the credit demand picks up; and
the upward drift in money multiplier arising partly from fall in currency-deposit ratio and CRR has sustained higher growth of broad money in the face of declining reserve money growth. With financial liberalisation and market-determined interest rates, there is evidence that innovations to money multiplier emanate from interest rates and other macroeconomic variables (such as growth) apart from the conventional proximate determinants (Jha and Rath, 2001). To the extent that these newer determinants of money multiplier are not entirely under the control of the monetary authority, it poses a challenge for the Reserve Bank to manage the emerging monetary conditions.
Capital Inflows, Foreign Exchange Reserves and Growth
7.118 The coexistence of slowdown in the growth rate of the Indian economy in the recent period and the sharp build-up of foreign exchange reserves, has fuelled the debate on their possible inter-relationship and has called into question, in some quarters, the extant policy of reserve accretion. A recent study (See Box VII.8 for details) for example, has contended that India could have attained a higher growth trajectory had capital inflows been allowed to be absorbed by the economy (instead of accumulating them as foreign exchange reserves of the central bank) and had fiscal deficits not been incurred. According to the study, the entire foreign capital can be absorbed by allowing the real exchange rate to appreciate. The real appreciation could be engendered either by allowing the nominal exchange rate to appreciate or by allowing prices to increase (i.e., non-sterilised reserve build-up which will increase the money supply and thereby give rise to both higher inflation and lower interest rates - both of which can increase absorption). An econometric exercise shows that the growth rate could have been higher by about 1 to 6 per cent in different years in the 1990s. The study makes the following policy recommendations: (i) the reserve management policy should be replaced by appropriate monetary and exchange rate policies that could boost growth; (ii) have a tighter fiscal policy (to contain the crowding out effect) and an easier monetary policy (by non-sterilisation of reserves - that could increase prices and lower interest rates); (iii) high reserves and low domestic inflation provide the right environment against which the Rupee can be made fully convertible on the capital account; and (iv) replace on the managed exchange rate regime by full float.
7.119 The above results and policy prescriptions, however, need to be viewed with a great deal of circumspection. First, it needs to be recognised that high reserves reflect the lack of absorption/demand, and prescribing real appreciation as a means to raise domestic absorption completely disregards the importance of the trade-off between growth and stability and the role of a central bank in ensuring stability as a means to higher growth.
7.120 Second, the experience of the emerging market crises in the last decade shows that with low reserves and appreciated real exchange rate, India would have also faced a similar (or even more severe) crisis. On an average, the crisis years witnessed a sizeable growth reversal of the order of 6 to 7 per cent in all the crisis affected countries which could have offset the perceived ‘first round’ gains to the growth rate.
Box VII.8 A study by Lal, Bery and Pant (2003) has contended that the growth rate in the Indian economy would have been much higher had capital inflows been absorbed by the economy instead of being accumulated as foreign exchange reserves. The Study bases its conclusion on the relationship between the real exchange rate, capital inflows, excess demand and the growth rate. The Study estimates the real exchange rate (er) as the ratio of the prices of traded goods to non-traded goods, as obtained from the WPI series. Net capital flows (B) are taken to include transfers (mainly workers’ remittances). The ‘excess demand’ variable (ED) (reflecting the fiscal and monetary impact) is constructed from the national income accounting identities, as the difference between the trade deficit and capital inflows, inclusive of remittances. The relationship between the three variables is estimated thus ert = 87.6 Bt + 3.05 EDt
R2 = 0.26, adj. R2 = 0.18, F = 3.119, N = 20 The growth estimates consistent with full absorption of capital flows have been derived essentially by estimating the degree to which ‘er’ would have been misaligned with full market absorption of capital flows. The higher (S-I) gap resulting from full absorption can increase the capital stock, which would yield higher growth through a production function having two factors of production (i.e. labour and capital). A few technical anomalies are apparent in the above formulation. First, R2 is too low and the DW is not stated. Reworking on their data shows the presence of serious autocorrelation with a DW of 1.18. Furthermore, the Cusum Square criterion shows that the equation is highly unstable. Consequently, any estimation/inference based on the above exercise would be highly tentative. In a separate exercise, a correction for autocorrelation using the Cochrane-Orcutt method brought about a reversal of the signs of both the excess demand (ED) and the capital inflow (B) coefficients. Second, it is not clear how the ‘er’ series generated in the study can explain the impact of full absorption of foreign capital. Since the ‘er’ series is the relative price of tradebles and non-tradeables taken separately from the disaggregated WPI data for India, it may only explain the relative profitability of tradeable and non-tradeable sectors within the economy. The prices prevailing in the external markets (i.e. export markets and the markets from where the import originates) are, however, of significance to exporters and importers. The real appreciation cannot increase absorption, because ‘er’ cannot explain how the relative prices of domestic tradeables will change vis-à-vis international prices as a result of domestic nominal appreciation. In the absence of information on the latter, it is difficult to assess how the CAD would widen as a result of real appreciation. The most striking aspect of the ‘er’ series is that it shows very modest misalignment over the entire period 1981-2000. The series is not only smoother than the series published by the Reserve Bank but it also lies above the RBI series throughout the twenty year period covered in the study. It almost suggests that the prices of tradeables and non-tradeables moved in tandem, irrespective of the behaviour of the nominal exchange rate (which depreciated during this period) and inflation differentials (which remained positive throughout). The Study mentions that domestic prices of tradeables in rupees are the same as foreign prices of tradeables converted at the nominal exchange rate. This theoretical identity has not been verified empirically and since the Study uses only the tradeable prices from WPI, it does not explain how the effects of any change in nominal exchange rate can get transmitted to tradeable prices. In the absence of a transmission channel, even if nominal exchange rate appreciates due to full absorption of capital flows in the market, REER may not appreciate. Third, the ‘er’ equation - that is used to determine the misaligned rate under full absorption - has net capital flows plus remittances (i.e. B) and excess demand (i.e. ED) on the right hand side. Since ED has been derived as [ED=(M-X) -B], if both B and ED are taken in the same equation, there could be the problem of multi-collinearity. Furthermore, the coefficient of B in the equation is statistically insignificant (i.e. not different from zero). The authors, however, use the B coefficient to estimate the misaligned ‘er’. Also, as already mentioned, a part of B gets absorbed in financing the deficit in the goods and services account and therefore, something less than B could be taken to estimate the ‘er’ consistent with full absorption. Most importantly, it is not clear why the estimated ‘er’ from a regression of ‘er’ on B can be viewed as the proxy for the ‘er’ that would have prevailed under condition of full absorption. Given that a large part of B was already used for reserve buildup, that would have prevented major change in ‘er’ (both by preventing nominal appreciation and by sterilising the monetary impact of reserves). The empirical relationship between the two, therefore, should be negligible, which is also obtained in the regression equation as evidenced by the statistical insignificance of the B coefficient. In the absence of any argument explaining why the estimated ‘er’ would approximate the full absorption-’er’, it is not evident whether the channel suggested for increasing the absorption of foreign capital would help in raising growth. The estimated ‘er’ series that fully captures the impact of full absorption shows only very modest appreciation over the period 1981 - 2001 (a cumulative real appreciation of only 8 per cent over a 20 year period). With full absorption, however, one would have expected a much larger real appreciation. Fourth, in the production function equation, full absorption impact enters only through a change in the capital stock. In a sense, it does not use the estimated ‘er’. It only mentions about the factor A, which depends on the elasticity of substitution in both demand and supply between tradeables and nontradeables. The manner in which A is derived in the production function is critical, since the value of A can greatly influence the projected growth rate for any given level of capital and labour. It appears that the estimated values of A have a strong upward bias, and in the absence of any convincing justification supporting the determination of the value A, the entire exercise appears to be the result of discretionary adjustments. Fifth, the reason why the Study obtains a high growth rate from the full absorption of capital flows is that 'net capital flows and remittances' have been taken as the proxy for extra capital that is available under their hypothetical situation for addition to capital stock. It should, however, be recognised that these inflows would have already been partly utilised for financing the deficit in the goods and services account. After the partial absorption, only the remaining amount under 'net capital flows plus remittances' should have been viewed as the proxy for extra absorption. Since the surplus capital flows used as proxy for extra absorption has been overestimated by close to 40 per cent, the growth estimates also turn out to be higher. Moreover, even if one uses the correct figure on surplus capital flows, the production function used in the model may still yield a higher growth than what one would obtain through simple application of Incremental Capital-Output Ratio (ICOR). Since the authors do not mention anything about the productivity gains associated with capital flows and because that they only rely on increase in capital stock resulting from full absorption of foreign capital in the production function, it remains completely unclear as to why the growth could be higher than what the conventional ICOR would suggest. Finally, even assuming that the entire capital flows would have been allowed to supplement domestic saving to ensure higher investment, then the annual investment could have increased (say) by about 2 percentage points (with capital flows of about 3 per cent of GDP in the 1990s, 1 per cent was already used to finance current account deficit). Given the incremental capital output ratio of close to 4, additional growth of about 0.5 per cent could have been achieved (not 1 to 6 per cent as has been estimated in the paper). |
7.121 Third, it also needs to be recognised that even if REER appreciation is allowed to ensure full absorption of foreign capital, it is important to examine whether the full absorption (i.e. higher current account deficit) would result from an increase in imports or a major fall in exports. Given the asymmetric response of exports and imports to price changes brought about by REER appreciation, it is possible that a higher CAD would be attained more by a fall in exports than an increase in imports. It needs no emphasis that the external sector sustainability hinges critically on the performance of the export sector, and in the face of zero incremental reserves resulting from full absorption, weak export growth could be a strong source of vulnerability to crisis. On the other hand, even if imports increase in response to exchange rate appreciation, it is possible that import demand may just replace domestic demand, and as a result aggregate demand may remain unaltered. In other words, when imports are not driven by overall demand conditions (as is the case now) but are encouraged through a policy of exchange rate appreciation, imports may only compete with domestic supply and in the face of no increase in aggregate demand, the higher absorption through cheaper imports could displace some of the domestic manufacturers and thereby lower growth. Thus, growth gained through full absorption could be offset by lower growth resulting from displacement of domestic producers.
7.122 Fourth, the contention that full absorption of capital flows would significantly reduce the extent of crowding out by allowing a larger part of the fiscal deficit to be monetised, ignores the possibility of ‘crowding in’ effects by certain types of government expenditure which at times may dominate the crowding-out effects.
7.123 Finally, it needs to be recognised that foreign capital should not be allowed either to give rise to excessive consumption or excessive investment just to ensure full absorption. When foreign capital finances consumption demand (as in Mexico) or sustains an investment driven overheating (as in South East Asia), higher growth can be obtained only at the cost of a severe financial crisis. High reserves, a flexible exchange rate regime, and cautious liberalisation of the capital account, together aim at preventing a crisis. Sterilisation is a strong instrument to regain monetary independence that allows a policy of reserve build-up without any adverse monetary implications. Sterilisation has been used successfully so far in India and limits to sterilisation are yet to be reached.
7.124 The need for raising domestic absorption is well recognised and the Tenth Plan document already envisages a current account deficit of 2.8 per cent of GDP to attain a growth target of about 8 per cent. In the context of the Tenth Plan requirements, current levels of reserves and capital flows appear to be inadequate. Even if large capital flows materialise in future to meet the financing gap of 2.8 per cent of GDP as envisaged in the Tenth Plan document, the flows need to be regulated so that the CAD does not expand beyond the sustainable level. Hence, even though expanding absorption of foreign capital is a major policy challenge in the short-run, the overall medium to long-run policy strategy demands that the CAD be necessarily maintained within the sustainable level. This has been the most important lesson from the balance of payments crisis in 1991. Rather than engendering real appreciation, other counter-cyclical policies can be applied to revive aggregate demand, which in turn can improve absorption of foreign capital.
7.125 Monetary policy has already been eased to attain the objective of business cycle stabilisation without sacrificing the overriding inflation objective. The degree of manoeuvrability in fiscal policy is not very high because of the extent of fiscal imbalances prevailing today in India. During the phase of global slowdown, exchange rate appreciation could weaken exports and thereby have implication for external sector sustainability. The ‘Dutch disease’ problem is at best a very distant reality for India. Real appreciation has been prevented both through reserves build-up and sterilisation (the former preventing nominal appreciation and the latter preventing higher inflation). Excessive consumption/investment has been prevented by maintaining the CAD within sustainable levels. Thus, both the channels through which the ‘Dutch disease’ can spread, have been effectively regulated and their impact on the economy has been contained. With stronger recovery in demand, the surplus condition created by strong growth in remittances and software exports as well as capital flows would be absorbed automatically, reducing the scope for any Dutch disease effect and the need for any larger than desirable level of reserve build-up.
7.126 The external sector reform programme initiated in the wake of the balance of payments crisis of 1991 was all encompassing. Even though the reforms were largely crisis led, the policy initiatives were unique in terms of their gradual, cautious and country specific approach. As against balance of payments problems of varying intensities experienced during 1956 - 1991, India’s balance of payments position strengthened over the 1990s even as the period coincided with the liberalisation of external account, external currency crises and domestic political uncertainties.
7.127 Prudent exchange rate management, low current account deficit, steady flow of non-debt creating capital flows, particularly in the form of FDI, a significant reduction in the external debt to GDP ratio and containment of short-term debt to manageable and prudent limits have been some of the positive outcomes of policy reform in the external sector. Resilience of the external sector has helped India successfully avert the contagion effects of the East Asian crisis.
7.128 There are, however, a few areas, which require further efforts. India’s competitiveness in exports would require to be strengthened to achieve a sustained export growth of at least 12 per cent per annum in order to achieve the medium-term goal of increasing India’s share in world exports to 1 per cent by 2006-07. India also needs to make the transition from exports of labour-intensive low technology goods to a wider variety of goods, including technology intensive goods. India’s tariff levels continue to be high; accelerated pace of reduction of tariffs and removing the constraints on the small-scale industries would be conducive to industrial growth and exports. Rapid growth in exports would also require addressing the domestic constraints of supply bottlenecks and inadequate infrastructure.
7.129 A sustained surge in capital flows in the recent past has implications for monetary and inflation management although, the Reserve Bank has so far been able to sterilise the monetary impact of foreign exchange reserves through large open market sales of government securities. The financial cost of additional reserve accretion in the recent period is low.
7.130 There has been a debate that high accretion to forex reserves has resulted in a substantial output loss in the 1990s. It needs to be recognised, however, that the steady growth path is functionally related more to macroeconomic constraints of saving and investment than to the reserve management policy per se. The reserve management policy, coupled with the exchange rate management and monetary policy pursued by the Reserve Bank has created an atmosphere of softer interest rate regime, which is conducive to higher economic growth. In addition, the recent policy initiatives have created an investment atmosphere where foreign investment supplements domestic investment, which in a medium-term perspective would ensure a higher growth trajectory.
10. An impulse response analysis with output, inflation, interest rates and exchange rates as the four variables of the SVAR reveals that a positive shock to interest rate (indicating contractionary monetary policy) leads to reduction in aggregate demand and output and appreciation in the exchange rate in the short run. Pattanaik and Mitra (2001) found similar results with their analysis in a 3-variable VAR (exchange rate, direct market intervention and call money rates). The results on the efficacy of monetary policy in stabilising the exchange rate appear to be robust across different identification schemes.

ಈ ಪುಟವನ್ನು ಹಂಚಿಕೊಳ್ಳಿ:


ಭಾರತೀಯ ರಿಸರ್ವ್ ಬ್ಯಾಂಕ್ ಮೊಬೈಲ್ ಅಪ್ಲಿಕೇಶನ್ ಅನ್ನು ಇನ್ಸ್ಟಾಲ್ ಮಾಡಿ ಮತ್ತು ಇತ್ತೀಚಿನ ಸುದ್ದಿಗಳಿಗೆ ತ್ವರಿತ ಅಕ್ಸೆಸ್ ಪಡೆಯಿರಿ!
ನಮ್ಮ ಅಪ್ಲಿಕೇಶನ್ ಅನ್ನು ಸ್ಥಾಪಿಸಲು QR ಕೋಡ್ ಅನ್ನು ಸ್ಕ್ಯಾನ್ ಮಾಡಿ


ಪೇಜ್ ಕೊನೆಯದಾಗಿ ಅಪ್ಡೇಟ್ ಆದ ದಿನಾಂಕ:


