 IST,
IST,


VII Foreign Exchange Reserves (Part 2 of 2)
7.69 The emerging consensus is that for successful conduct of exchange rate policy, it is essential for countries to pursue sound and credible macroeconomic policies so as to avoid the build-up of major macro imbalances in the economy. Second, it is essential for EMEs to improve the flexibility of their product and factor markets in order to cope up and adjust to shocks arising from the volatility of currency markets and swings in the terms of trade in world product markets. Third, it is crucial for EMEs to develop and strengthen their financial systems in order to enhance their robustness to shocks. In addition, a sound and efficient banking system together with deep and liquid capital markets contribute to the efficient intermediation of financial flows. This could help prevent the emergence of vulnerabilities in the financial system by minimising unsound lending practices that lead to the build-up of excessive leveraging in the corporate sector and exposure to foreign borrowings. Fourth, countries would need to build regulatory and supervisory capabilities to keep pace with financial innovations and the emergence of new financial institutions’ activities, and new products and services, which have complicated the conduct of exchange rate policy. Fifth, policy makers need to promote greater disclosure and transparency.
7.70 The choice of exchange rate regime is likely to be of second order importance to the development of good fiscal, financial, and monetary institutions in producing macroeconomic success in emerging market countries. Less attention should be focused on the general question whether a floating or a fixed exchange rate is preferable, and more on these deeper institutional arrangements. Focus on institutional reforms rather than on the exchange rate regime would make the emerging market countries healthier and less prone to crises than we have seen in recent years (Calvo and Mishkin, 2003).
Exchange Rate Management: The Indian Experience
7.71 Against the backdrop of international experience, it would be useful to review the management of the exchange rate in India in a historical perspective. India’s exchange rate policy has evolved in tandem with international and domestic developments. The period after Independence in 1947 was followed by a fixed exchange rate regime where the Indian rupee was pegged to the pound sterling on account of historic links with Britain and this was in line with the Bretton Woods System prevailing at that time. A major event was the devaluation of the Indian rupee by 36.5 per cent on June 6, 1966. With the breakdown of Bretton Woods system in the early 1970s and the consequent switch towards a system of managed exchange rates, and with the declining share of the UK in India’s trade, the Indian rupee, effective September 1975, was delinked from the pound sterling in order to overcome the weaknesses of pegging to a single currency. Even after the rupee was delinked from the pound sterling the role of the exchange rate remained muted for quite sometime given the widespread rationing of foreign exchange through an elaborate system of licensing, other quantitative restrictions and exchange control. During the period of 1975 to 1992, the exchange rate of rupee was officially determined by the Reserve Bank within a nominal band of +/- 5 per cent of the weighted basket of currencies of India’s major trading partners. The Reserve Bank performed a market-clearing role on a day-to-day basis which introduced high variability in the size of reserves. The periodic adjustments in the exchange rate were, however, not enough to maintain external competitiveness as competitor countries had undertaken significant adjustments in their exchange rates despite their lower inflation than in India (Rangarajan, 1993). The exchange rate regime of this period can be best characterised as an adjustable nominal peg with a band, with the nominal exchange rate being the operating variable to achieve the intermediate target of a medium-term equilibrium path of the real effective exchange rate (REER).
Addressing the Balance of Payments Crisis of 1991
7.72 In the beginning of the 1990s, the significant rise in oil prices and suspension of remittances from the Gulf region in the wake of the Gulf crisis led to severe problems in the balance of payments in India. The problem was exacerbated with several exogenous developments like disruption of trade with the break-up of erstwhile Eastern Bloc, recessionary conditions in industrialised countries and restrictions on exposure of international banks to developing countries to comply with Basel norms. With drying up of access to commercial banks and short-term credit, financing of the current account deficit became unsustainable leading to a crisis situation. India’s foreign currency assets depleted rapidly from US $ 3.1 billion in August 1990 to US $ 975 million on July 12, 1991. A conscious decision was taken to honour all debt without seeking rescheduling and several steps were taken to tide over the crisis: (i) a part of gold reserves was sent abroad to get some immediate liquidity; (ii) non-essential imports were tightened by a variety of price based and quantitative measures; (iii) the IMF, multilateral and bilateral donors were approached; (iv) macroeconomic stabilisation programme was put in place; (v) India Development Bonds (IDBs) were floated in October 1991 to mobilise medium-term funds from nonresident Indians which yielded US $ 1.6 billion; and (vi) credible commitments were made to bring about structural reforms.
7.73 A two-step downward adjustment of 18-19 per cent in the exchange rate of the Indian rupee was made on July 1 and 3, 1991 with a view to placing it at an appropriate level in line with the inflation differential with major trading partners so as to maintain the competitiveness of exports. This provided the necessary impetus for a move towards greater exchange rate flexibility. Consequently, following the recommendations of the High Level Committee on Balance of payments (Chairman: C. Rangarajan), the Liberalised Exchange Rate Management System (LERMS) involving dual exchange rate system was instituted in March 1992 in conjunction with other measures of liberalisation in the areas of trade, industry and foreign investment. Under the LERMS, 40 per cent of exchange earnings had to be surrendered at an official rate determined by the Reserve Bank, which in turn was obliged to sell foreign exchange only for import of certain essential commodities such as oil, fertiliser and life saving drugs besides the Government’s debt servicing. The balance 60 per cent of exchange earnings was to be converted at rates determined by the market. The LERMS was essentially a transitional mechanism and a downward adjustment in the official exchange rate took place in early December 1992 and ultimate convergence of the dual rates was made effective from March 1, 1993. The unification of the exchange rate of the Indian rupee was an important step towards current account convertibility, which was finally achieved in August 1994 by accepting Article VIII of the Articles of Agreement of the IMF. On unification, the exchange rate of the Indian rupee became market determined and its downward adjustment both against the US dollar and also against a trade-weighted basket nullified the impact of the prevailing inflation differential.
7.74 The experience with the market determined exchange rate system has been satisfactory. The foreign exchange market was characterised by orderly conditions for most of the period, excepting a few episodes of volatility. During these episodes, the Reserve Bank under took monetary and other measures supported by sales of foreign exchange in the market to ensure orderly conditions in the market. These episodes are discussed in the following paragraphs.
7.75 With the gradual opening of current and capital account transactions in the 1990s, the increasing volume of capital flows had a direct bearing on the stability of the exchange rate. There were intermittent periods of excessive capital inflows followed by episodes of ebbing and subsequent recovery. From the viewpoint of examining the impact of external transactions on the exchange rate stability, the period starting from March 1993 (when the exchange rate became market determined) could be divided into four sub-periods as detailed below.
March 1993-August 1995
7.76 Reflecting the positive investor confidence, the Indian economy experienced surges in capital inflows during 1993-94, 1994-95 and the first half of 1995-96, which, coupled with robust export growth, exerted upward pressures on the exchange rate. Large capital flows were sterilised through timely interventions by the Reserve Bank. In the process, the nominal exchange rate of the Indian rupee vis-à-vis the US dollar remained virtually unchanged at around Rs.31.37 per US dollar over an extended period from March 1993 to August 1995.
September 1995-December 1996
7.77 The rupee came under pressure for the first time in August 1995 and the trend continued in phases till February 1996. The pressure on the rupee in August 1995 was brought about by a sudden and sharp reversal of market sentiment and expectations. Slowing down of the capital inflows in the wake of the Mexican crisis, a widening of the current account deficit on account of resurgence of growth in the real sector and the rise of US dollar against other major currencies were the main factors contributing to this phenomenon. The exchange rate of the Indian rupee depreciated by nine per cent during the period August 1995 to October 1995 before stabilising in February 1996. In response to the upheavals, the Reserve Bank intervened in the market to signal that the fundamentals were in place and to ensure that market correction of the overvalued exchange rate was orderly and calibrated. The interventions in the foreign exchange market were supported by monetary tightening to prevent speculative attacks. These decisive and timely measures brought stability to the market lasting till mid-January 1996. In the first week of February 1996, another bout of uncertainty led the rupee to shoot up to Rs.37.95 per US dollar. Interventions by the Reserve Bank along with measures to encourage faster realisation of export proceeds and to prevent an acceleration of import payments, however, succeeded in restoring orderly conditions and the rupee traded around Rs.34-35 per US dollar over the period March-June 1996. During the second half of 1996, the rupee remained range bound.
1997-2001
7.78 The foreign exchange market since 1997 had to cope with a number of adverse internal as well as external developments. Important internal developments included the imposition of economic sanctions in the aftermath of nuclear tests during May 1998 and the border conflict during May-June 1999. External developments included, inter alia, the contagion due to the Asian financial crisis, the Russian crisis during 1997-98 and the sharp increase in international crude oil prices in 1999-2000. Movements in interest rates in the industrialised countries as well as the cross-currency movements of the US dollar vis-à-vis other major international currencies were some of the other external developments impacting the foreign exchange market. These developments created considerable degree of uncertainty in the foreign exchange market leading to excess demand for US dollar. The Reserve Bank responded promptly through monetary and other measures like variations in the Bank Rate, the repo rate, cash reserve requirements, refinance to banks, surcharge on import finance and minimum interest rates on overdue export bills to curb destabilising speculative activities during these episodes of volatility while allowing an orderly correction in the value of the rupee.
7.79 India was successful in containing the contagion effect of the Asian crisis due to swift policy responses. Certain characteristics of the economy and safeguards developed over a period of time also helped in limiting the contagion. During the period of crisis, India had low current account deficit, comfortable foreign exchange reserves amounting to import cover of over seven months, a market determined exchange rate, low level of short-term debt, and absence of asset price inflation or credit boom. These positive features were the result of prudent policies pursued over the years notably, cap on external commercial borrowings with restrictions on end-use, low exposure of banks to real estate and stock market, insulation from large intermediation of overseas capital by the banking sector, close monitoring of off-balance sheet items and tight legislative, regulatory and prudential control over non-bank entities.
7.80 Uncertainty in the foreign exchange market surfaced again in May 2000 reflecting hardening of international oil prices, successive interest rate increases in industrial countries and the sharp reversals of portfolio flows. This resulted in widening of the excess demand gap in the spot segment of merchant transactions and compensating activity built up in the inter-bank segment. Tight monetary measures adopted during May-June 2000 coupled with inflows (US $ 5.5 billion) in respect of the India Millennium Deposits (IMDs) during October-November 2000 eased the market pressures. Financing through IMDs was resorted to as a preemptive step in the face of hardening of world petroleum prices and the consequent possible depletion of India’s foreign exchange reserves. The orderly conditions witnessed in the foreign exchange market since November 2000 continued thereafter. Accordingly, measures undertaken earlier such as the stipulation of minimum interest rate of 25 per cent on overdue export bills and interest rate surcharge of 50 per cent on import finance were withdrawn in January 2001.
7.81 In the aftermath of September 11, 2001 incident in the US, once again pressure was felt in the foreign exchange market as the Indian rupee depreciated against the US dollar, but the Reserve Bank tackled the situation through quick responses in terms of a package of measures and liquidity operations. These measures included: (i) a reiteration by the Reserve Bank to keeping interest rates stable with adequate liquidity; (ii) assurance to sell foreign exchange to meet any unusual supply-demand gap; (iii) opening a purchase window for select Government securities on an auction basis; (iv) relaxation in FII investment limits upto the sectoral cap/statutory ceiling; (v) a special financial package for large value exports of six select products; and, (vi) reduction in interest rates on export credit by one percentage point.
| Table 7.7: Movement of Currencies against US dollar @ | ||||||||||
| Appreciation (+)/Depreciation (-) | ||||||||||
| Currency per US $ | against US dollar (per cent) | |||||||||
| Country | 1993 | 1997 | 2000 | 2001 | 2002 | 2003 | 2003 | 2003 | 2003 | 2003 |
| over | over | over | over | |||||||
| 1997 | 2000 | 2001 | 2002 | |||||||
| 1 | 2 | 3 | 4 | 5 | 6 | 7 | 8 | 9 | 10 | 11 |
| Chinese Yuan | 5.80 | 8.28 | 8.28 | 8.28 | 8.28 | 8.28 | 0.0 | 0.0 | 0.0 | 0.0 |
| Euro | .. | .. | 1.07 | 1.13 | 0.95 | 0.81 | .. | 32.5 | 39.9 | 17.6 |
| Hong Kong Dollar | 7.73 | 7.75 | 7.80 | 7.80 | 7.80 | 7.76 | -0.2 | 0.4 | 0.4 | 0.4 |
| Indian Rupee | 31.38 | 39.27 | 46.75 | 48.18 | 48.03 | 45.61 | -13.9 | 2.5 | 5.6 | 5.3 |
| Indonesian Rupiah | 2,110.00 | 4,650.00 | 9,595.00 | 10,400.00 | 8,940.00 | 8,478.00 | -45.2 | 13.2 | 22.7 | 5.4 |
| Japanese Yen | 111.85 | 129.95 | 114.90 | 131.80 | 119.90 | 107.22 | 21.2 | 7.2 | 22.9 | 11.8 |
| Korean Won | 808.10 | 1,695.00 | 1,264.50 | 1,313.50 | 1,186.20 | 1,197.40 | 41.6 | 5.6 | 9.7 | -0.9 |
| Malaysian Ringgit | 2.70 | 3.89 | 3.80 | 3.80 | 3.80 | 3.80 | 2.4 | 0.0 | 0.0 | 0.0 |
| Mexican Peso | 3.11 | 8.08 | 9.57 | 9.14 | 10.31 | 11.23 | -28.0 | -14.8 | -18.6 | -8.2 |
| Philippines Peso | 27.70 | 39.98 | 50.00 | 51.40 | 53.10 | 55.50 | -28.0 | -9.9 | -7.4 | -4.3 |
| Pound Sterling | 0.68 | 0.60 | 0.67 | 0.69 | 0.62 | 0.57 | 6.1 | 17.6 | 21.0 | 8.9 |
| Singapore Dollar | 1.61 | 1.68 | 1.73 | 1.85 | 1.74 | 1.70 | -1.5 | 1.8 | 8.9 | 2.1 |
| Thailand Baht | 25.54 | 47.25 | 43.27 | 44.22 | 43.15 | 39.65 | 19.2 | 9.1 | 11.5 | 8.8 |
| @ : As at end-December. | .. : Not Available. | |||||||||
| Source : International Financial Statistics, IMF, 2003; The Economist. | ||||||||||
7.82 Except for a brief period of instability on account of border tensions in May 2002, the rupee generally exhibited appreciating trend against the US dollar during 2002-03 and 2003-04 (up to January 20, 2004) reflecting sustained excess supply position. During this period, the Reserve Bank has been absorbing excess supplies in the market. In fact, since 2001, most of the currencies worldwide, except for Chinese yuan, Mexican peso and Philippines peso have been appreciating against the US dollar (Table 7.7). The weakness of US dollar has been widespread against all the major as well as emerging market currencies. Reflecting cross-currency movements, the Indian rupee depreciated against other key currencies such as euro, yen and pound sterling (Table 7.8).
| Table 7.8: Movement of Rupee against Other Foreign Currencies@ | ||||||||||
| Rupees per foreign currency | Appreciation (+)/Depreciation (-) | |||||||||
| against Rupee (per cent) | ||||||||||
| Country | 1993 | 1997 | 2000 | 2001 | 2002 | 2003 | 2003 | 2003 | 2003 | 2003 |
| over | over | over | over | |||||||
| 1997 | 2000 | 2001 | 2002 | |||||||
| 1 | 2 | 3 | 4 | 5 | 6 | 7 | 8 | 9 | 10 | 11 |
| Chinese Yuan | 5.41 | 4.74 | 5.65 | 5.82 | 5.80 | 5.51 | -13.9 | 2.5 | 5.6 | 5.3 |
| Euro | .. | .. | 43.50 | 42.46 | 50.37 | 56.23 | .. | -22.6 | -24.5 | -10.4 |
| Hong Kong Dollar | 4.06 | 5.07 | 6.00 | 6.18 | 6.16 | 5.87 | -13.7 | 2.1 | 5.2 | 4.8 |
| Indonesian Rupiah * | 1.49 | 0.84 | 0.49 | 0.46 | 0.54 | 0.54 | 57.0 | -9.4 | -13.9 | -0.1 |
| Japanese Yen * | 28.06 | 30.23 | 40.69 | 36.56 | 40.06 | 42.54 | -28.9 | -4.4 | -14.1 | -5.8 |
| Korean Won * | 3.88 | 2.32 | 3.70 | 3.67 | 4.05 | 3.81 | -39.2 | -2.9 | -3.7 | 6.3 |
| Malaysian Ringgit | 11.62 | 10.09 | 12.30 | 12.68 | 12.64 | 12.00 | -15.9 | 2.5 | 5.6 | 5.3 |
| Mexican Peso | 10.10 | 4.86 | 4.88 | 5.27 | 4.66 | 4.06 | 19.6 | 20.2 | 29.7 | 14.7 |
| Philippines Peso | 1.13 | 0.98 | 0.94 | 0.94 | 0.90 | 0.82 | 19.6 | 13.8 | 14.1 | 10.1 |
| Pound Sterling | 46.48 | 64.96 | 69.76 | 69.88 | 77.41 | 80.05 | -18.9 | -12.9 | -12.7 | -3.3 |
| Singapore Dollar | 19.51 | 23.44 | 27.00 | 26.03 | 27.66 | 26.82 | -12.6 | 0.7 | -3.0 | 3.1 |
| Thailand Baht | 1.23 | 0.83 | 1.08 | 1.09 | 1.11 | 1.15 | -27.7 | -6.1 | -5.3 | -3.2 |
| @ : As at end-December. | .. : Not Available. | |||||||||
| * : Rs per 100 yen, 100 won & 100 rupiah respectively. | ||||||||||
| Source : International Financial Statistics, IMF, 2003; The Economist. | ||||||||||
| Table 7.9: REER and NEER of Select Asian Countries | ||||||||||
| (Index : 1995=100) | ||||||||||
| Country | 1990 | 1993 | 1995 | 1996 | 1997 | 1998 | 1999 | 2000 | 2001 | 2002 |
| 1 | 2 | 3 | 4 | 5 | 6 | 7 | 8 | 9 | 10 | 11 |
| Real Effective Exchange Rate (REER) | ||||||||||
| China | 117.0 | 82.6 | 100.0 | 109.7 | 116.9 | 119.2 | 115.3 | 118.2 | 123.4 | 121.4 |
| India | 138.5 | 97.8 | 100.0 | 101.1 | 103.5 | 95.6 | 94.6 | 98.5 | 99.8 | 95.7 |
| Japan | 68.4 | 89.5 | 100.0 | 85.2 | 81.1 | 75.7 | 86.4 | 93.3 | 83.2 | 76.6 |
| Malaysia | 98.7 | 103.7 | 100.0 | 104.4 | 103.2 | 82.0 | 84.3 | 86.4 | 91.2 | 91.3 |
| Philippines | 84.2 | 93.0 | 100.0 | 109.3 | 108.7 | 88.6 | 96.2 | 89.7 | 85.3 | 85.6 |
| Singapore | 89.1 | 94.7 | 100.0 | 103.5 | 105.4 | 101.6 | 95.1 | 95.2 | 96.0 | 93.8 |
| Nominal Effective Exchange Rate (NEER) | ||||||||||
| China | 173.8 | 111.8 | 100.0 | 104.2 | 111.1 | 116.2 | 113.7 | 116.8 | 122.0 | 121.0 |
| India | 199.6 | 114.0 | 100.0 | 98.5 | 98.6 | 87.2 | 84.6 | 84.1 | 83.5 | 78.4 |
| Japan | 64.7 | 88.3 | 100.0 | 86.8 | 81.7 | 76.5 | 89.4 | 99.5 | 89.8 | 85.2 |
| Malaysia | 90.7 | 100.8 | 100.0 | 103.1 | 100.3 | 77.1 | 78.0 | 80.0 | 84.7 | 84.0 |
| Philippines | 94.5 | 94.5 | 100.0 | 102.1 | 98.4 | 74.8 | 76.7 | 69.8 | 63.6 | 62.5 |
| Singapore | 84.9 | 93.4 | 100.0 | 104.7 | 107.3 | 106.7 | 101.2 | 101.6 | 103.0 | 102.1 |
| Note | : Rise in index implies appreciation. | |||||||||
| Source | : International Financial Statistics, IMF 2003; For India, Reserve Bank of India and data pertain to 5 country trade-based index on financial year basis | |||||||||
7.83 The movements in cross currency exchange rates can be better analysed through nominal and real effective exchange rate indices. The index of real effective exchange rate (REER) attempts to capture weighted variations in the nominal exchange rate with the economy’s major trading partners adjusted for inflation differentials. Accordingly, variations in the REER provide a measure of external price competitiveness for local exports. Several caveats are in order: first, employing the REER as an indicator of competitiveness is best done in a world with no barriers to trade or capital flows; second, there is certain arbitrariness with respect to selection of the base year, weights and prices. Hence, the use of REER could be best suited to track the movement of currency over a period of time, rather than exchange rate levels at any particular point of time. The REER of India has been relatively stable compared to other key Asian countries (Table 7.9).
7.84 As noted above, an important aspect of policy response to various episodes of volatility has been monetary tightening. This raises the issue of its efficacy. Econometric evidence in the Indian context indicates that monetary policy tightening measures have been successful in restoring orderly conditions in the foreign exchange market (Pattanaik and Mitra, 2002; Pattnaik, Kapur and Dhal, 2003). In a vector autoregression (VAR) framework, both these studies find that increase in interest rates had the expected effect of strengthening the exchange rate in the short-run; over time, however, the effect peters out, consistent with the theory. Furthermore, empirical assessment suggests that intervention operations of the Reserve Bank have been effective in containing exchange rate volatility of the rupee, even though the degree of influence may not appear to be very strong (Pattanaik and Sahoo, 2001).
7.85 The above analysis brings out the Reserve Bank’s endeavour to manage volatility in the foreign exchange market. The need to focus on managing volatility is borne out by empirical analysis which indicates that heightened volatility in the foreign exchange markets leads to a depreciating pressure on the rupee (Box VII.1).
7.86 The message that comes out from this discussion of various episodes of volatility of exchange rate of the rupee and the policy responses thereto is clear: flexibility and pragmatism are the order of the day in exchange rate policy in developing countries, rather than adherence to strict theoretical rules. It also underscores the need for central banks to keep instruments/policies in hand for use in difficult situations.
7.87 The recent experience has highlighted the need for developing countries to keep a continuous vigil on market developments, and the importance of building adequate safety nets that can withstand the effects of unexpected shocks and market uncertainties. Against this background, India’s exchange rate policy of focusing on managing volatility with no fixed rate target while allowing the underlying demand and supply conditions to determine the exchange rate movements over a period in an orderly way has stood the test of time. The Reserve Bank continues to follow the same
Box VII.1
Cross-Currency Impact on Volatility of the Indian Rupee
Using daily data on the exchange rate during the period Januar y 1995 to October 2003, an exercise was undertaken to examine the impact of time varying cross-currency volatility on the Indian Rupee using exponential GARCH (EGARCH) model. The sample standard deviation or variance which measures unconditional volatility was the highest for Japanese yen-US dollar pair followed by Indian rupee-US dollar pair, while the same for Pound sterling and euro area currencies were comparatively low. The bi-variate correlation between the Indian rupee and the US dollar and other cross currency exchange rates in respect of Pound sterling, Japanese yen, Deutsche mark, French franc and Singapore dollar against the US dollar indicated that all major cross-exchange rates have significant effect on volatility of the Indian rupee with a lag of a few days. The effects of Japanese yen, Pound sterling and Singapore dollar turned out to be sharper than that of Deutsche mark and French franc. The conditional volatility term was low but statistically significant in the mean or return equation, implying successful management of volatility in the exchange rate by the Reserve Bank. This provides some evidence in support of risk and return trade-off hypothesis. For every 10 per cent increase in volatility, the exchange rate depreciates by one per cent. The estimated model suggests a significant asymmetry in the volatility response due to market pressure, underscoring the importance of intervention by the central bank to manage the volatility. The experience of managing the exchange rate during the crisis period clearly points out that in adverse circumstances, the need for intervention by the central bank is felt more by the market than otherwise. approach of watchfulness, caution and flexibility in regard to foreign exchange market. It co-ordinates its market operations carefully, particularly in regard to the foreign exchange market with appropriate monetary, regulatory and other measures as considered necessary from time to time. The conduct of exchange rate policy in India is guided currently by three major purposes. First, to maintain orderly conditions in the foreign exchange market by providing foreign exchange as considered necessary from time to time, and to prevent the emergence of destabilising and self-fulfilling speculative activities. Second, to help maintain an adequate level of foreign exchange reserves. Third, to help eliminate market constraints with a view to facilitating the development of a healthy foreign exchange market. International research on viable exchange rate strategies in emerging markets has also lent considerable support to the exchange rate policy followed by India. A leading global news agency, in an international journal, has recently described India’s currency model as being ‘‘ideal’’ for Asia (Jalan, 2003b).
Developing the Indian Foreign Exchange Market
7.88 The Indian market is not yet very deep and broad, and is characterised by uneven flow of demand and supply over different periods. The market is also characterised by a few major players, and lumpy public sector demands, particularly on account of payments for oil imports and servicing of public debt. In this situation, the Reserve Bank has been prepared to make sales and purchases of foreign currency in order to even out lumpy demand and supply in the relatively thin foreign exchange market and to smoothen jerky movements. However, such interventions are not governed by a predetermined target or band around the exchange rate.
7.89 With the institution of the market determined exchange rate in March 1993 and large capital inflows during 1993-95, the Reserve Bank has undertaken several measures to widen and deepen the foreign exchange market (Box VII.2). At present, there are 92 banks authorised to deal in foreign exchange, referred to as Authorised Dealers (ADs). Of these, most foreign banks and bigger Indian banks actively quote two-way prices. The banks deal among themselves directly or through the foreign exchange brokers presently numbering 47. Besides banks, term lending institutions have been given restricted dealing licences. Foreign Exchange Dealers Association of India (FEDAI) sets ground rules for fixation of commercial and other charges and involves itself in matters of mutual interest of ADs. The market trades freely in spot and forward exchange contracts, and to a limited extent in derivatives. The efficiency/liquidity of the market is often gauged in terms of bid/offer spreads. Wider spreads are an indication of an illiquid or a one-way market. In India, the normal spot market quote has a spread of 0.25 to 0.50 paise while swap quotes are available at 1 to 2 paise spread.
7.90 The total turnover in the foreign exchange market has been showing an increasing trend over the years. The average daily total turnover (merchant plus inter-bank) increased sharply to US $ 8.0 billion in 2003-04 (up to December) from US $ 1.9 billion in 1990-91. The average daily merchant turnover increased from a meagre US $ 0.2 billion in 1990-91
Box VII.2
Measures Undertaken to Develop the Indian Foreign Exchange Market
The Indian foreign exchange market has come a long way since the period prior to 1978 when banks were required to maintain square position at all points of time. The important measures undertaken to broaden and deepen the foreign exchange market are as follows:
General
• March 1992: The exchange rate of rupees was partially floated in March 1992 with the introduction of LERMS.
• March 1993: Unified exchange rate was introduced.
• August 1993: Direct quotation system was introduced
• July 1995: In order to ensure that the exchange rate of the rupee reflected fully the demand supply situation and in furtherance of the move towards eliminating transactions through reserves, it was decided to route government debt service payment (civil) through the market.
• October 1995: With a view to minimising the influence on the process of rate formation, the Reserve Bank discontinued quoting its buying and selling rate.
Relaxation for Banks
• September 1995: As against overnight limit of Rs.15 crore, banks were given freedom to fix their own open exchange position limit and apply to the Reserve Bank for approval. The revised limits became operative from January 1996.
• April 1996: Depending upon the asset liability profile, dealing expertise and such other relevant factors, the ADs were accorded freedom to fix their own gap limits for more efficient management of their assets and liabilities subject to the Reserve Bank approval. The banks which are permitted higher limits should be in a position to mark to market their gaps on a daily basis using value at risk models.
• April 1996: The banks which had put in place adequate risk management systems were permitted to freely trade in the overseas markets, subject to the overall position/gap discipline.
• October 1996: Banks were permitted to provide foreign currency denominated loans to their customers out of the pool of FCNR(B) deposits.
• April 1997: Cash reserve requirements on inter-bank borrowings were removed.
• April 1997: The Reserve Bank permitted banks to borrow and invest in the overseas markets. At present, banks are permitted to borrow up to 25 per cent of Tier I capital and invest up to any amount .
Relaxation for Corporates
• April 1992: EEFC scheme was introduced. Currently, exchange earners in select categories are permitted to retain 100 per cent of foreign exchange receipts in foreign currency accounts, while all others are permitted to retain 50 per cent.
• September 1996: Corporates were accorded greater freedom to undertake active hedging. They were given freedom to choose the currency of hedge irrespective of the currency of the exposure.
• September 1996: Corporates were given complete freedom to book and cancel cross currency options.
Besides, several measures have been undertaken to develop the forward market. The participants in the forward market have increased considerably. Several instruments have been introduced to hedge exposures.
to US $ 1.8 billion in 2003-04. The average inter-bank turnover also increased from US $ 1.7 billion in 1990-91 to US $ 6.2 billion in 2003-04. Reflecting these trends, the inter-bank to merchant turnover ratio has declined from 8.5 in 1990-91 to 3.4 in 2003-04. 7.91 With many countries switching over from fixed exchange rate regimes to flexible exchange rate regimes, management of foreign currency exposure has assumed a critical importance. Unchanged nominal exchange rate amounts to giving implicit or explicit exchange guarantee to market players which may prevent them from taking cover for their exposures. Experience suggests that large unhedged exposures of the corporates and a possible sudden rush for covering exposures could give rise to destabilising expectations, which may, at times result
in self-fulfilling corrections or ‘overshooting’. In the aftermath of the Asian crisis, the Reserve Bank has been expressing concern over unhedged foreign currency borrowings by corporates. In recent period, a large portion of the corporate foreign currency commitments has been found to be kept unhedged. This could impact the overall financial status of the corporate balance sheets, possibly impacting the quality of banks’ assets in some cases. The Reserve Bank felt that it was desirable for banks which have large exposures to such corporates to put in place a system for monitoring such unhedged external exposures. Over a period, considerable flexibility has been given to the corporates, banks, and nonresidents to hedge their foreign exchange exposure in the market (Box VII.3)
Box VII.3
Hedging for Foreign Currency Exposure: Current Position
Hedging Facilities for Residents
• March 1992: Residents in India were permitted to enter into a forward contract with an authorised dealer (AD) to hedge an exposure to exchange risk in respect of a transaction for which sale and/or purchase of foreign exchange is permitted subject to certain terms and conditions. Currently, forward contracts booked in respect of foreign currency exposures of residents falling due within one year may be freely cancelled and rebooked, among other stipulations.
• September 1996: Residents in India were permitted to enter into a foreign currency option contract with an AD in India to hedge foreign exchange exposure arising out of his trade, provided that in respect of cost effective risk reduction strategies like range forwards and ratio-range forwards, there is no net inflow of premium. Cross currency options should be written on a fully covered back-to-back basis. At present, the cover transaction may be undertaken with a bank outside India, an off-shore banking unit situated in a Special Economic Zone or an internationally recognised option exchange or another AD in India.
• April 1997: Residents who owe a foreign exchange or rupee liability, may enter into a contract for foreign currency-rupee swap with an AD in India to hedge long term exposure under certain terms and conditions.
• October 1997: Residents who have borrowed foreign exchange were permitted to enter into an interest rate swap or currency swap or coupon swap or foreign currency option or interest rate cap or collar (purchases) or forward rate agreement (FRA) contract with an AD in India or with a branch outside India of an AD for hedging loan exposure and unwinding from such hedges. The contract, however, should not involve the rupee and maturity of the hedge should not exceed the unexpired maturity of the underlying loan besides other conditions.
• September 1998: Residents in India, engaged in import and export trade, may hedge the price risk of all commodities except crude oil and petroleum products. Hedging of price risk on these products was also permitted with effect from September 2000 in the international commodity exchanges/ markets.
• April 2003: ADs were permitted to enter into forward contracts with residents in respect of transactions denominated in foreign currency but settled in Indian rupees. These contracts shall be held till maturity and cash settlement would be made on the maturity date by cancellation of the contracts.
• July 2003: Foreign currency-rupee options were introduced. ADs were permitted to offer the product on back to back basis or run an option book as per the specified terms and conditions.
• December 2003: Residents having overseas direct investments were permitted to hedge the exposure under certain terms and conditions.
Hedging Facilities for Authorised Dealers (ADs)
• January 1997: ADs were permitted to use certain instruments like interest rate swaps, currency swaps, and forward rate agreements to hedge their assets-liability portfolio based on appropriate policy as approved by their top management.
• April 1997: A beginning for rupee based derivatives was made in India and banks were permitted to offer dollar-rupee swaps to corporates to actively manage their foreign exchange exposures. Currently no limits are placed on the ADs for undertaking swaps to facilitate corporates to hedge their foreign exchange exposures; a limit of US $ 50 million per AD is, however, fixed for net supply in the market on account of swaps enabling corporates to move from rupee to foreign currency liability.
• October 1999: ADs may also purchase call or put options to hedge their cross currency proprietary trading positions. The value and maturity of the hedge should not exceed that of the underlying instrument.
• October 2002: Authorised banks were permitted to enter into forward contracts with their constituents (exporters of gold products, jewellery manufacturers, trading houses, etc.) in respect of the underlying sale, purchase and loan transactions in gold.
• November 2002: Banks, which are allowed to enter into forward gold contracts in India were allowed to cover their price risk by hedging abroad in a similar manner.
• November 2002: Foreign banks were allowed to hedge the entire Tier I capital held by them in Indian books. The capital funds should be available in India to meet local regulatory and CRAR requirements. The forward contract should be for tenor of one year or more and may be rolled over on maturity. Foreign banks were permitted to hedge their Tier II capital in the form of Head Office borrowing as subordinated debt, by keeping it swapped into Indian rupees at all times.
Hedging Facilities for Non-Residents
• October 1997: ADs were allowed to enter into forward/option contracts with NRIs to hedge (i) the amount of dividend due on shares held in an Indian company; (ii) the amount of investment made under portfolio scheme in accordance with the relevant provisions for the purpose; and (iii) the balances held in the Foreign Currency Non-Resident (FCNR) account or the Non-Resident External Rupee (NRE) account.
• November 2002: Earlier, designated branches of ADs maintaining accounts of FIIs could provide forward cover under certain terms and conditions and limits. Currently, ADs can provide forward/option contracts to FIIs with rupee as one of the currencies to such customers on the basis of their declaration of the market value of their entire investment in equity and/or debt in India as on a particular date. The cost of hedge is to be met out of repatriable funds and /or inward remittance through normal banking channel. If the hedge becomes naked, the hedge may be allowed to continue to the original maturity.
• October 2003: Earlier, entities with foreign direct investment in India had to approach the Reserve Bank for case by case approval to hedge their investment. This has now been delegated to ADs who may enter into forward/option contracts with residents outside India to hedge the foreign direct investments made in India subject to verification of the exposure in India. All foreign exchange derivative contracts permissible for a person resident outside India once cancelled, are not eligible to be rebooked.
Foreign Exchange Market Efficiency: Interest Parity Conditions
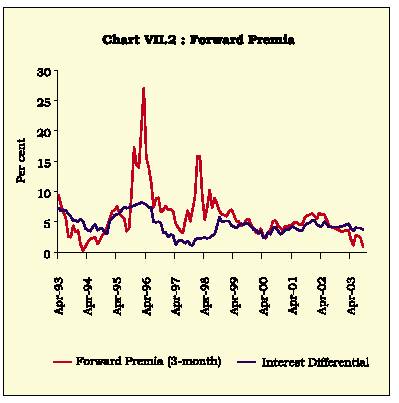
7.92 As noted above, a number of steps have been taken to develop the Indian foreign exchange market. These measures are expected to increase the foreign exchange market efficiency. In recent months, however, forward premia in India have trailed below the interest differentials, renewing interest in foreign exchange market efficiency (Chart VII.2). In an efficient speculative market, prices should fully reflect all available information, leaving no scope for excess returns from speculation. Foreign exchange market efficiency is usually examined through analysis of the twin parity conditions - covered and uncovered parity. According to covered interest parity (CIP) condition, forward premia/discount should equal interest rate differentials between home currency and foreign currency assets. According to uncovered interest parity (UIP) condition, the currency with a higher interest rate is expected to depreciate. The interest parity hypotheses are important from a policy perspective, especially in the context of the effectiveness of sterilised foreign exchange market intervention by central anks as well as that of interest rate defence of the exchange rate. Intervention as well as interest rate defence are effective only if there are policy-exploitable deviations from the UIP (Isard, 1995; Flood and Rose, 2002). Analysis of these parity conditions provides a measurement of the extent of the market integration and efficiency.
7.93 Available empirical evidence in regard to advanced economies suggests that CIP generally holds for assets of similar maturity and similar risk profile although profitable arbitrage opportunities appear for longer maturities (Sarno and Taylor, 2002). As regards UIP, empirical evidence overwhelmingly rejects UIP.2 The failure of UIP has been attributed, inter alia, to a number of factors such as time-varying risk premium, deviations from rational expectations (since tests of UIP involve a joint test of efficient market hypothesis and rational expectations) and transaction costs. UIP failure could also be due to its implicit assumption that any variable affects exchange rate only indirectly through interest rates. In practice, many macroeconomic developments get reflected directly in exchange rates without appearing to affect interest rates and there is a need to augment the simple UIP with these macroeconomic determinants of the exchange rate (Wadhwani, 1999).
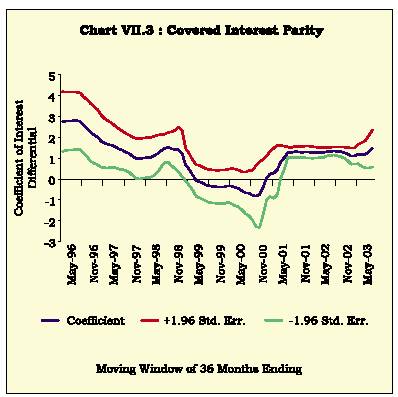
7.94 An empirical examination of these parity conditions for India is undertaken using monthly data over the period April 1993 to September 2003. The exercise focuses on 3-month forward premia. Interest differential between domestic and foreign interest rates is measured using instruments of comparable maturity and risk, viz., 3-month Treasury bill yields for India and the US. As regards CIP, forward premia is found to be positively related to contemporaneous interest differential as expected.3 Rolling estimates suggest that the coefficient on interest differential has been more stable in the recent 3-4 years indicative of growing integration with external markets (Chart VII.3).
7.95 The UIP is a joint hypothesis of rational expectations and market efficiency. In the absence of data on expected exchange rate, the usual approach
 is to assume that expectations are rational and the expected exchange rate is replaced by actual exchange rate. With actual exchange rate as the dependent variable, the coefficient of interest differential turns out to be positive but insignificant as against a priori expectations of unity.4 The recursive estimates show that the point estimate is mostly negative and even statistically significant during some periods (Chart VII.4). This finding is in line with the overwhelming international evidence. The residuals in all the estimated equations turn out to be serially correlated, again indicative of market inefficiency. The failure to reject the null hypothesis could reflect the use of actual depreciation vis-à-vis expected depreciation as well as the endogeneity between interest rates and exchange rates. The results, however, do not change even when model-based expected exchange rate and instrument variables are used (Pattnaik, Kapur and Dhal, 2003). Broadly, the results are in line with the international evidence.
7.96 Another testable implication of UIP is that there should not be any systematic excess returns in an efficient foreign exchange market, i.e., expected excess returns (interest rate differential less capital gains/losses from exchange rate movements) should

be a white noise process. Over the sample period, the excess return measure is not statistically significant and is also found to be stationary. This indicates no systematic and predictable excess returns in the Indian foreign exchange market.
7.97 Overall, the empirical evidence shows that over the medium-term, forward premia and interest differentials move together; in the shor t-run, deviations from CIP arise due to demand-supply mismatches. In the Indian context, the measures that have been taken to enhance the depth of the foreign exchange market are expected to impart greater efficiency to the foreign exchange market by integrating domestic financial markets with international financial markets. Absence of sustained predictable excess returns supports market efficiency. Short-run deviations from UIP indicate that sterilised foreign exchange market intervention and monetary tightening can be effective in ensuring orderly conditions.
7.98 To sum up, the choice of an exchange rate regime is a complex issue. The weight of experience, however, seems to be clearly in favour of intermediate regimes with country-specific features with advocates of corner solutions on a decline. The choice of the exchange rate regimes in developing countries reveals a preference for flexible exchange rates along with interventions to ensure orderly market activity, but without targeting any level of the exchange rate. It is also believed that reserves should at least be sufficient to take care of fluctuations in capital flows and liquidity at risk. This would act as a circuit breaker for situations when unidirectional expectations become self-fulfilling.
7.99 For the majority of developing countries, which are labour-intensive exporters, exchange rate volatility has had significant employment, output and distributional consequences, which can be large and persistent. India’s exchange rate policy of focusing on managing volatility with no fixed rate target, while allowing the underlying demand and supply conditions to determine the exchange rate movements over a period in an orderly way, has stood the test of time. It needs to be recognised that most developing countries are engaged in the process of development and integration of financial markets. Consequently, signals from the market get blurred by the degree of management which is unavoidable in this transition.
III. EXTERNAL DEBT MANAGEMENT
7.100 The growing volume of international capital flows consequent upon capital account liberalisation has increased the vulnerability of economies, making it imperative to monitor the debt related indicators. Monitoring short-term debt along with debt of the private sector have been emphasised in the aftermath of the Asian crisis. It is increasingly felt that sound debt management practices that include risk management are necessary to avoid a build-up of unmanageable debt profiles. In its absence, the macroeconomic consequences and the output losses and costs of a sovereign default could be severe.
7.101 The build-up of debt in the developing countries during the 1970s emanating from the two oil shocks unfolded its effects in the 1980s with rise in interest rates. In the decade of 1990s, a series of financial crises in Mexico (1994), East Asia (1997), Brazil (1998), Russia (1998), Turkey (2001) and Argentina (2001) led to a reassessment of the policies towards management of external debt. The crises demonstrated that the major objective of sound debt management policy could be to achieve or maintain debt sustainability, while meeting key economic development goals. In order to assess the sustainability of debt, a number of parameters, viz., the outstanding level of debt along with the nature of indebtedness of the country in terms of concessionality, maturity and share of public and private sector debt in total debt needs to be taken into account.
7.102 An analysis of the outstanding level of indebtedness of the top 15 debtor countries indicates that during the 1990s, external debt nearly trebled for Korea, China, Malaysia and Russian Federation and almost doubled for Argentina, Brazil, Chile, Colombia, Indonesia and Turkey. In Mexico and Poland, external debt during the same period rose by 52 and 28 per cent, respectively; in the case of India, the rise was modest at 18 per cent (World Bank, 2003) (Table 7.10).
7.103 Concessional debt as a percentage of total debt has declined sharply for almost all the 15 countries between 1980 and 2001 pointing towards increasing importance of external borrowings from private sources at commercial terms. Although the proportion of concessionality in India’s debt has also declined, it still remains the highest among the top indebted nations. Most of the total external debt incurred by each of the top 15 debtor countries is public and public guaranteed debt (PPG). This is highest for India followed by Argentina and the Russian Federation. While the proportion of PPG to total debt has declined for most of the countries, it has increased for countries like Argentina and Philippines during the period 1980-2001 (Table 7.11).
| Table 7.10: Total External Debt Outstanding | |||||||
| (US $ billion) | |||||||
| Country | 1970 | 1980 | 1990 | 1997 | 1998 | 2000 | 2001 |
| 1 | 2 | 3 | 4 | 5 | 6 | 7 | 8 |
| Argentina | 5.8 | 27.2 | 62.2 | 128.4 | 141.5 | 145.9 | 136.7 |
| Brazil | 5.7 | 71.5 | 120.0 | 198.0 | 241.0 | 238.8 | 226.4 |
| Chile | 3.0 | 12.1 | 19.2 | 22.8 | 30.2 | 37.0 | 38.4 |
| China | .. | .. | 55.3 | 146.7 | 144.0 | 145.7 | 170.1 |
| Colombia | 2.2 | 6.9 | 17.2 | 31.9 | 33.1 | 33.9 | 36.7 |
| India | 8.4 | 20.7 | 83.8 | 93.5 | 96.9 | 101.1 | 98.8 |
| Indonesia | 4.5 | 20.9 | 69.9 | 136.2 | 151.2 | 144.1 | 135.7 |
| Korea, Rep. | 2.6 | 29.5 | 35.0 | 137.1 | 139.3 | 128.4 | 110.1 |
| Malaysia | 0.5 | 6.6 | 15.3 | 47.2 | 42.4 | 41.8 | 43.4 |
| Mexico | 7.0 | 57.4 | 104.4 | 148.7 | 159.9 | 158.5 | 158.3 |
| Philippines | 2.2 | 17.4 | 30.6 | 45.7 | 48.3 | 50.4 | 52.4 |
| Poland | .. | .. | 49.4 | 40.4 | 55.5 | 63.3 | 62.4 |
| Russian | |||||||
| Federation | .. | .. | 59.3 | 128.1 | 178.3 | 160.1 | 152.6 |
| Thailand | 1.0 | 8.3 | 28.1 | 109.7 | 104.9 | 79.7 | 67.4 |
| Turkey | 2.7 | 19.1 | 49.4 | 84.8 | 97.1 | 118.3 | 115.1 |
| .. : Not Available | |||||||
| Source: Global Development Finance, World Bank, 2003. For India, | |||||||
| Reserve Bank of India. | |||||||
| Table 7.11: Nature of Indebtedness | ||||||||
| (Per cent) | ||||||||
| Concessional to | PPG@ to Total | |||||||
| Total Debt Ratio | Debt | |||||||
| Country | 1980 | 1990 | 2000 | 2001 | 1980 | 1990 | 2000 | 2001 |
| 1 | 2 | 3 | 4 | 5 | 6 | 7 | 8 | 9 |
| Argentina | 1.3 | 0.8 | 1.2 | 1.0 | 37.5 | 75.3 | 77.1 | 75.1 |
| Brazil | 2.5 | 2.5 | 0.9 | 1.2 | 57.9 | 73.2 | 39.1 | 41.3 |
| Chile | 5.6 | 1.9 | 1.0 | 0.9 | 38.9 | 54.2 | 14.1 | 14.5 |
| China | .. | 17.6 | 19.0 | 15.4 | .. | 82.3 | 65.1 | 53.9 |
| Colombia | 14.2 | 5.7 | 2.8 | 2.4 | 58.9 | 85.2 | 61.3 | 59.3 |
| India | 74.2 | 45.9 | 35.5 | 36.0 | 87.5 | 84.9 | 83.9 | 85.0 |
| Indonesia | 36.4 | 26.4 | 21.0 | 20.7 | 71.7 | 68.7 | 48.2 | 50.4 |
| Korea, Rep. | 9.5 | 12.6 | 1.2 | 0.3 | 54.0 | 53.7 | 33.6 | 30.6 |
| Malaysia | 8.6 | 14.6 | 7.0 | 7.3 | 60.6 | 75.6 | 45.7 | 55.5 |
| Mexico | 0.5 | 0.8 | 0.7 | 0.7 | 59.1 | 72.7 | 56.6 | 54.5 |
| Philippines | 5.5 | 20.0 | 24.9 | 21.3 | 36.5 | 78.6 | 67.0 | 65.3 |
| Poland | .. | 7.7 | 10.7 | 9.9 | .. | 79.5 | 48.7 | 39.8 |
| Russian | ||||||||
| Federation | .. | 0.0 | 0.0 | 0.0 | .. | 80.1 | 69.4 | 66.8 |
| Thailand | 10.0 | 15.2 | 11.5 | 12.6 | 47.5 | 44.4 | 36.9 | 39.2 |
| Turkey | 20.4 | 15.1 | 4.3 | 3.5 | 78.6 | 78.6 | 48.5 | 48.6 |
| @ : Public and publicly guaranteed debt. | .. : Not Available | |||||||
| Source: | Global Development Finance, World Bank, 2003. For India, Reserve Bank of India. | |||||||
7.104 While indebtedness is useful as an indicator of the level of debt burden of a country, it is the debt servicing capacity of the country that is critical. It determines not only the country’s ability to meet its debt obligations, but also its chance of default. Difficulties in servicing of debt may arise from liquidity as well as insolvency problems. Accordingly, the sustainable level for a country’s external debt is determined in terms of a set of solvency and liquidity indicators.
7.105 From a national perspective, solvency can be defined as the country’s ability to discharge its external obligations on a continuing basis. In order to remain solvent, the debtor country’s economy in the first place must be able to do without an amount of domestic income and savings equivalent to the debt service. Second, the debtor country must be in a position to convert such segregated savings into the required foreign exchange. If the debt servicing is increasing, there must be an increase in both the capacity to save and the capacity to transfer savings. The analysis of debt servicing capacity of a country over time, therefore, requires an examination of the performance of debtor countries in generating income and savings and increasing foreign trade. Not surprisingly, ratio of external debt to exports, external debt to national income, debt service ratio and interest service ratio have evolved as some of the most common solvency indicators.
7.106 Debt to exports ratio can be measured as an indicator of solvency, since an increasing debt to exports ratio indicates that the country may have problems meeting its debt obligations in future. While for most of the Latin American countries, the ratio of total debt to current receipts has remained high during the 1990s, the ratio has declined sharply for countries like India, China, Mexico and Philippines indicating an improvement in debt-servicing capacity. Furthermore, the debt to national income ratio provides some indication of the potential to service external debt by switching resources from production of domestic goods to the production of exports. Although, India and China have maintained a low debt to output ratio, the same has been very high for many of the EMEs. Indonesia has the highest debt to output ratio followed by Turkey, Philippines, Thailand and Chile (Table 7.12).
7.107 In terms of other solvency indicators, the ratio of debt-service payments to exports of goods and services indicates how much of a country’s export revenue will be used up in servicing its debt. The Latin American countries have very high debt service ratios,
| Table 7.12: Solvency Indicators: Debt to Current Receipts and National Income Ratios | ||||||||
| (Per cent) | ||||||||
| External Debt to | External Debt to | |||||||
| Current Receipts Ratio@ | National Income Ratio | |||||||
| Country | 1980 | 1990 | 2000 | 2001 | 1980 | 1990 | 2000 | 2001 |
| 1 | 2 | 3 | 4 | 5 | 6 | 7 | 8 | 9 |
| Argentina | 242.4 | 373.7 | 377.6 | 373.7 | 35.6 | 46.0 | 52.7 | 52.5 |
| Brazil | 306.6 | 325.5 | 345.1 | 314.4 | 31.5 | 26.5 | 41.5 | 46.9 |
| Chile | 192.5 | 179.6 | 150.7 | 162.6 | 45.5 | 67.3 | 50.6 | 60.0 |
| China | .. | 91.4 | 49.8 | 54.9 | .. | 15.2 | 13.7 | 15.0 |
| Colombia | 117.1 | 181.0 | 187.9 | 210.6 | 20.9 | 45.1 | 42.2 | 46.2 |
| India | 141.7 | 328.9 | 127.5 | 121.6 | 11.4 | 28.7 | 22.4 | 21.0 |
| Indonesia | .. | 233.9 | 194.0 | 205.9 | 28.0 | 64.0 | 102.0 | 97.2 |
| Korea, Rep. | 133.7 | 45.6 | 60.3 | 58.5 | 47.8 | 13.8 | 28.0 | 26.1 |
| Malaysia | 44.6 | 44.4 | 36.5 | 41.6 | 27.5 | 36.4 | 52.7 | 54.4 |
| Mexico | 232.4 | 191.4 | 82.2 | 85.5 | 30.4 | 41.1 | 28.0 | 26.2 |
| Philippines | 212.4 | 230.1 | 102.4 | 125.1 | 53.7 | 69.4 | 63.8 | 69.2 |
| Poland | .. | 251.3 | 128.6 | 113.5 | .. | 88.8 | 40.5 | 35.7 |
| Russian | ||||||||
| Federation | .. | .. | 133.1 | 128.0 | .. | 10.3 | 64.3 | 50.9 |
| Thailand | 96.8 | 89.8 | 92.7 | 84.2 | 25.9 | 33.3 | 67.1 | 60.4 |
| Turkey | 333.1 | 196.1 | 202.0 | 205.7 | 26.6 | 32.5 | 58.9 | 78.8 |
| @ : Current receipts include exports of goods and services (including | ||||||||
| workers’ remittances). | .. : Not Available. | |||||||
| Source : | Global Development Finance, World Bank, 2003. For India, | |||||||
| Reserve Bank of India. | ||||||||
reflecting heavy burden of amortisation and interest payments. The ratio became very high for India in the early 1990s, when its external debt became unsustainable and the country faced a severe balance of payments crisis. The debt service ratio for India has steadily improved thereafter. Furthermore, the ratio of average interest payments to export earnings indicates terms of external indebtedness and thus the debt burden. While this ratio has declined for most of the top 15 debtor countries since 1990 indicating thereby a reduction in the burden on interest payments, it has increased for countries like Argentina and Brazil reflecting stringent terms of debt contracts (Table 7.13).
7.108 Apart from the solvency factor, the other factor that has acquired greater bearing on debt servicing capacity of a country in the aftermath of the Asian financial crisis is the liquidity position of the country. Liquidity problems arise when there is a shortage of liquid assets to discharge immediate external obligations and could be independent of solvency problem. Liquidity problems can be triggered by a sharp drop in export earnings or an increase in interest rates or an increase in prices for imports. The currency and interest rate composition of debt, the maturity structure of debt, and the availability of assets to pay debts are all important determinants of the vulnerability of the economy to external liquidity crisis. The ratio of short term debt to total outstanding debt and the ratio of international reserves to short term debt
| Table 7.13: Solvency Indicators: Debt and Interest Service Ratios | ||||||||
| (Per cent) | ||||||||
| Debt Service Ratio | Interest Service Ratio | |||||||
| Country | 1980 | 1990 | 2000 | 2001 | 1980 | 1990 | 2000 | 2001 |
| 1 | 2 | 3 | 4 | 5 | 6 | 7 | 8 | 9 |
| Argentina | 37.3 | 37.0 | 70.8 | 66.3 | 20.8 | 16.3 | 30.1 | 29.9 |
| Brazil | 63.3 | 22.2 | 93.6 | 75.4 | 33.9 | 6.1 | 24.7 | 23.6 |
| Chile | 43.1 | 25.9 | 25.1 | 28.1 | 19.0 | 16.7 | 9.1 | 8.3 |
| China | .. | 11.7 | 9.3 | 7.8 | .. | 5.4 | 2.4 | 2.5 |
| Colombia | 16.0 | 40.9 | 28.3 | 36.1 | 11.6 | 17.9 | 12.2 | 15.3 |
| India | 9.8 | 35.3 | 17.2 | 13.9 | 4.4 | 15.5 | 6.6 | 5.4 |
| Indonesia | .. | 33.3 | 22.5 | 23.6 | .. | 13.3 | 9.9 | 8.9 |
| Korea, Rep. | 20.2 | 10.8 | 10.9 | 13.8 | 13.0 | 3.4 | 2.7 | 2.8 |
| Malaysia | 6.3 | 12.6 | 5.6 | 6.0 | 4.0 | 3.4 | 2.0 | 2.1 |
| Mexico | 44.4 | 20.7 | 30.3 | 26.1 | 24.6 | 13.4 | 7.0 | 6.9 |
| Philippines | 26.6 | 27.0 | 13.7 | 18.6 | 18.2 | 13.3 | 5.5 | 6.7 |
| Poland | .. | 4.9 | 20.8 | 28.0 | .. | 1.7 | 5.2 | 5.0 |
| Russian | ||||||||
| Federation | .. | .. | 9.8 | 14.5 | .. | .. | 4.7 | 6.6 |
| Thailand | 18.9 | 16.9 | 16.3 | 25.1 | 9.5 | 6.5 | 5.6 | 4.1 |
| Turkey | 28.0 | 29.4 | 35.4 | 40.0 | 14.9 | 13.5 | 11.7 | 11.1 |
| .. : Not Available | ||||||||
| Source : | Global Development Finance, World Bank, 2003. For India, | |||||||
| Reserve Bank of India. | ||||||||
| Table 7.14: Liquidity Indicators: Short-Term Debt Ratios | ||||||||
| (Per cent) | ||||||||
| Short-Term Debt to | Short-Term Debt to | |||||||
| Total Debt Ratio | Reserves | @ Ratio | ||||||
| Country | 1980 | 1990 | 2000 | 2001 | 1980 | 1990 | 2000 | 2001 |
| 1 | 2 | 3 | 4 | 5 | 6 | 7 | 8 | 9 |
| Argentina | 38.2 | 16.8 | 19.4 | 14.6 | 154.5 | 228.1 | 112.6 | 137.4 |
| Brazil | 18.9 | 19.8 | 13.0 | 12.5 | 234.7 | 318.7 | 95.3 | 79.1 |
| Chile | 21.2 | 17.6 | 6.8 | 6.7 | 82.0 | 55.7 | 16.8 | 17.8 |
| China | .. | 16.8 | 9.0 | 25.8 | .. | 31.5 | 7.8 | 20.4 |
| Colombia | 33.7 | 8.4 | 8.5 | 10.2 | 48.4 | 31.1 | 32.2 | 36.8 |
| India | 6.1 | 10.2 | 3.6 | 2.8 | 18.3 | 365.4 | 9.2 | 5.4 |
| Indonesia | 13.3 | 15.9 | 15.7 | 16.1 | 51.5 | 149.3 | 79.4 | 80.0 |
| Korea | 35.8 | 30.9 | 31.5 | 31.9 | 361.1 | 73.0 | 42.1 | 34.2 |
| Malaysia | 20.5 | 12.4 | 11.1 | 11.8 | 30.9 | 19.5 | 15.7 | 16.7 |
| Mexico | 28.2 | 15.4 | 11.9 | 11.4 | 546.1 | 163.1 | 53.3 | 40.2 |
| Philippines | 43.4 | 14.5 | 11.8 | 11.6 | 265.5 | 479.1 | 45.6 | 45.0 |
| Poland | .. | 19.4 | 11.2 | 11.2 | .. | 213.6 | 26.7 | 27.2 |
| Russian | ||||||||
| Federation | .. | 19.9 | 9.8 | 13.7 | .. | .. | 64.4 | 64.4 |
| Thailand | 27.8 | 29.6 | 18.7 | 19.6 | 147.6 | 62.6 | 46.5 | 40.9 |
| Turkey | 13.1 | 19.2 | 24.4 | 14.2 | 232.2 | 157.0 | 128.6 | 86.6 |
| .. : Not Available | @ : Excluding Gold | |||||||
| Source: | Global Development Finance, World Bank, 2003. For India, | |||||||
| Reserve Bank of India. | ||||||||
are the two most common indicators of liquidity. In 2001, both the ratios were the lowest for India (Table 7.14).
7.109 The East Asian crisis also highlighted the need for monitoring the level of private non-guaranteed (PNG) debt. Accurate data on PNG debt burden is important as it includes various financial instruments including inter-company loans, bonds, debentures and notes, money market instruments, financial derivatives, trade credits, loans for projects, financial leases, repurchase agreements, and foreign currency deposits held by non-residents. In the context of the East Asian countries, it has been argued that high levels of short-term debt owed by private financial institutions and non-financial corporations were directed into speculative activities, over-extended industries, over-ambitious infrastructure projects and inefficient government monopolies. There is, thus, an imperative need for monitoring various components of short-term debt, viz., (i) inter-company debt between direct investors and subsidiaries, branches and associates; (ii) buyers and suppliers credits; (iii) money market instruments; (iv) loans from foreign financial institutions for normal inter-bank transactions and other commercial purposes; and (v) foreign currency deposits held by residents. A cross-country comparison of the currency composition of long term debt suggests that most of the debt is invoiced in the US dollar (Table 7.15).
| Table 7.15: Currency Composition of | ||||||||
| Long-Term Debt: 2001 | ||||||||
| (Per cent) | ||||||||
| Country | US | Euro | Japanese | Pound | Swiss | Multiple | Special | All |
| Dollar | Yen | Sterling | Franc | currency | Drawing | other | ||
| Rights | curren- | |||||||
| cies | ||||||||
| All developing | ||||||||
| countries | 61.8 | 12.9 | 9.9 | 0.9 | 0.4 | 6.7 | 0.4 | 7.1 |
| Argentina | 67.2 | 25.2 | 4.1 | 0.4 | 0.4 | 2.7 | 0.0 | 0.0 |
| Brazil | 70.9 | 13.4 | 8.8 | 0.9 | 0.3 | 5.6 | 0.0 | 0.1 |
| Chile | 89.1 | 1.4 | 3.9 | 0.2 | 0.0 | 5.3 | 0.0 | 0.1 |
| China | 74.1 | 4.7 | 14.5 | 0.1 | 0.1 | 6.0 | 0.0 | 0.5 |
| India | 70.4 | 5.6 | 11.2 | 3.6 | 0.3 | 8.0 | 0.3 | 0.6 |
| Indonesia | 57.1 | 7.6 | 28.1 | 0.9 | 0.6 | 4.7 | 0.3 | 0.7 |
| Malaysia | 71.1 | 0.3 | 22.6 | 0.5 | 0.0 | 5.4 | 0.0 | 0.1 |
| Mexico | 89.3 | 1.1 | 5.8 | 0.2 | 0.0 | 3.2 | 0.0 | 0.4 |
| Philippines | 48.2 | 3.9 | 34.0 | 0.1 | 0.1 | 13.0 | 0.4 | 0.2 |
| Thailand | 48.5 | 1.7 | 44.2 | 0.1 | 0.0 | 5.3 | 0.0 | 0.3 |
| Source : | Global Development Finance, World Bank, 2003. | |||||||
External Debt: An Indian Perspective
7.110 In the 1980s, with the increased requirement of external resources to finance the widening current account deficit and the decline in access to concessional sources of finance, India had taken recourse to commercial loans especially the short-term borrowings. Under exceptional circumstances, the country also accessed funding facilities from the IMF in the early 1980s. The growth of external debt was particularly noticeable during the second-half of the 1980s and the share of commercial debt in total external debt increased from 15 per cent in 1981 to 40 per cent in 1991. As a consequence of the increase in commercial debt, debt servicing as a proportion of current receipts increased from 10.2 per cent in 1980-81 to 35.3 per cent in 1990-91. The overhang of large external debt, particularly the short-term debt was one of the important triggering factors in the balance of payments crisis in 1991.
7.111 India, however, remained resolute not to default on its external obligations. Notwithstanding the downgrading of India’s credit rating, conventional as well as unconventional ways were adopted to mobilise external finance (see para 7.72). The severe balance of payments crisis of 1990-91 necessitated a fresh look at the debt management strategy to evolve new guidelines. The approach to the external debt management that was adopted in India in the 1990s was based broadly on the recommendations of the Rangarajan Committee (1993). Following these recommendations, the strategy has been guided by: (i) the continuation of an annual cap, minimum maturity restrictions and prioritising the use of ECBs;
(ii) LIBOR based ceilings on interest rates and minimum maturity requirements on NRI deposits to discourage the volatile component of such deposits; (iii) containment of short-term debt together with controls to prevent its undue increase in future; (iv) retiring/ restructuring/ refinancing of more expensive external debt; (v) measures to encourage non-debt creating financial flows such as foreign direct and portfolio investments; (vi) incentives and schemes to promote exports and other current receipts; and (vii) conscious build-up of foreign exchange reserves to provide effective insurance against external sector uncertainties.
7.112 An important aspect of external debt management in India since the 1990s has been control over short-term component. On a critical review of the policies on short-term debt and its role in precipitating the 1991 payments difficulties, the High Level Committee on Balance of Payments had noted that the problem was created by use of short term credit as a means of protecting foreign exchange reserves rather than financing trade requirements. The Committee provided the following policy guidelines for short-term debt in India: (i) short-term debt should be permitted only for trade related purposes under normal terms; (ii) recourse to short-term debt should not be taken as instrument for protecting the reserves; (iii) no roll over beyond six months should be agreed in regard to any short-term facilities without careful consideration of the implications; (iv) any short-term debt not governed by the above considerations should be specifically approved by the Reserve Bank; and (v) the Reserve Bank should set up a monitoring system for the stock of short-term debt.
7.113 The success of India’s debt management policy is reflected in a gradual and steady improvement in the debt sustainability indicators during the 1990s (Table 7.16). While the ratio of concessional debt to total debt is the highest in India, the short-term debt as a per cent of total debt as well as foreign exchange reserves are the lowest for India among the top 15 debtor countries in the world. It is notewor thy that in terms of indebtedness classification, the World Bank has classified India as a less-indebted country since 1999.
7.114 The cautious approach to short-term debt in India has been vindicated during the crisis in East Asia. The need for compilation of short-term debt on residual/remaining maturity basis was also highlighted by the East Asian crisis. Even by residual maturity basis, India’s short-term debt remains modest (Table 7.17).
| Table 7.16: Indicators of Debt Sustainability for India | |||||
| (Per cent) | |||||
| Year | Solvency Indicators | Liquidity Indicators | |||
| DSR | ISR | DGDP | STD/TD | STD/FER | |
| 1 | 2 | 3 | 4 | 5 | 6 |
| 1990-91 | 35.3 | 15.5 | 28.7 | 10.2 | 146.5 |
| 1991-92 | 30.2 | 13.0 | 38.7 | 8.3 | 76.7 |
| 1992-93 | 27.5 | 12.5 | 37.5 | 7.0 | 64.5 |
| 1993-94 | 25.4 | 10.5 | 33.8 | 3.9 | 18.8 |
| 1994-95 | 26.2 | 9.7 | 30.8 | 4.3 | 16.9 |
| 1995-96 | 24.3 | 8.8 | 27.0 | 5.4 | 23.2 |
| 1996-97 | 21.2 | 7.3 | 24.5 | 7.2 | 25.5 |
| 1997-98 | 19.0 | 7.5 | 24.3 | 5.4 | 17.2 |
| 1998-99 | 17.8 | 7.8 | 23.6 | 4.4 | 13.2 |
| 1999-00 | 16.2 | 7.3 | 22.1 | 4.0 | 10.3 |
| 2000-01 | 17.2 | 6.6 | 22.4 | 3.6 | 8.6 |
| 2001-02 | 13.9 | 5.4 | 21.0 | 2.8 | 5.1 |
| 2002-03 | 14.7 | 4.1 | 20.3 | 4.4 | 6.1 |
| Note : DSR = Debt Service Ratio | |||||
| ISR | = Interest Service Ratio | ||||
| DGDP = Debt to Gross Domestic Product Ratio | |||||
| STD | = Short-Term Debt | ||||
| TD | = Total Debt | ||||
| FER | = Foreign Exchange Reserves. | ||||
| Source : Reserve Bank of India | |||||
7.115 In India, multilateral and bilateral debt constitute the largest component of external debt. Apart from multilateral and bilateral debt, external commercial borrowings and NRI deposits are the other two major components in India’s total external debt (Table 7.18).
7.116 Four basic facts emerge from the changing profile of India’s external debt. First, the level of debt
| Table 7.17: India’s Short Term External Debt by Residual Maturity | ||||||
| (US $ million) | ||||||
| Item | 1998 | 1999 | 2000 | 2001 | 2002 | |
| 1 | 2 | 3 | 4 | 5 | 6 | |
| 1. | Short-term debt by | 5,046 | 4,274 | 3,936 | 3,628 | 2,745 |
| original maturity | (5.4) | (4.4) | (4.0) | (3.6) | (2.8) | |
| 2. | Long-term debt | 6,723 | 7,059 | 8,359 | 6,767 | 11,465 |
| obligation maturing | (7.2) | (7.3) | (8.5) | (6.7) | (11.6) | |
| within one year | ||||||
| 3. | Short-term debt by | 11,769 | 11,333 | 12,295 | 10,395 | 14,210 |
| residual maturity | (12.6) | (11.7) | (12.5) | (10.3) | (14.4) | |
| (1+2) | ||||||
| Note : Figures in the bracket represent per cent to total external debt. | ||||||
| Source : India’s External Debt: A Status Report, June 2003. | ||||||
| Table 7.18: External Indebtedness of India (Debt Outstanding in US $ billion) | |||||||||
| End- | Multil- | Bilat- | IMF | Trade | ECB | NRI Rupee | STD | Total | |
| March | ateral | eral | Credit | Debt | |||||
| 1 | 2 | 3 | 4 | 5 | 6 | 7 | 8 | 9 | 10 |
| 1989-90 | 19.2 | 13.6 | 1.5 | 4.7 | 9.3 | 9.1 | 11.0 | 7.5 | 75.9 |
| 1990-91 | 20.9 | 14.2 | 2.6 | 4.3 | 10.2 | 10.2 | 12.8 | 8.5 | 83.8 |
| 1991-92 | 23.1 | 15.5 | 3.5 | 4.0 | 11.7 | 10.1 | 10.4 | 7.1 | 85.3 |
| 1992-93 | 25.0 | 16.2 | 4.8 | 4.3 | 11.6 | 11.1 | 10.6 | 6.3 | 90.0 |
| 1993-94 | 26.3 | 17.5 | 5.0 | 5.2 | 12.4 | 12.7 | 10.1 | 3.6 | 92.7 |
| 1994-95 | 28.5 | 20.3 | 4.3 | 6.6 | 13.0 | 12.4 | 9.6 | 4.3 | 99.0 |
| 1995-96 | 28.6 | 19.2 | 2.4 | 5.4 | 13.9 | 11.0 | 8.2 | 5.0 | 93.7 |
| 1996-97 | 29.2 | 17.5 | 1.3 | 5.9 | 14.3 | 11.0 | 7.5 | 6.7 | 93.5 |
| 1997-98 | 29.6 | 17.0 | 0.7 | 6.5 | 17.0 | 11.9 | 5.9 | 5.0 | 93.5 |
| 1998-99 | 30.5 | 17.5 | 0.3 | 6.8 | 21.0 | 11.8 | 4.7 | 4.3 | 96.9 |
| 1999-00 | 31.4 | 18.2 | 0.03 | 6.8 | 19.9 | 13.6 | 4.4 | 3.9 | 98.3 |
| 2000-01 | 31.1 | 16.0 | 0.0 | 5.9 | 24.2 | 16.6 | 3.7 | 3.6 101.1 | |
| 2001-02 | 31.9 | 15.3 | 0.0 | 5.4 | 23.3 | 17.2 | 3.0 | 2.7 | 98.8 |
| 2002-03 | 30.0 | 16.8 | 0.0 | 5.0 | 22.4 | 23.2 | 2.8 | 4.6 104.7 | |
| Note : ECB = | External Commercial Borrowings; | ||||||||
| NRI = | Non-resident Indian Deposits; | ||||||||
| STD = | Short-Term Debt; | ||||||||
| IMF = | International Monetary Fund. | ||||||||
| Source : Reserve Bank of India | |||||||||
has been relatively stable in the last decade, showing only a modest increase. Second, the debt portfolio is characterised by high share of concessional and low share of short-term debt. Third, there has been a sustained improvement in key indicators of external indebtedness position of the country. Finally, compared to other emerging economies, India’s indebtedness position is relatively comfortable and has improved over time.
7.117 A perceptible improvement in overall debt scenario has been brought out in India by policy reforms incorporating, inter alia, the management of current account deficit within sustainable limits; a distinct shift in the policy preference in favour of equity as against debt in the matter of capital inflows; and tight monitoring of short-term flows which are permitted only for trade related purposes. Moreover, the market determined exchange rate has helped in avoiding the excessive risk-taking that occurred in some of the East Asian countries which followed a policy of either a fixed or a predictable exchange rate regime. A transparent policy on external commercial borrowings with the stated objectives of prudent debt management aimed at lengthening of maturity while keeping a ceiling on approvals and
restrictions on end-use in the form of investments in stock markets/real estate turned out to be useful. This, combined with the policy efforts aimed at achieving a commensurate growth in current receipts to service the existing debt also helped in the management of external debt.
IV. CONCLUDING OBSERVATIONS
7.118 The level of foreign exchange reserves held by any country is really a consequence of the exchange rate policy being pursued. The accumulation of reserves is also a reflection of imbalances in the current account in some countries. Based on various indicators of the adequacy of reserve, India’s reserves holdings are comfortable. The Asian financial crisis not only highlighted the need for maintaining adequate level of foreign exchange reserves, but also underlined the need for prudent management of a country’s reserves assets. Sound practices in the areas of risk management and liquidity management have attracted increased emphasis in recent times. Benchmarking the reserve management practices followed in India against some of the major countries reveals that the reserve management operations in India are comparable to major reserve holding countries.
7.119 Conventionally, trade flows were deemed to be the key determinants of exchange rate movements. In more recent times, the importance of capital flows in determining the day-to-day exchange rate movements has increased considerably. Capital flows have been observed to cause overshooting of exchange rates as market participants act in concert with pricing information. Capital flows have implications for the conduct of domestic monetary policy and exchange rate management. The important message that comes out from the analysis of various episodes of volatility and the policy response is that flexibility and pragmatism are needed in exchange rate policy in developing countries, rather than adherence to strict theoretical rules. There is a need for central banks to keep instruments/policies in hand for use in difficult situations.
7.120 In the face of large capital flows, considerations of maintaining a competitive exchange rate, on the one hand, and controlling inflation, on the other, create conflicting objectives for a central bank. In such situations, central banks need to take a very cautious path while handling large capital inflows and the promptness of the central bank could be judged by effectiveness with which it resolves such conflicting policy objectives without any loss of inflows while keeping inflation within manageable limits. India’s exchange rate policy with focus on managing volatility with no fixed rate target while allowing the underlying demand and supply conditions to determine the exchange rate movements over a period in an orderly way has stood the test of time.
7.121 Central banks all over the world are concerned over development of markets in order to allow market participants to manage their own risk -micro risks. As the market develops, the concern of the central bank is limited to manage the macro risk. Over the last few years, several measures have been taken to deepen and widen the foreign exchange market in India so as to provide the market participants the necessary support to undertake foreign exchange transactions with reduced uncertainty. The empirical evidence shows that over the medium-term, forward premia and interest differentials in India move together. Short-run deviations from uncovered interest parity condition indicate that sterilised foreign exchange market intervention and monetary tightening can be effective in ensuring orderly conditions.
7.122 The improvement in India’s external debt position since 1991-92 is attributable to a conscious debt management policy that focussed on high growth rate of current receipts, keeping the maturity structure as well as the total amount of commercial debt under manageable limits, limiting short-term debt and encouraging non-debt creating flows. The strategy that was actively put in place in the early 1990s has paid dividends to sustained improvement in external indebtedness position of the country.

ಈ ಪುಟವನ್ನು ಹಂಚಿಕೊಳ್ಳಿ:


ಭಾರತೀಯ ರಿಸರ್ವ್ ಬ್ಯಾಂಕ್ ಮೊಬೈಲ್ ಅಪ್ಲಿಕೇಶನ್ ಅನ್ನು ಇನ್ಸ್ಟಾಲ್ ಮಾಡಿ ಮತ್ತು ಇತ್ತೀಚಿನ ಸುದ್ದಿಗಳಿಗೆ ತ್ವರಿತ ಅಕ್ಸೆಸ್ ಪಡೆಯಿರಿ!
ನಮ್ಮ ಅಪ್ಲಿಕೇಶನ್ ಅನ್ನು ಸ್ಥಾಪಿಸಲು QR ಕೋಡ್ ಅನ್ನು ಸ್ಕ್ಯಾನ್ ಮಾಡಿ


ಪೇಜ್ ಕೊನೆಯದಾಗಿ ಅಪ್ಡೇಟ್ ಆದ ದಿನಾಂಕ:


