 IST,
IST,


Perspectives on Banking in India
Shri Deepak Mohanty, Executive Director, Reserve Bank of India
delivered-on ಮೇ 18, 2013
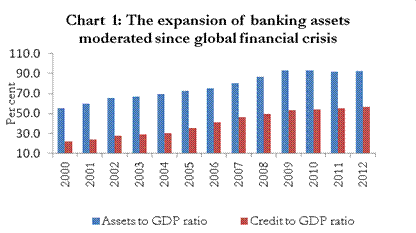
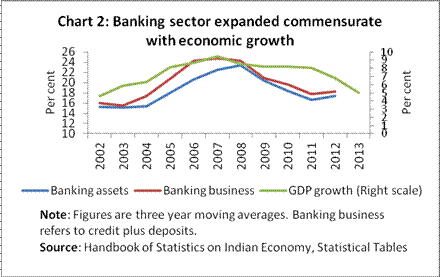
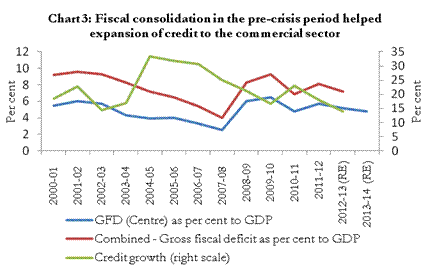
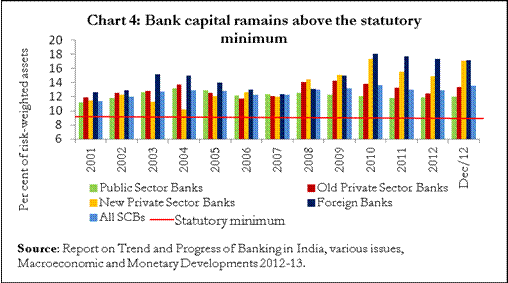
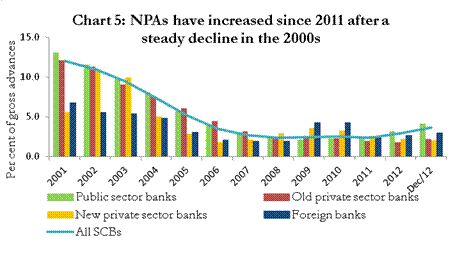
I thank Shri Rajiv Mundhra, President Indian Chamber of Commerce (ICC) and Shri Rajeev Singh, Director General ICC for the opportunity to be a part of this distinguished panel. The ICC is making an important contribution to the development of banking by bringing together the experience and expertise from the banking industry, corporate sector and financial regulators through its banking summits year after year. In this year’s Summit too, I see a judicious mix of expertise from the relevant areas to deliberate on the Indian banking. The decade of the 2000s was eventful for the Indian economy. We saw acceleration in GDP growth: with India recording its highest average annual output growth of 8.7 per cent during the period 2004-08. This was accompanied by a sharp increase in savings and investment. At the same time, we had to contend with the fallout of the global financial crisis, the adverse impact of which has been persisting. Economic growth has slowed down over the last two years and inflation remained above the tolerable level, though there has been significant moderation in the first month of the current financial year, 2013-14. These developments have had an impact on banking. Against this economic background, I examine the performance of the Indian banking sector over the last 12 years as finance is inexorably linked with economic progress. I will then touch upon financial inclusion, with a particular reference to the eastern-region, as it is a major plank of the Reserve Bank’s current policy thrust. I will conclude with some thoughts on challenges for the banking sector in the way forward. Finance and Growth Economic literature establishes a positive association between financial development and growth. In the 1960s and 1970s, the pioneering work by Raymond Goldsmith, Mckinnon and Shaw underlined the importance of financial liberalisation to step up savings and investments in an economy, and thereby economic growth.1 More recent studies, carrying forward the earlier work have reinforced our understanding of the ways in which finance could exercise a positive influence on economic growth across time and across countries.2 Even the recent global financial crisis, the causes of which are complex as they are, does not negate the view that financial development commensurate with the requirements of the real economy is essential for sustained economic growth.3 This is particularly important for a developing economy like ours where the reach of the formal financial sector is still inadequate. Let me now turn to banking in India. Ours is a bank dominated financial sector: commercial banks account for over 60 per cent of the total assets of the financial system comprising banks, insurance companies, non-banking financial companies, cooperatives, mutual funds and other smaller financial entities.4 Banking expansion as reflected in the growth of total assets of banks was rapid till the intensification of the global financial crisis which affected the Indian economy through trade, finance and confidence channels. Bank assets as a percentage of gross domestic product (GDP) rose from 60 per cent in 2000-01 to 93 per cent by 2008-09, but there after it has plateaued. Bank credit to GDP ratio more than doubled from 24 per cent to 53 per cent during this period but has remained around that level in the following years (Chart 1). The growth of the banking sector was influenced by the performance of the economy, reflected in a co-movement between the growth in banking business and real GDP growth (Chart 2). It is noteworthy that the period up to 2007-08 was also a period of fiscal consolidation, with combined fiscal deficit of the centre and the states falling from over 9 per cent of GDP in early 2000s to 4 per cent by 2007-08 (Chart 3). The consequent reduction in government borrowing requirement opened up the space for expansion of credit to the commercial sector in a non-inflationary manner. While the financial expansion has slowed down in the post-crisis period, the Indian banking sector has shown remarkable resilience and stability. During the global financial crisis, the timely recourse to counter-cyclical prudential and monetary policy measures helped the banking sector in transiting through this challenging period largely unscathed. Most of the indicators of soundness bear out the stability of the Indian banking sector. The capital to risk-weighted assets ratio (CRAR) at the aggregate and bank group-levels have remained above the statutory minimum requirement of 9 per cent and international norm of minimum 8 per cent since 2001 (Chart 4). There was a steady improvement in the asset quality through the 2000s. For instance the gross non-performing assets (NPAs) as per cent of gross advances had declined from 12.0 per cent in 2000-01 to 2.4 per cent in 2007-08. Thereafter it has increased to 3.7 per cent by December 2012, first with higher NPAs in foreign and private sector banks and more recently in public sector banks (Chart 5). While Indian banks compare well with many other advanced and emerging economies including BRICS in terms of NPA and CRAR, there is considerable scope for improvement (Table 1).
Banking Efficiency It has been a key objective of financial sector reforms to improve the efficiency and profitability of the banking sector. In this regard, the interest rate structure has been fully deregulated. The statutory pre-emptions of bank resources through statutory liquidity ratio (SLR) and cash reserve ratio (CRR) have been substantially reduced. Banks’ access to central bank liquidity through export credit refinance, marginal standing facility (MSF) and liquidity adjustment facility (LAF) has been enhanced. Furthermore, branch licensing norms have been relaxed and prudential norms have been strengthened. In addition, banks have increasingly adopted technology and accorded greater focus to human resource management. These changes have helped improve efficiency as borne out by various indicators. The profitability of the Indian banking sector has been maintained at about 1.0 per cent in terms of Return on Assets (RoA), even in the post-crisis period. The banks have also shown significant improvement in other efficiency indicators such as cost to income ratio, business per employee and business per branch. However, net interest margin (NIM) has gone up indicating deterioration in allocative efficiency (Table 2). Let me now turn to financial inclusion with a particular reference to the eastern-region.
Financial Inclusion In order to sustain a higher economic growth, it is important to bring the excluded segment of the society into the fold of the formal financial sector. In recognition of this, the Reserve Bank has taken a number of steps to take formal banking to door steps of habitations with population over 2000 through the business correspondent (BC) model where the BCs provide basic banking functions acting as agents of banks. Simultaneously, a number of initiatives such as incentivisation of branch authorisation scheme for banks to open branches in unbanked centres, simplification of Know Your Customer (KYC) norms, technological interventions and financial literacy-oriented programmes to increase awareness have been taken. While the initial impact of these initiatives has been positive, it has created a huge potential for expansion in banking business once the level of activity is scaled up and government social benefit transfers increasingly take place through the banking sector. While we have our own data source to gauge financial inclusion, the Census of India provides useful information on access to banking. It shows that about 59 per cent of households had access to banking services in 2011 as compared with only 35 per cent in 2001. Increase in access for the eastern-region has also gone up significantly from about 29 per cent in 2001 to 47 per cent in 2011, though the region still lags behind the all-India average (Table 3).
In 2001, the all-India average population per bank branch was 15,600, which has fallen steadily to 12,500 by 2012 again suggesting an increased penetration of the branch network. For the eastern-region population per branch has declined from 19,500 in 2001 to 17,300 in 2012. While the eastern region has witnessed an increase in banking outreach since 2001, its average has remained lower than the all-India average underlining considerable scope for expansion. Conclusion Let me conclude with some thoughts on the challenges ahead. First, weakening asset quality is an immediate concern for the banking sector. This is more so as the banks’ credit composition in the recent years has changed towards longer term assets such as infrastructure and housing. While improvement in macroeconomic policy environment and expected revival in economic growth should help mitigate risks to some extent, banks would have to make concerted efforts to improve asset quality. Second, while on many efficiency parameters, Indian banks compare favourably to their global peers, the net interest margin (NIM) remains relatively high. The banks need to further enhance their productivity so that the intermediation cost between depositors and borrowers is minimised. This, coupled with containment of NPAs, will help improve monetary transmission. Third, as the Indian economy reverts to its high growth path, the demand for credit will go up. The consequent expansion of the banking sector will require more capital. Additionally, as the Basel III norms are made applicable, the capital requirements would increase further. The preliminary assessment by the Reserve Bank made in June 2012 showed a comfortable position of Indian banks at the aggregate level to meet the higher capital norms. As per the broad estimates from the Reserve Bank, public sector banks would require a common equity of Rs1.4-1.5 trillion in addition to Rs 2.65-2.75 trillion as non-equity capital to meet the full Basel III norms by 2018. Banks, therefore, need to design appropriate strategies for meeting these capital norms. Fourth, a key factor that accentuated the global financial crisis was excessive leverage. While the Indian banking system is currently moderately leveraged, according to the guidelines issued by the Reserve Bank, banks should strive to maintain a minimum Tier I leverage ratio of 4.5 per cent pending the final proposal of the Basel Committee. It would be prudent for banks not to dilute their leverage position in the interim period 5. Fifth, there are proposals for expansion of the banking sector with new entrants. The Reserve Bank has already invited applications for new banks. Further, as indicated in the annual policy statement of May 2013, the Reserve Bank is preparing a policy discussion paper on banking structure in India which would be placed in the public domain. The expansion of the banking sector commensurate with the growth of the economy would not only enhance competition but also facilitate financial inclusion. With these remarks, I wish the conference all success. Thank you. * Speech by Shri Deepak Mohanty, Executive Director, Reserve Bank of India, delivered at the 5th Indian Chamber of Commerce (ICC) Banking Summit, at Kolkata on May 18, 2013. The assistance provided by Rekha Misra and Pallavi Chavan in preparation of the speech is acknowledged. 1 Mckinnon, R. I. (1973), “Money and Capital in Economic Development”, Washington D. C., Brookings Institution; Shaw, E. S. (1973), Financial Deepening in Economic Development, New York, Oxford University Press. 2 See Levine, Ross, Norman Loayza, and Thorsten Beck (2000), “Financial Intermediation and Growth: Causality and Causes”, Journal of Monetary Economics, Volume 46, Issue 1 and also, Demirguc-Kunt, Asli and Ross Levine (2004) (eds.), Financial Structure and Economic Growth: A Cross-Country Comparison of Banks, Markets and Development, MIT Press. 3 While lessons are still being distilled from the crisis, the IMF assigned a central role to failure of risk management and weaknesses in regulation and supervision besides the global pattern of low interest rates and a build-up of leverage (World Economic Outlook, April 2009, IMF). 4 Reserve Bank of India (2012), RBI Annual Report - 2011-12, Mumbai. 5 Subbarao D. (2012), “Basel III in International and Indian Contexts Ten Questions We Should Know the Answers For”, Inaugural Address delivered at the Annual FICCI - IBA Banking Conference, Mumbai. |
||||||||||||||||||||||||||||||||||||||||||||||||||||||||||||||||||||||||||||||||||||||||||||||||||||||||||||||||||||||||||||||||||||||||||||||||||||||||||||||||||||||||||||||||||||||||||||||||||||||||||||||||||||||||||||||||||||||||||||||||||
ಪೇಜ್ ಕೊನೆಯದಾಗಿ ಅಪ್ಡೇಟ್ ಆದ ದಿನಾಂಕ:


