RbiSearchHeader

Press escape key to go back

Past Searches

Theme
Theme
Text Size
Text Size
S3

Press Releases Marquee

RBI Announcements
RBI Announcements

RbiAnnouncementWeb

RBI Announcements
RBI Announcements

Asset Publisher

56438727

Role of Financial Sector in Spurring Growth and Expanding Financial Inclusion in North Eastern Region

Shri P. Vijaya Bhaskar, Executive Director, Reserve Bank of India

delivered-on ಅಕ್ಟೋ 07, 2014

Introduction

The North Eastern Region (NER) of India constitutes eight states namely Arunachal Pradesh, Assam, Manipur, Meghalaya, Mizoram, Nagaland, Tripura and Sikkim1.The NER is a unique socio-cultural segment in the country, richly endowed with natural resources with fertile land, identified as one of the most bio-diverse regions in the World. However, the development of the NER has lagged the rest of the country. The task of development of NER emanating from its unique features has been accepted as a national mission and accordingly, since 1980s, Government has been making special efforts for all round development of the region. In order to fast track the process of development in the region, a separate Ministry viz., Ministry of Development of NER was created in 20042.

Further, to investigate the issues related to limited success in achieving financial inclusion in NER, the RBI constituted a committee on ‘Financial Sector Plan for NER’ under the chairmanship of Smt. Usha Thorat, Deputy Governor, RBI in 2006. More recently, to address the issues related to development of MSME sector in NER, a separate sub-group was constituted under the Prime Minister’s task force on MSMEs (Chairman Shri T.K.A.Nair) in 20093. The major recommendations of both these reports are given in the Annex.

Against the above backdrop, the present speech analyses the significant role which can be played by the financial sector in spurring growth and expanding financial inclusion in NER. The speech is organised into six sections, section 1 presents the unique features of NER, section 2 discusses the progress achieved in financial inclusion, section 3 presents trends in economic growth of NER over the period March 2006 to March 2013, section 4 discusses the role of Governments in providing necessary conditions for growth, section 5 analyses the role of financial sector in spurring growth and expanding financial inclusion and section 6 presents conclusion and the way forward.

Section 1
Unique Features of NER

  • The eight North Eastern states cover an area of around 2.62 lakh sq. km. constituting 7.9 per cent of the country’s total geographical area, but contains only 45 million people or about 3.8 per cent of the total population of the country (source: Population Census, 2011).

  • The forest cover of the NER accounted for more than 50 per cent of its total geographical area.

  • More than 80 per cent of the population lives in the rural areas while the remaining 20 per cent in urban areas.

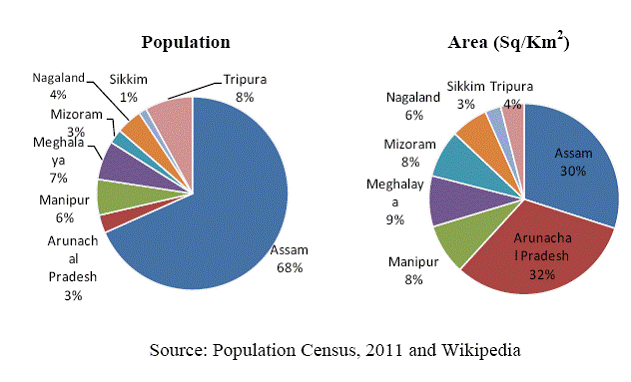
  • State-wise distribution of population and area of NER is:

01
  • The charts indicate that 68 per cent of total NE population lives in the state of Assam and the same accounts for 30 per cent of total NE area. Consequently, the population density varies greatly from 17 per sq.km in Arunachal Pradesh to 397 per sq.km in Assam.

  • The per capita income (PI) at current prices of NE states also varies significantly. Sikkim had the highest PI at Rs.1,51,395 in 2012-13 and Manipur had the lowest PI at Rs.36,937 during the same period (Source: Central Statistical Organization, Govt. of India).

Section 2
Progress in Financial Inclusion in NER

Extent of Financial Exclusion

  • As per NSSO data (59th Round Survey Results), in NER, the proportion of farm households not accessing credit from formal sources in the total farm households is significantly high at 95.9 per cent as against national average of 73 per cent.

  • Further, the proportion of non-indebted farmer households was most pronounced in all states (except Tripura) of NER (ranged between 61.2 per cent and 95.9 per cent).

Financial Sector Development Indicators

Number of Bank Branches

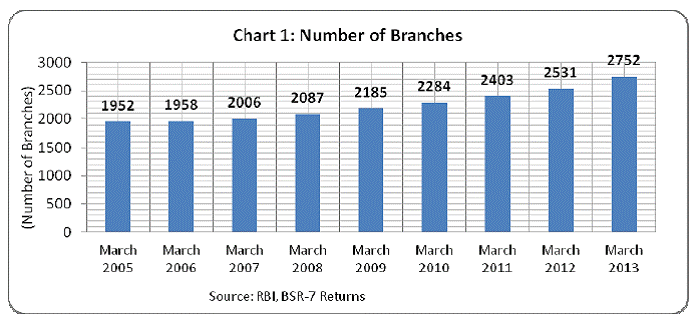
  • The number of branches of Scheduled Commercial Banks (including RRBs) in NER increased from 1952 in March 2005 to 2752 in March 2013 (Chart 1).
02
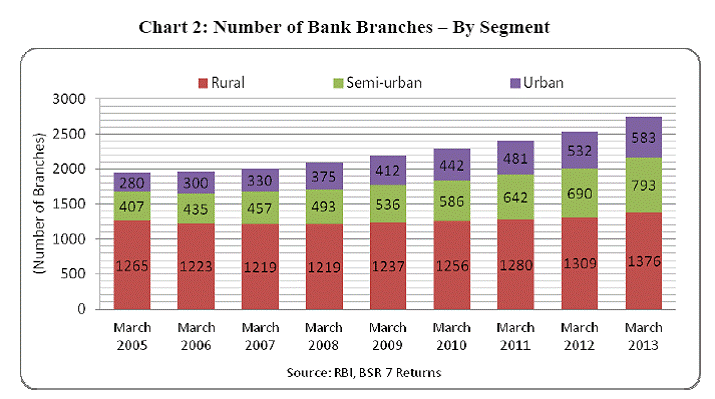
  • Rural segment accounted for the largest share in total branches in the NER. However, the number of branches increased rapidly in semi-urban and urban segments since the launch of financial inclusion plans in the country (Chart 2).

  • Across NE states, the ratio of number of bank branches (SCBs) per one lakh adult population as on March 31, 2013, ranged between 5.77 in Manipur and 24.92 in Sikkim, with a regional average of 10.21, distinctly lower than the national average of 14.25.

  • The population (adult) per branch4 for NER remained at 9795 far above the national average 7016 as on March 31, 2013. The ratio varied greatly across NE states, between 4014 in Sikkim and 17323 in Manipur.

03
  • The ratio of number of bank branches per one lakh adult population as on March 31, 2013 across rural and urban segments of NER remained at 6.16 and 10.45 respectively. It is revealed that the bank branch penetration in rural segment of NER is significantly lower as compared with urban segment despite around 80 per cent of its total population living in rural areas.

  • The population (adult) per branch for NER across rural and urban segments remained at 16242 and 9573 respectively, while the same for all India stood at 13141 and 12641 respectively.

  • Interestingly, the population (adult) per branch in urban segment of NER is better than all-India average.

Progress in Bank Credit

  • NER accounted for a meagre share in all India credit which almost remained stagnant at less than 1 per cent during the period between March 2005 and March 2013 (Table 1).

Table1: Trends in Bank Credit

(Rs. Billion)

Period

NER

All India

Share (%)

March 2005

100

11578

0.86

March 2006

136

15175

0.89

March 2007

173

19496

0.89

March 2008

205

23946

0.86

March 2009

237

28575

0.83

March 2010

283

33456

0.85

March 2011

322

40769

0.79

March 2012

381

47828

0.80

March 2013

434

55065

0.79

Source: RBI, BSR 7 Returns

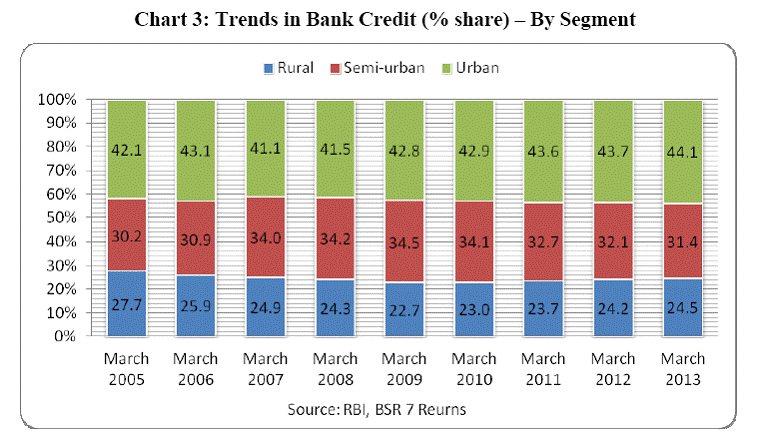
  • Across segments, the credit disbursement is significantly more in urban and semi-urban segments as compared with rural segment (Chart 3). The average of rural credit in total credit of NER remained at 24.5 per cent while the same for urban and semi-urban segments stood at 42.8 percent 32.7 per cent respectively during the period between March 2005 and March 2013.

04

Growth in Bank Deposits

  • NER accounted for less than 2 per cent share in all India bank deposits and like the trend observed in respect of bank credit, the share hovered at around 2 per cent during the period between March 2005 and March 2013 (Table 2 ).

Table 2: Trends in Bank Deposits

(Rs. Billion)

Period

NER

All India

Share (%)

March 2005

277

17532

1.6

March 2006

330

20930

1.6

March 2007

403

25988

1.6

March 2008

500

32288

1.5

March 2009

632

39373

1.6

March 2010

789

46019

1.7

March 2011

945

54265

1.7

March 2012

1088

61741

1.8

March 2013

1269

70513

1.8

Source: RBI, BSR -7 Returns

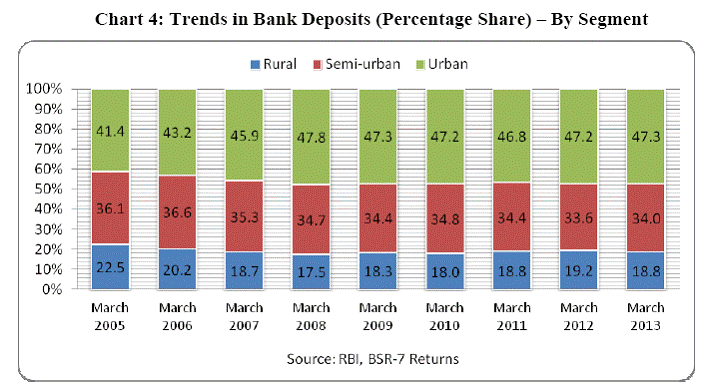
  • Across segments, the deposit collection is relatively more in urban and semi-urban segments. Accordingly, the average share of urban and semi-urban deposits in total deposits of NER remained at 46.0 per cent and 34.9 per cent respectively, while the same for rural segment stood at 19.1 per cent during the period between March 2005 and March 2013.

05

Trends in C-D Ratio

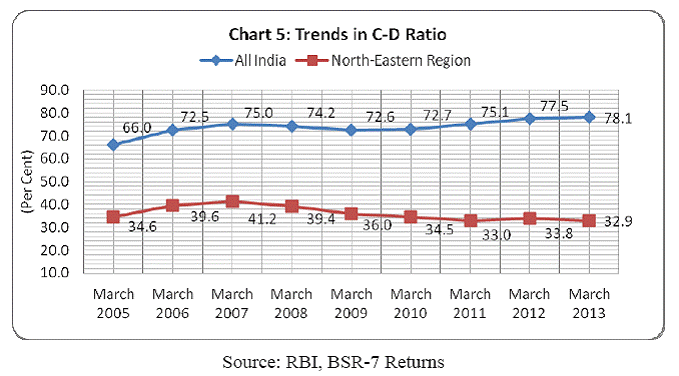
  • The CD ratio of NER as whole as well as individual states is far below the national average. The performance of NER in respect of this indicator worsened from around 40 per cent in March 2007 to 32.9 per cent in March 2013, which is a point to be noted.

06
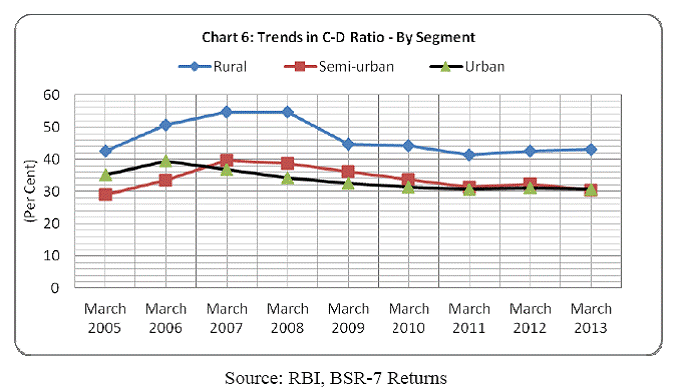
  • CD ratio of rural segment decreased from around 54 per cent during the period between March 2007 and March 2008 to around 43 per cent in March 2013.

07

Villages Covered by Banks

  • The total number of villages in NER remained at 42,250 (source: Census, 2011, Govt. of India). Of these, only 1866 villages (4.4 per cent) were covered under financial inclusion plans as on March 2012 (Table 3). On the other hand, the number of BCs appointed increased from 939 in March 2011 to 1592 in March 2012.

  • Across eight NE states, the progress in number of villages covered is significantly on higher side in the case of Assam and Tripura than other states.

Table 3: Villages Covered and BCs Appointed

State

March 2011

March 2012

Total Villages Covered

Total BCs appointed

Total Villages Covered

Total BCs appointed

Assam

683

564

1332

1166

Arunachal Pradesh

3

3

6

3

Manipur

34

33

48

46

Meghalaya

13

12

28

11

Mizoram

1

1

3

1

Nagaland

36

19

68

48

Sikkim

26

25

37

35

Tripura

338

282

344

282

NER

1134

939

1866

1592

All India

41695

35482

62629

49871

Source: State Level Bankers’ committee

Urban Co-operative Banks

  • There are only 17 urban co-operative banks in NER out of 1586 urban co-operative banks in all India (Source: Urban Banks Department, RBI).

Rural Co-operative Banks

  • There exists a two tier system of rural co-operatives in NER. All the states of NER are having two-tier short term cooperative credit structure i.e., a State Cooperative Bank at apex level and Primary Agriculture Cooperative Society (PACS) at ground level. There are no District Central Cooperative Banks functioning in these states. The PACS are direct members of the State Cooperative Banks.

  • The network of rural co-operative banks in NER is presented in the following Table 4. The number of PACS of NER accounted for 3.8 per cent of all India PACS.

Table 4: Distribution of Rural Co-operatives, March 2013

State

No. of State Co-operative Banks

No. of
PACS

Arunachal Pradesh

1

34

Assam

1

766

Manipur

1

223

Meghalaya

1

179

Mizoram

1

133

Nagaland

1

1719

Tripura

1

268

Sikkim

1

169

NER

8

3491

All India

32

91833

NER as a % to All India

25.0

3.8

Source: National Federation of State Cooperative Banks Ltd

Distribution of NBFCs

  • The distribution of NBFCs across NE states for which data is available is furnished in the following Table 5. As on date, there are 108 NBFCs registered in NER. Of the total, 101 are registered in Assam state alone.

  • Except, four NBFCs which are systemically important, the asset size of other NBFCs is quite small.

Table 5: Distribution of NBFCs in NER

State

Number of Registered NBFCs

Number of NBFCs Having Assets Size Rs.100 crore and Above

Assam

101

4

Manipur

3

0

Meghalaya

2

0

Nagaland

2

0

Total

108

4

Source: Department of Non-Banking Supervision, RBI
Note: Number of branches are consolidated based on 6 large NBFCs (having assets size of Rs. 50 crore and above) which have been submitting their information about their branches.
NA – Not Available

MSME Distribution

  • The state-wise distribution of MSMEs and employment in NER is as shown at Table 6. It was observed that NER accounted for only 5 per cent of total MSMEs in India.

Table 6: Status of MSMEs and Employment

State

Number of Enterprises (lakh)

Employment (lakh)

Registered

Un-registered

Registered

Un-registered

Assam

0.2

6.62

2.11

14.25

Arunachal Pradesh

0.00

0.41

0.05

1.19

Manipur

0.04

0.91

0.20

2.36

Meghalaya

0.03

0.88

0.13

1.92

Mizoram

0.04

0.29

0.26

0.81

Nagaland

0.01

0.39

0.16

1.71

Sikkim

0.00

0.17

0.01

0.79

Tripura

0.01

0.98

0.23

1.75

NER

0.33

10.65

3.15

24.78

All India

15.64

361.76

93.09

805.24

Source: MSME Annual Report, 2013-14

Growth in SHG-Bank Linkage

  • The progress achieved in SHG-Bank Linkage during the last three years is furnished in the following Table 7.

  • As on March 2013, there are around 3.24 lakh saving linked SHGs with aggregate savings of Rs.130 crore and 1.44 lakh credit linked SHGs with credit of Rs. 796 crore.

Table 7: Status of SHGs in NER

Period

Savings of SHGs

Bank Loans Outstanding Against SHGs

No. of SHGs

Saving Amount
(Rs. Lakh)

No. of SHGs

Loans Outstanding
(Rs.Lakh)

2010-11

324739
(4.4%)

13104
(1.9%)

150021
(3.1%)

69525
(2.2%)

2011-12

366718
(4.6%)

15251
(2.3%)

159416
(3.7%)

99326
(2.7%)

2012-13

323896
(4.4%)

13010
(1.6%)

143660
(3.2%)

79675
(2.0%)

Source: Status of Micro Finance in India, NABARD, Various issues
Note: Figure in brackets represents per cent to all India

Section 3
Economic Growth in NER

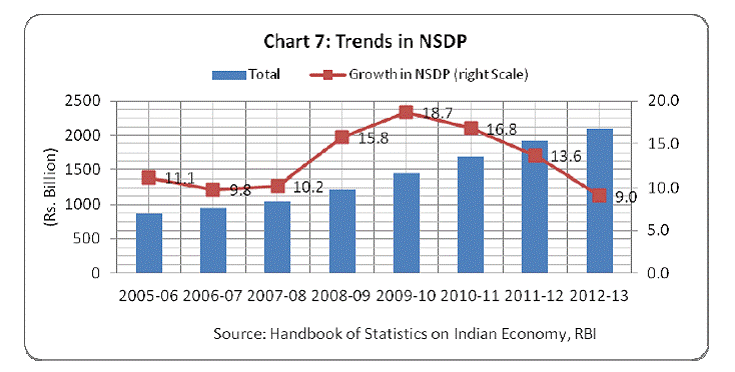
  • Net State Domestic Product (NSDP) is generally considered as a reliable indicator of the performance of the states. The consolidated NSDP (at current prices) of eight NE states stood at Rs.2093 billion during 2012-13. The consolidated NSDP grew at an average annual growth of over 13 per cent during the period between March 2006 and March 2013.

  • In tandem with the national trend, the NSDP of NER decelerated rapidly since 2010 - from 18.7 per cent during 2009-10 to 9 per cent during 2012-13 (Chart 7).

08

Sector-wise Contribution to NSDP

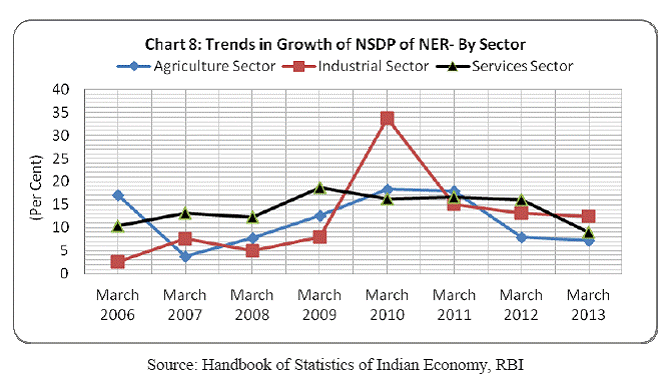
  • Services sector is the highest contributor of NER’s NSDP. It is seen that since 2009-10, the services sector grew at a steady pace of around 16 per cent (Chart 8). However, it declined to around 9 per cent during 2012-13.

  • Agriculture sector is the second most important sector for NER. The sector which grew steadily between 2006-07 and 2008 09, declined rapidly since 2009-10.

  • Industrial sector witnessed mixed trends. On an average, it grew at 12.2 per cent during the period between 2005-06 and 2012-13.

09
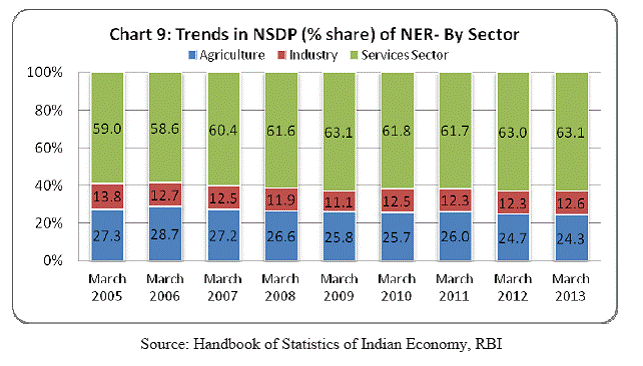
  • Sector-wise contribution to NSDP across the above mentioned three sectors are furnished in the following chart 9.

  • Services sector constituted the highest share in total NSDP of NER followed by agriculture and industry. Except for a few years, the share of services sector in total NSDP of NER increased steadily while the share of agriculture declined and that of industry showed mixed trends.
10

Section 4
Role of Governments in Providing Necessary Conditions for Growth

The role of Governments in the following areas would be paramount in providing the necessary conditions for growth, so as to enable the financial system to further galvanise their efforts for development of NER.

Security: Many committees found that security is the most important factor which impedes growth of banking sector in NER. Therefore, there is an imperative need to ensure security in the region.

Infrastructure facilities: For up-scaling financial inclusion efforts, adequate infrastructure facilities such as digital and physical connectivity, uninterrupted power supply etc., are prerequisites.

Under Developed Rural Areas: It was observed from the banking development indicators viz., number of bank branches, growth in bank credit and deposits of rural NER have been witnessing decelerated trends in the recent years. As mentioned earlier, around 80 per cent of total NE population reside in rural areas. There is an imperative need to have a “special plan” to effectively address the specific issues pertaining to rural areas of NER to provide a fillip to the growth in the area.

Savings and Investment: It is widely held that for long-term economic growth, increase in savings and investments are vital. Planning commission, for 12th plan period, estimated state-wise and sector-wise rates of investment (gross capital formation as a % to GDP) for NER (Table 8). , The estimated investment rate for NER is reasonably good and is comparable with national average. However, on examining the savings (i.e., only bank deposits for which data is available) of NER, it was observed that there is deceleration in bank deposits since March 2006. For rapid development of NER, state governments and financial sector regulators should work together in enhancing investment and savings in the region, which may in turn boost the levels of growth.

Table 8: Sector-wise Distribution of Investment (% to GDP) of NER

State

Agriculture

Industry

Services

All Sectors

Arunachal Pradesh

3.28

17.99

15.63

36.91

Assam

4.20

7.33

17.85

29.38

Manipur

6.92

11.35

11.91

30.17

Meghalaya

2.52

17.19

16.16

35.87

Mizoram

7.78

14.14

16.46

38.89

Nagaland

2.57

10.52

19.67

32.76

Sikkim

1.82

25.96

15.09

42.87

Tripura

7.76

10.27

13.63

31.66

NE

4.61

14.34

15.80

34.81

All India

2.69

16.02

18.03

36.75

Source: Report of the Working-Group on Estimation of Investment, its Composition and Trend for Twelfth Five-Year Plan (2012-13 to 2016-17)

Section 5
Role of Financial Sector in Spurring Growth and Expanding Financial Inclusion

Given the ground-level position as identified, the role of financial institutions in spurring growth sector-wise and in enhancing financial inclusion in NER is detailed.

(i) Agriculture Sector:

a) Agriculture & Allied activities: As mentioned earlier, the forest cover of the NER accounts for more than 50 per cent of its total geographical area. Banks may explore the possibilities of financing of industrial/ agriculture and allied activities based on forest produce/products. Further, given the peculiar feature of NER of having a large rural population, banks should initiate steps for development of especially local arts and handicrafts, through intensive use of Self-Help Groups and Joint Liability Groups.

b) Agriculture Extension Services: As agriculture is the second important economic activity for NER, State Governments should initiate suitable steps to educate farmers about new technologies. This would help farmers to improve their productivity, earn more income and improve their standard of living. These agricultural extension services bring about changes in farmers attitude, knowledge and skills through education and communication.

c) Focus to Thrust Areas: As mentioned in Prime Minister’s Task Force Report (2010), to achieve all round development of NER, focus should shift on thrust areas such as handicrafts, horticulture, textiles, live- stock development and food processing industry.

(ii) Industrial Sector:

a) MSMEs have a greater role in achieving financial inclusion in NER, as most of its population lives in the rural segment. There is a need for having an action plan for increasing MSMEs as a driver of employment in the area.

b) Cluster Development: As mentioned in Prime Minister’s Task Force Report (2010), to provide more focussed attention in the NER, a Regional Resource Centre (RCC) has been set up at Indian Institute of Entrepreneurship, Guwahati, with 7 sub-centres in the NE States. The RCC caters to the need of entire NER with respect to cluster development5, training, mapping of clusters, advisory services etc

c) Marketing Support: According to Prime Minister’s Task Force Report, entrepreneurs of NER are facing immense difficulties while marketing their agricultural/ industrial products. Governments should initiate suitable steps in providing adequate marketing support in order to encourage entrepreneurs/ industrialists in NER.

d) Skill Development: Vocational skill building and training in NER are of utmost importance to provide employment to the local unemployed youth. Currently, there are 27 Rural Self Employment Training Institutes functioning in the NER. Urgent necessary steps may be initiated for increasing the skill development in the region.

e) Setting-up of Industrial Estates: On account of prevailing unique land mortgage system in NER, availability of land is one of the major issues faced by the prospective entrepreneurs in setting up of MSMEs/industries. Prime Minister’s Task Force Report recommends setting up/ earmarking of at least one industrial estate in each block for MSMEs to facilitate setting up of new MSMEs in the region.

(iii) Services Sector:

a) Eco and Leisure Tourism: State Governments should take effective steps to promote tourism - especially, eco-tourism and leisure tourism given the pristine natural beauty of the region, with its numerous bird/animal sanctuaries.

b) Financial Inclusion: Since the launch of financial inclusion initiatives in India, financial inclusion in NER consistently showed upward trends in terms of number of bank branches, credit and deposit growth. Further steps needed to speed-up the financial inclusion efforts in NER are:

c) Increasing Branch Presence: In North-Eastern States and Sikkim, SCBs need to make conscious efforts to increase the number of branches.

d) Villages Covered: Since the number of villages covered accounted for only 4.4 per cent of total villages in NER, there is an urgent case for increasing banking footprints in the region.

e) Intensive Financial literacy and awareness campaign in vernacular languages in all the NER States is needed to mitigate risks posed by activities of unauthorised deposit collection by various methods by multiple agencies. This is especially important in NER, given the fact that, relatively speaking, there is higher number of instances of unauthorised deposit collection through various dubious means.

f) Rural Co-operative Banks: The NER is having poor network of rural co-operatives. For effective financial inclusion, efforts may be initiated to increase the same in the region.

g) NBFCs: There are around 108 NBFCs registered in the region. Of these 101 are registered in Assam state alone. Financial inclusion could be further deepened by opening of new NBFCs/opening branches of existing NBFCs.

(iv) Caveats in the context of opening of accounts

The financial institutions should generally in the context of opening accounts need to take effective steps to mitigate the following:

a) Smurfing:

The possibility of accounts being used as conduits for money laundering cannot be ruled out through a process known as “Smurfing”, a process by which amounts are split below the threshold level of Rs. 50,000/- to fly under the radar and thereby prevent detection.

b) Accounts being used as money mules:

Accounts of vulnerable individuals may be used by third parties to launder money is another possibility regarding which the banks should be careful of.

c) Opening of Multiple Accounts:

In the recent financial inclusion drive, multiple accounts have been opened by applicants in the hope that they would get an additional rupees one lakh insurance cover for every account so opened. However, if the applicants were to open different accounts in the same bank, using different documents like Aadhar Card, Pan Card, Passport etc., with slight variations in the manner in which their names are written, de-duplication may not be possible. The problem gets compounded if an applicant opens multiple accounts in different banks.

Section 6
Conclusion and Way Forward

Let me conclude by repeating what I have endeavoured to convey about the role of financial sector in spurring growth and expanding financial inclusion in NER. I began with a brief introduction of the subject and provided the unique features of the NER. Thereafter, progress achieved in Financial Inclusion is discussed to assess where the NER stands at the present juncture. Trends in economic growth of NER were analyzed to indicate the performance of NER. Thereafter, the roles of Governments and financial sector regulators in spurring growth and expanding financial inclusion in NER have been discussed, along with caveats to be observed while opening accounts by the financial institutions. It must be reiterated that synchronised and simultaneous efforts by the governments and financial institutions cannot be overemphasized in the context of NER.

Thank You.


Annex
Recommendations of Committees/Reports

A. Usha Thorat Committee on Financial Sector Plan for NER (2006)

Major recommendations made by the committee are as under:

  • The banks may draw up plans to provide at least 50 new households per branch each month for the next four years with a deposit account.

  • Banks could introduce a pilot project in the rural and semi urban segments closest to the bank branches by customising simple deposit and credit products to suit the needs of the households.

  • To encourage the flow of credit through General Credit Card (GCC), the committee recommend that 100 per cent of the advance under GCC at rural and semi-urban branches of NER would be treated as priority sector6.

  • Given the unique cultural and language barriers in NER, the committee suggested an approach that is based on enhancing the capacities of the existing branches of commercial banks, RRBs, and Co-operative banks having more recourse to bank/SHG linkage programme, BC/BF model and extensive use of information technology enables services to facilitate offsite banking.

B. Report of the Task Force on MSME (2010)

To address the issues related to the MSME sector, a task force under the chairmanship of the principal secretary was constituted in 2009. A separate Sub-Group was also constituted to look into the development of MSMEs in the North-East and Jammu & Kashmir. The recommendations made by the sub-group pertaining to NER are discussed below.

  • Focus to Thrust Areas: Development focus should shift on thrust areas such as handicrafts, horticulture, textiles, live stock development and food processing industry.

  • Cluster Development: To provide more focussed attention, in the NER, a Regional Resource Centre (RCC) has been set up at Indian Institute of Entrepreneurship, Guwahati, with 7 sub-centres in all the NE States. The RCC cater to the need of entire NER with respect to cluster development, training, mapping of clusters, advisory services etc.

  • Marketing Support: One among the major difficulties faced by the entrepreneurs of NER is marketing of their products due to their distant location and lack of adequate transportation/ communication facilities. The National Small Industries Corporation (NSIC) organises exhibitions for display of products and handicrafts belonging to NER. The sub-group recommends that (a) more exhibitions, both domestic as well as international, could be organised to expand the markets for NER products; and (b) market linkages should be encouraged under the schemes of various Ministries / Departments.
  • Skill Development: The skill and training infrastructure in NER must be strengthened. New institutions must be encouraged to impart requisite skills to the local unemployed youth.
  • Setting-up Industrial Estates: On account of prevailing unique land mortgage system in NER, availability of land is one of the major issues faced by the prospective entrepreneurs in setting up of MSMEs. The subgroup recommends that setting up/ earmarking of at least one industrial estate in each block for MSMEs to facilitate setting up of new MSMEs in the region.

References

  • Prime Minister’s Task Force on Micro, Small and Medium Enterprises, Government of India.

  • Report on Development of North Eastern Region, November, 1981

  • Report of the Committee on Financial Sector Plan for North Eastern Region, 2006

  • Report of the Working-Group on Estimation of Investment, its Composition and Trend for Twelfth Five-Year Plan, 2012.

  • Reserve Bank of India, Basis Statistical Returns -7, Various Issues

  • Reserve Bank of India, Handbook of Statistics on Indian Economy, 2013-14

  • Status of Micro Finance in India, NABARD


Speech by Shri P. Vijaya Bhaskar, Executive Director, Reserve Bank of India at CII Banking Collagium in Kolkata on September 19, 2014. Assistance provided by Shri M. Sreeramulu, Assistant General Manager, Department of Non-Banking Supervision, is gratefully acknowledged.

1Sikkim joined the Indian union through a referendum in 1975 and was recognised as part of Northeast India in the 1990s.

2Recently, PMO has directed the Project Monitoring Group to fast track development projects in NER. The central government already identified 21 key projects worth over Rs.1 lakh crore for ensuring faster clearances to them. Of 21 projects, nine projects are from Arunachal Pradesh, seven from Assam, three from Tripura and one each from Meghalaya and Manipur (Source: Special group set-up to fast track development in Northeast India, DNA, Sept. 1, 2014). Further, the cabinet approved over Rs. 5,300 crore project to boost telecom infrastructure and connectivity in the NER (Source: Deccan Herald, Sept. 10, 2014)

3The group submitted its report in 2010

4Lower the ratio, higher the outreach and vice-versa

5Cluster development offers a holistic and integrated approach to the promotion and development of MSME sector. This envisages measures for capacity building, skill development, technology up-gradation of the enterprises, improved credit delivery, marketing support, setting up of common facility centres, etc.

6Previously, fifty per cent of credit outstanding under GCC up to Rs. 25,000 was eligible for being treated as indirect agriculture financing.

RbiTtsCommonUtility

प्ले हो रहा है
ಕೇಳಿ

Related Assets

RBI-Install-RBI-Content-Global

RbiSocialMediaUtility

ಭಾರತೀಯ ರಿಸರ್ವ್ ಬ್ಯಾಂಕ್ ಮೊಬೈಲ್ ಅಪ್ಲಿಕೇಶನ್ ಅನ್ನು ಇನ್ಸ್ಟಾಲ್ ಮಾಡಿ ಮತ್ತು ಇತ್ತೀಚಿನ ಸುದ್ದಿಗಳಿಗೆ ತ್ವರಿತ ಅಕ್ಸೆಸ್ ಪಡೆಯಿರಿ!

Scan Your QR code to Install our app

RbiWasItHelpfulUtility

ಈ ಪುಟವು ಸಹಾಯಕವಾಗಿತ್ತೇ?