 IST,
IST,
Developments in Cooperative Banking
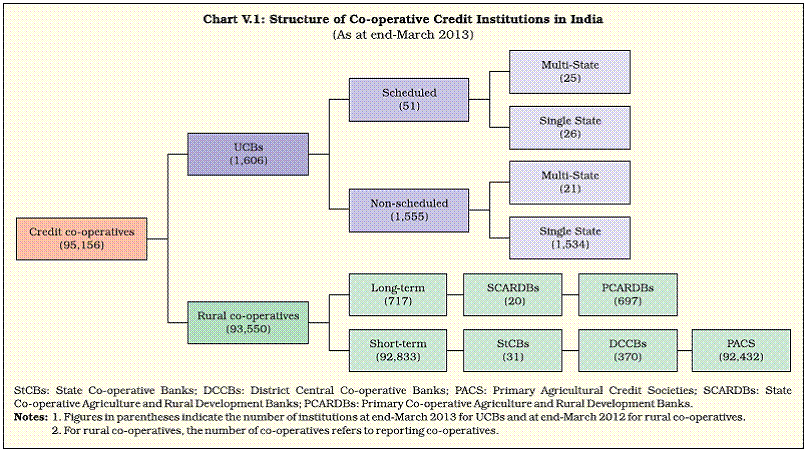
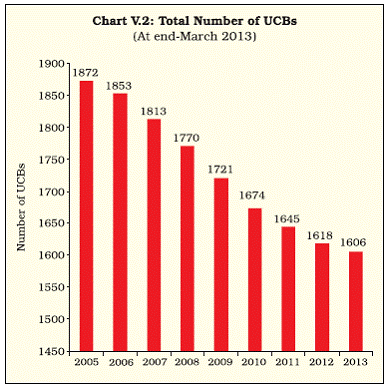
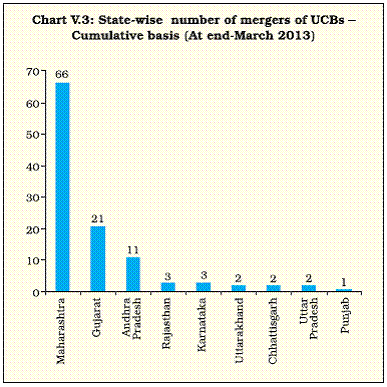
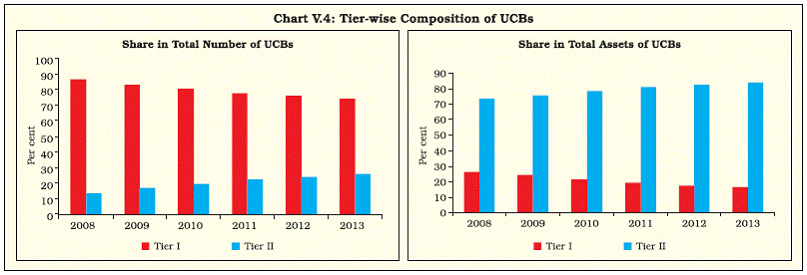
The financial health and soundness of co-operative banks which comprise of Urban Co-operative Banks (UCBs) and rural co-operatives showed a varied performance in terms of key indicators such as profitability and non-performing assets (NPAs). There was a moderation in the net profits of UCBs partly emanating from the impact of the slowdown in economic activity. Their asset quality, however, recorded steady improvement broadly mirroring strengthened prudential norms and regulations. With regard to rural co-operatives, while the overall performance of State Co-operative Banks (StCBs) and District Central Co-operative Banks (DCCBs) exhibited some improvement in net profits and asset quality in 2011-12, primary agricultural credit societies reported losses. The long-term rural co-operatives, such as State and Primary Co-operative Agriculture and Rural Development Banks, continued to show weak financial performance. 1. Introduction 5.1 Co-operative banks play an important role in meeting the credit requirements of both the urban and rural India. Though in the bank dominated financial system, these institutions account for a small share in the total credit they hold a significant position in credit delivery as they cater to different geographic locations and demographic categories1. The wide network of co-operative banks, both rural and urban, supplements the commercial banking network for deepening financial intermediation by bringing a large number of depositors/borrowers under the formal banking network. Demographically, these institutions have enabled access to financial services to low and middle-income groups in both rural and urban areas. 5.2 The role of co-operative banks has been commendable in enhancing the inclusiveness of the financial system. However, the financial performance of these institutions particularly rural co-operatives has been sub-par partly owing to operational and governance-related issues. A number of committees have examined the reasons for their poor financial performance and have suggested remedial measures from time to time. Initiatives for revitalising co-operatives have been ongoing. 5.3 The ongoing initiative of the Reserve Bank towards a unified regulatory framework as envisaged in its Vision Document of 2005 for UCBs buttresses initiatives for creating vibrant UCBs. With regard to short-term rural co-operatives, the recommendations of the Expert Committee on the Short-term Co-operative Credit Structure are aimed at addressing the inadequacies afflicting this segment. 5.4 Against this backdrop, this chapter analyses the performance of UCBs in 2012-13. The analysis for rural co-operative banks pertains to 2011-12 as data on this segment are available with a lag of over one year. The analysis covered in this chapter pertains to 1,606 UCBs and 93,550 rural co-operative credit institutions, including short-term and long-term ones, as provided in Chart V.1. 5.5 The chapter is organised in five sections. Section 2 analyses the performance of UCBs, based on their assets and liabilities, income and expenditure, and financial soundness indicators. Section 3 reviews the performance of various tiers of the short-term and long-term co-operative credit structure. The next section presents developments pertaining to rural co-operatives with regard to licensing. Concluding observations are given in the last section. 2. Urban Co-operative Banks Further consolidation of the UCB sector 5.6 The Reserve Bank adopted a multi-layered regulatory and supervisory strategy aimed at the merger/amalgamation of viable UCBs and the exit of unviable ones for the revival of this sector. This initiative led to a gradual reduction in the number of UCBs (Chart V.2). As a result, the total number of UCBs at end-March 2013 stood at 1,606 as against 1,618 at end-March 2012. 5.7 State-wise distribution of mergers indicates that Maharashtra accounted for the maximum number of mergers with the largest concentration of UCBs. In all the mergers that took place between end-March 2005 and 2013, Maharashtra accounted for 66 mergers, followed by Gujarat (21) and Andhra Pradesh (11) (Chart V.3). Tier-II UCBs dominate the business operations of UCBs 5.8 There was a stable growth in the balance sheets of UCBs during the year. UCBs were classified into Tier-I and Tier-II categories based on their deposit base, and a differentiated regulatory treatment was laid down for these two categories based on the Vision Document of 20052. In recent years, Tier-II banks, which have a larger deposit base and wider geographical presence, have grown in terms of both number and asset size (Table V.1 and Chart V.4). Improvement in the financial strength of UCBs 5.9 The Reserve Bank discontinued the erstwhile classification of UCBs into different grades for regulatory and supervisory purposes with the introduction of CAMELS (capital adequacy, asset quality, management, earnings, liquidity and systems and control) rating model to gauge the financial soundness of UCBs. Under the new CAMELS rating model, a composite rating of A/B/C/D (in decreasing order of performance) is given to a bank, based on the weighted average rating of individual components of CAMELS’ rating model. 5.10 According to the new classification, at end- March 2013 around 67 per cent (61 per cent as at end-March 2012) of the UCBs had composite ratings of A and B, accounting for about 85 per cent (78 per cent as at end-March 2012) of the total banking business (deposits plus advances) of the UCBs. There was a perceptible improvement in the financial strength of UCBs during the year. Around 27 per cent of the UCBs had a composite rating of C accounting for 13 per cent of the banking business of the UCB sector. The lowest rating of D representing the weakest financial health was assigned to about 6 per cent of the UCBs (Table V.2).
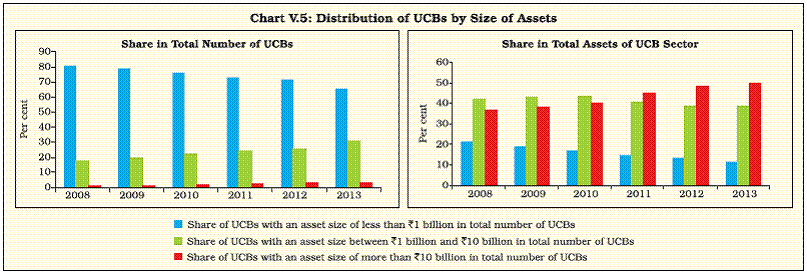
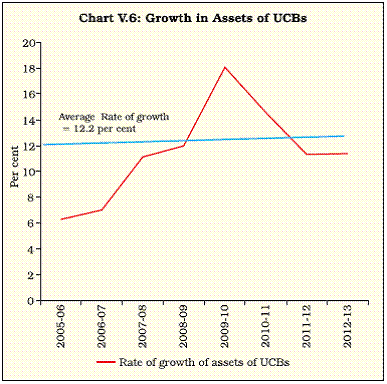
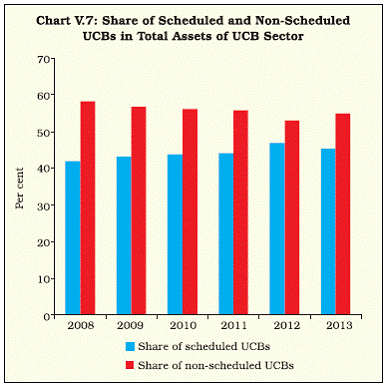
Further increase in asset concentration within the UCB sector in 2012-13 5.11 There has been an increase in asset concentration within the UCB sector in recent years, partly as an outcome of consolidation. The number of UCBs with an asset size of more than `10 billion increased sharply between 2008 and 2013. Notably, the percentage share of such UCBs in the total assets of the UCB sector increased from about 37 to 50 per cent during this period (Chart V.5). 5.12 UCBs with a deposit base of over `10 billion accounted for 47 per cent of the total deposits as at end-March 2013. These institutions with a credit size of over `10 billion also accounted for about 40 per cent of total UCBs advances (Table V.3). Asset growth of UCBs remained stable in 2012-13 5.13 The assets of UCBs increased by 11.4 per cent in 2012-13 (Chart V.6). There was some moderation in their credit growth owing to sluggish demand in the economy. On the other hand investments of these institutions showed relatively higher growth in 2012-13 on account of a sharp increase in SLR investments. In this context, it needs to be noted that UCBs’ deposits with StCBs and DCCBs are reckoned under SLR investments. UCBs are required to maintain a uniform SLR of 25 per cent on their NDTL in India (Tables V.4 and V.5). Scheduled UCBs account for nearly half of total assets of UCBs 5.14 Scheduled UCBs are banks included in the Second Schedule of the RBI Act, 1934 and include banks that have paid-up capital and reserves of not less than `0.5 million and which carry out their businesses in the interest of depositors to the satisfaction of the Reserve Bank. There was a marginal decline in the share of scheduled UCBs in 2012-13. At end-March 2013, there were 51 scheduled UCBs accounting for 3.2 per cent of all UCBs, which had a share of nearly half of the total assets of UCBs (Chart V.7).
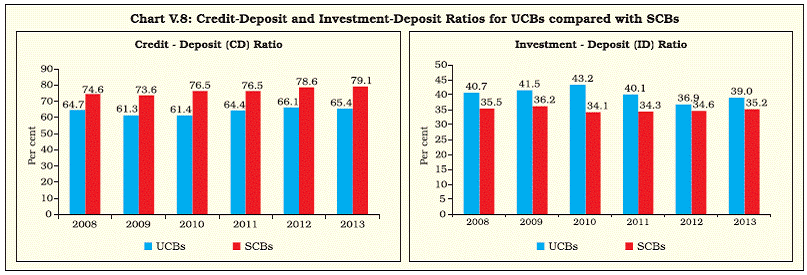
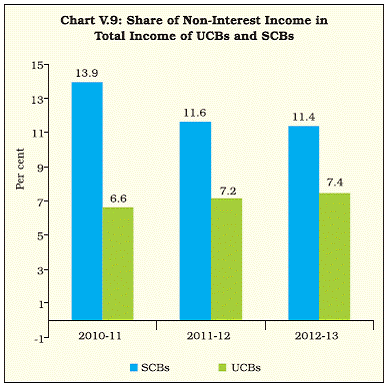
CD ratio of UCBs continued to be lower than SCBs 5.15 Although the credit-deposit (CD) ratio of UCBs hovered in the vicinity of the preceding year, the ratio continued to be lower than that of SCBs (Chart V.8). However, the investment deposits ratio was higher for UCBs than it was for SCBs primarily due to deposits of the former with StCBs and DCCBs as alluded to earlier in this chapter. Profitability indicators of UCBs remained stable in 2012-13 5.16 UCBs’ net profits witnessed a moderation during 2012-13. There was a sharp increase in both their interest and non-interest income. The share of non-interest income remained nearly stable both for SCBs and UCBs. However, UCBs’ total expenditure also rose during the year primarily due to a pick-up in the interest component of expenditure. (Table V.6 and Chart V.9). Major indicators of profitability of UCBs remained stable in 2012-13 (Table V.7). Both the return on assets (RoA), defined as net profits as per cent of average assets, as well as return on equity (RoE), defined as net profits as per cent of average equity, remained almost the same as that of the preceding year. A disaggregated level analysis suggests that two scheduled UCBs reported negative RoA in 2012-13 (Appendix Table V.1).
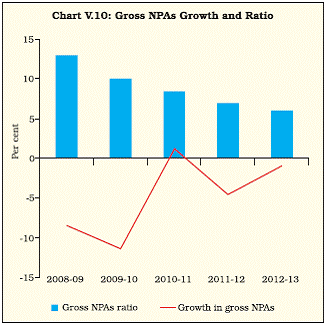
Sustained improvement in the asset quality of UCBs 5.17 The asset quality of UCBs has witnessed sustained improvement in recent years. The gross non-performing assets (NPAs) of UCBs exhibited a decline in absolute terms as well as per cent to total advances in 2012-13 vis-a-vis 2011-12 (Chart V.10 and Table V.8).
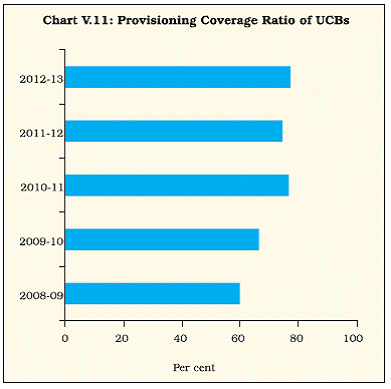
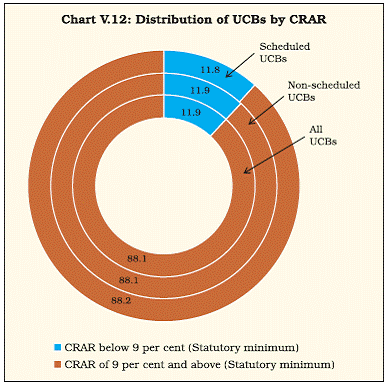
Increase in Provisioning Coverage Ratio (PCR) for UCBs 5.18 Provisions for NPAs of UCBs have increased over the years (Chart V.11). About 88 per cent of UCBs reported CRAR above the statutory minimum in 2012-13 5.19 The Capital to Risk-Weighted Assets Ratio (CRAR) was above the statutory minimum of 9 per cent at end-March 2013 with respect to 1,415 UCBs (Table V.9 and Chart V.12). 191 UCBs, both scheduled and non-scheduled, reported CRAR below the statutory minimum as at end-March 2013. Among scheduled UCBs, four had a negative CRAR.
5.20 The poor financial position of some of the UCBs can be attributed to the structural problems plaguing these institutions. The enactment of the Constitution (97th Amendment) Act, 2011, is likely to promote professionalism in the management of these institutions. The salient features of the Amendment are provided in Box V.1.
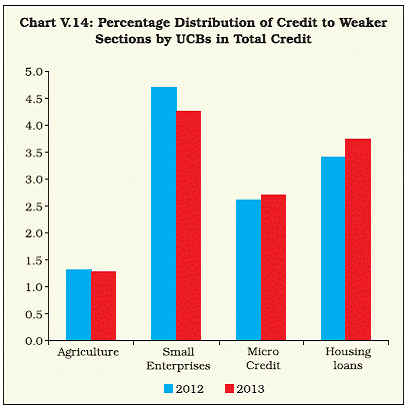
Credit to small enterprises and housing dominated priority sector advances by UCBs in 2012-13 5.21 The composition of credit to priority sectors by UCBs suggests that small enterprises and the housing sector accounted for over onethird of the total credit of these institutions in 2012-13. These institutions primarily cater to the requirements of urban consumers which explains the predominance of these two sectors in the UCBs’ credit portfolio (Chart V.13 and Table V.10). Increase in the provision of credit to weaker sections by UCBs 5.22 Small enterprises, housing loans and micro credit, are the three major constituents in terms of priority in providing credit to weaker sections by UCBs. The aggregate credit to weaker sections has increased in 2012-13 reflecting improved financial inclusion efforts by UCBs (Chart V.14). Salient Features of the Constitution (97th Amendment) Act, 2011 and their Implications for UCBs The Constitution (97th Amendment) Act, 2011, came into force with effect from February 15, 2012 with the provision that necessary amendments have to be carried out in the State Co-operative Societies Acts within one year of the Act coming into force, i.e., February 14, 2013. Salient features of the Amendment The term “co-operative societies” has been included in Article 19 of Part III of the Constitution. Accordingly forming a cooperative society is part of fundamental rights similar to forming an association or unions. Article 243ZI of the Act provides that the State may by law make provisions with respect to incorporating, regulating and winding up cooperative societies based on the principles of voluntary formation, democratic member control, member economic participation, autonomous functioning and professional management. The other important provisions of the Act, inter-alia, include:
Implications for UCBs The provisions of the Constitution (97th Amendment) Act, 2011 would bring uniformity with respect to all the State Co-operative Societies Acts. Some of the implications of the amendments on the functioning of UCBs are:
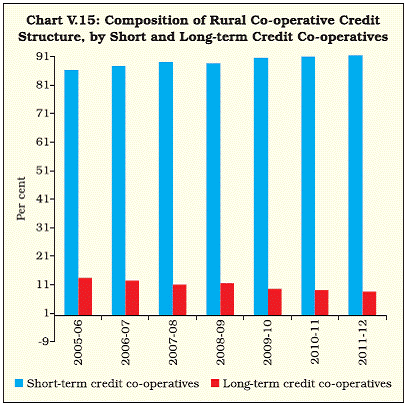
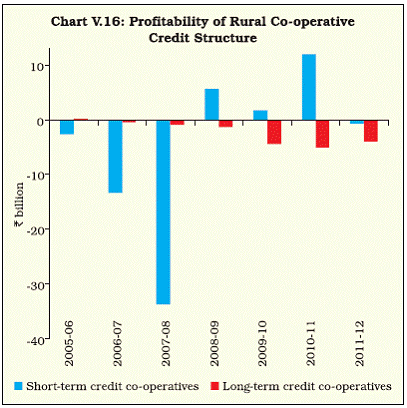
The amendments are expected to result in improved functioning and performance of urban co-operative banks. Source: Constitution (97th Amendment) Act, 2011, Government of India. Concentration of banking business of UCBs continued to be in the western region 5.23 The banking business of UCBs comprising of deposits plus advances continued to be concentrated largely in the western region. The southern region accounting for about one-sixth of the banking business of UCBs stood at a distant second position. These two regions together with 27 per cent of the total districts in India accounted for about 91 per cent of the total banking business of UCBs (Table V.11 and Appendix Table V.3). On the other hand, the remaining four regions with 73 per cent of the total districts had a share of around 9 per cent in the total banking business of UCBs. 3. Rural Co-operatives3 Short-term co-operatives continued to dominate the rural co-operative credit structure 5.24 The role of rural co-operatives in providing agricultural credit has weakened over the years due to myriad factors as reflected in the decline in the share of these institutions in total agricultural credit from 64 per cent in 1992-93 to around 17 per cent in 2011-12 necessitating corrective steps in rural co-operative credit institutions. Within rural co-operatives, the short-term credit co-operatives occupy a significant position in providing credit to the agriculture sector4. The share of short-term credit co-operatives, comprising State Co-operative Banks (StCBs), District Central Co-operative Banks (DCCBs) and Primary Agricultural Credit Societies (PACS), continued to be above 90 per cent of the total assets of the rural co-operative credit institutions at end-March 2012 while the long-term credit co-operatives accounted for the remaining 10 per cent of total assets (Chart V.15 and Table V.12)5. Short-term co-operatives reported losses as the profitability of StCBs and DCCBs was entirely outpaced by the losses incurred by PACS 5.25 The financial performance of short-term credit co-operatives, at the aggregate level, showed losses in 2011-12 in contrast to profitability in the preceding three years primarily due to the losses incurred by the primary agricultural credit societies. While the StCBs and DCCBs reported net profits during 2011-12, the extent of losses incurred by PACS, i.e., third layer of the 3-tier short-term co-operative credit structure outpaced the profits of the other two tiers of short-term cooperative credit institutions. Long-term credit co-operatives showed a continued deterioration in profitability (Chart V.16).
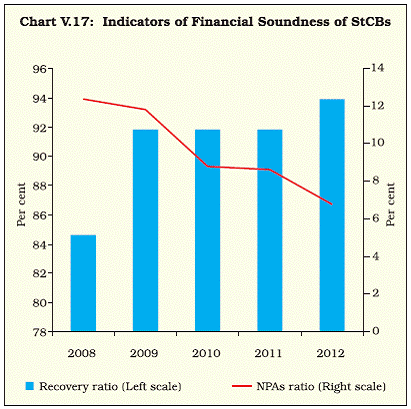
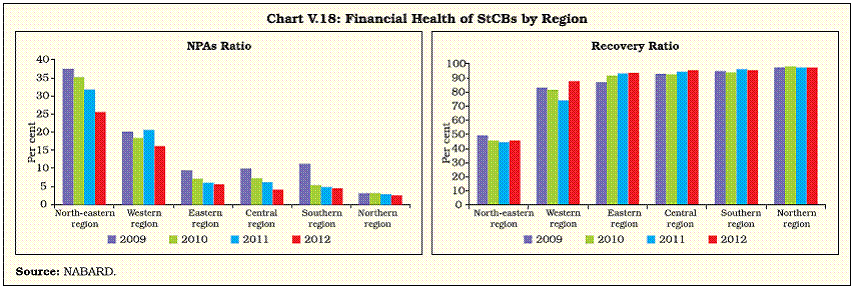
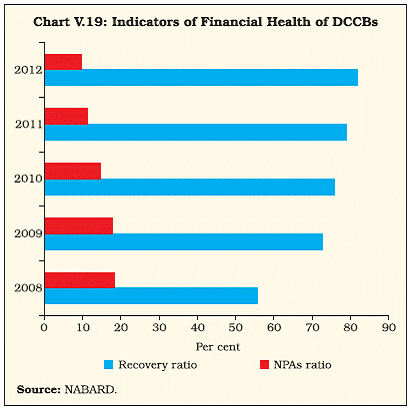
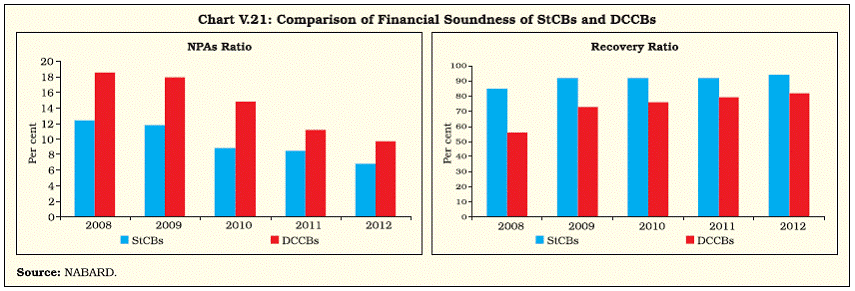
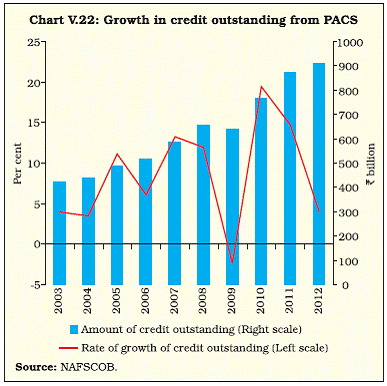
Short-term rural credit co-operatives State Co-operative Banks Sustained growth in the balance sheet of StCBs in 2011-12 5.26 The growth in the balance sheet of StCBs was sustained in 2011-12. High growth in borrowings led to an increase on the liabilities side of their balance sheets in 2011-12, while the increase on the assets side, largely emanated from the growth in loans and advances (Table V.13). Continued growth in the balance sheet of scheduled StCBs in 2012-13 5.27 Balance sheets of scheduled StCBs for 2012-13 were analysed based on advance information available from Section 42(2) returns to assess emerging trends. Trends suggest that there was a substantial increase in credit while deposits increased moderately in 2012-13, reflecting reliance on borrowings by StCBs to meet credit demand (Table V.14). Considerable improvement in the profitability of StCBs in 2011-12 on account of higher growth in income 5.28 The StCBs’ net profits in 2011-12 were more than double the amount recorded by these institutions in 2010-11 (Table V.15). The increased profitability of StCBs was because growth in income outpaced that of expenditure. The growth in income has largely emanated from interest income. On the expenditure front, the increase was primarily contributed by interest expenditure. Improvement in the asset quality of StCBs in 2011-12 5.29 There was a decline in the amount of NPAs of StCBs in 2011-12. This was largely due to a decrease in sub-standard assets and doubtful assets (Table V.16). The recovery-to-demand ratio measuring the extent of recovery of loans as a proportion of expected recovery improved to around 94 per cent in 2011-12 resulting in a lower NPA ratio. The financial soundness of StCBs exhibits perceptible improvement 5.30 There has been a discernible improvement in the financial soundness of StCBs in recent years. The NPA ratio of StCBs showed a consistent decline between 2008 and 2012, while the recovery ratio, recorded a consecutive increase during the same period (Chart V.17). StCBs witnessed an improvement in their financial health across most regions 5.31 There was general improvement in the financial health of StCBs in terms of NPAs and recovery ratios across all regions reflecting strengthened prudential norms and regulations (Chart V.18 and Appendix Table V.4). While the NPA ratio declined across all regions, the recovery ratio registered a marginal decline in the southern region in contrast to other regions. 5.32 The western region with a well established co-operative credit system showed appreciable improvement in the recovery ratio but had a considerably higher ratio of NPAs of over 16 per cent in 2012. On the other hand, the financial health of StCBs in the northern and southern regions was the most robust, with a NPA ratio of less than 5 per cent and the recovery ratio exceeding 95 per cent during the year. District Central Co-operative Banks Near steady growth in the balance sheet of DCCBs in 2011-12 vis-à-vis 2010-11 5.33 District Central Co-operative Banks (DCCBs) witnessed near stable growth in their balance sheet in 2011-12 which was almost the same as that in the preceding year (Table V.17). Improvement in the profitability of DCCBs in 2011-12 5.34 DCCBs reported better performance in terms of net profit in 2011-12 as compared to 2010-11. The improvement was facilitated by an increase in interest income which was in tune with the trend witnessed in the case of StCBs. Interest income constituted about 94 per cent of the total income. Operating expenses on staff and other heads continued to be higher in the case of DCCBs, as compared with StCBs, due to a large network of banks (Table V.18). Improvement in asset quality of DCCBs 5.35 The asset quality of DCCBs improved in 2011-12 with the NPA ratio showing a decline (Table V.19). This is broadly in line with the direction observed in the case of StCBs (Table V.19 and Table V.16). However, DCCBs’ recovery ratio despite some improvement in 2011-12, was significantly lower than the ratio of StCBs underscoring the wider gap between expected and actual recovery in the case of DCCBs. Improvement in the soundness indicators of DCCBs 5.36 The soundness indicators of DCCBs have exhibited continued improvement in recent years partly reflecting the strengthened prudential norms and regulations implemented for these institutions. The recovery ratio of DCCBs showed a moderate increase, while the NPA ratio recorded a decline (Chart V.19). Financial health of DCCBs showed some improvement but lower recovery vis-a-vis StCBs 5.37 There was an improvement in the financial health of DCCBs at the aggregate level. Region-wise performance suggests that DCCBs in the southern and northern regions were financially more robust in terms of low NPAs and a high recovery ratio (Chart V.20 and Appendix Table V.5). The financial health of DCCBs in the central, eastern and western regions appeared to be relatively less robust. However, the gap across regions in terms of both these indicators has narrowed significantly over the years indicating an improvement of DCCBs as an entity. 5.38 Notwithstanding the decline in the NPA ratio and the rise in the recovery ratio, it needs to be recognised that the financial soundness indicators of DCCBs remained generally much weaker than that of StCBs (Chart V.21). The major indicator of the health of co-operatives, viz., NPA ratio, continued to be higher for DCCBs than it was for StCBs. Further, the recovery ratio of DCCBs remained much lower than that of StCBs. Primary Agricultural Credit Societies Sharp deceleration in PACS credit growth in 2011-12 5.39 PACS witnessed a sharp deceleration in credit growth in 2011-12 over 2010-11 (Chart V.22 and Table V.20). Low borrower-to-member ratio for PACS 5.40 The borrower-to-member ratio is a useful indicator of access to credit from PACS. The average ratio during 2008-09 to 2011-12 hovered around 40 per cent indicating that only less than half the PACS members accessed credit from these institutions. The borrower-to-member ratio with respect to small farmers closely tracked the movement in overall borrower-to-member ratio. However, the average ratio was significantly lower at 28 per cent among Scheduled Castes and Scheduled Tribes (SCs/STs) during this period (Chart V.23). The number of loss-making PACS continued to be large 5.41 The percentage of loss-making PACS, despite a decline in recent years, continued to be large. The pace of decline in the percentage of loss-making PACS was lower than the rise in the percentage of profit-making PACS. At end-March 2012, the percentage of loss-making PACS stood at about 39.4 per cent, while those in profit accounted for 49.2 per cent of the total number of PACS (Chart V.24)6. 5.42 The Reserve Bank of India had constituted an Expert Committee to have a relook at the functioning of the short-term co-operative credit structure (STCCS) from the point of view of the role played by STCCS in providing agricultural credit. The committee has made a set of recommendations for action to be taken by various stakeholders (Box V.2). Major Recommendations of the Expert Committee to Examine 3-Tier Short-term Co-operative Credit Structure Under-capitalisation, inter alia, is one of the major problems afflicting the 3-tier co-operative credit institutions. This is sought to be addressed largely through implementing the recommendations of the Vaidyanathan Committee on strengthening co-operative banks. Even after capital infusion, as on July 19, 2013, 23 unlicensed banks in four States were unable to meet the licensing criteria as issuing of licences to these institutions is contingent upon their attaining minimum risk-weighted capital ratio of 4 per cent. It is against this backdrop, the Reserve Bank constituted an Expert Committee to examine the 3-Tier Short-term Co-operative Credit Structure (Chairman: Dr. Prakash Bakshi) with a set of objectives: (i) to have a relook at the functioning of the Short-term Co-operative Credit Structure (STCCS) from the point of view of the role played by them in providing agricultural credit; (ii) to identify Central Co-operative Banks (CCBs) and State Co-operative Banks (StCBs) which may not remain sustainable in the long-run even if some of them have met the diluted licensing criteria; (iii) to suggest appropriate mechanisms for consolidating by way of amalgamation, merger, takeover, liquidation and delayering; and (iv) to suggest proactive measures to be taken by co-operative banks and various stakeholders. The Committee submitted its report to the Reserve Bank in January 2013. The major findings and recommendations of the Committee are: Findings
Recommendations
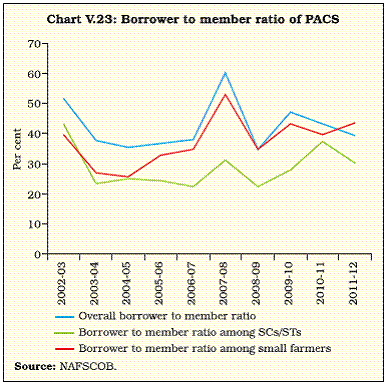
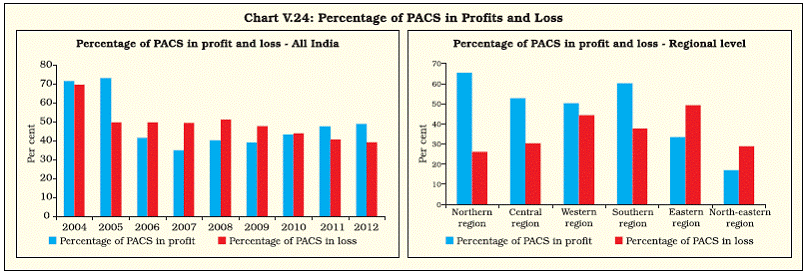
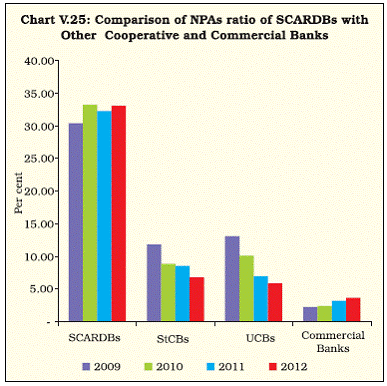
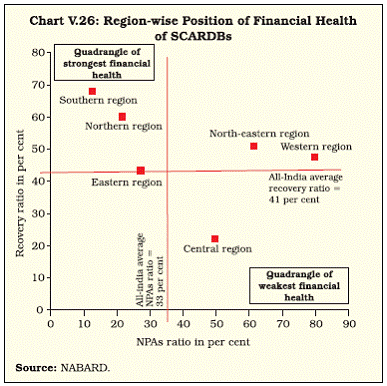
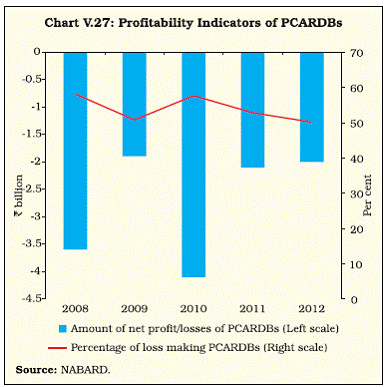
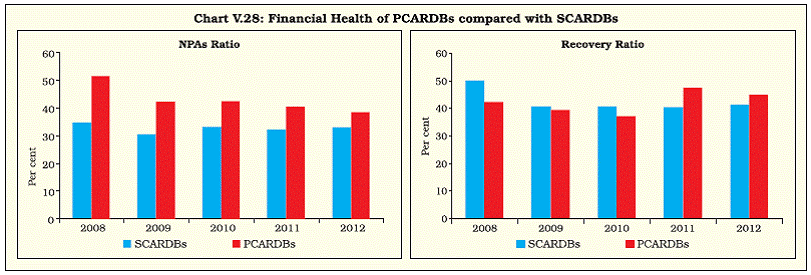
An Implementation Committee (Chairman: Shri V. Ramakrishna Rao, Executive Director, NABARD) has been constituted with members from NABARD and the Reserve Bank for expeditious implementation of these recommendations wherever applicable. The implementation of these recommendations is likely to strengthen rural co-operative credit institutions. Reference: NABARD (2013), Report of the Committee to Examine Three Tier Short-term Co-operative Credit Structure, January. Greater concentration of loss-making PACS in the eastern and north-eastern regions 5.43 The percentage of loss-making PACS was the largest in the north-eastern and eastern regions. In the western region, which had a considerable share of PACS, the percentage of profit-making societies was marginally higher than the number of loss-making societies. In the northern, southern and central regions, the percentage of profit-making societies exceeded the percentage of loss-making societies by a wide margin (Chart V.24 and Appendix Table V.6). Long-term rural co-operatives State Co-operative Agriculture and Rural Development Banks Subdued growth in the balance sheet of SCARDBs in 2011-12 5.44 There was deceleration in the growth in the balance sheets of SCARDBs in 2011-12 primarily due to lower growth in borrowings, which accounted for about 54 per cent of the total liabilities of these institutions. On the assets side, the major driver of growth was credit, which accounted for around 66 per cent of the total assets of these institutions (Table V.21). A comparison of the balance sheets of apex-level institutions in short and long-term co-operative credit institutions reveals that the capital position of SCARDBs has been considerably weaker as compared with StCBs in recent years. Deteriorating asset and credit positions have also been a feature of SCARDBs. SCARDBs reported losses in 2011-12 as they did in 2010-11 5.45 SCARDBs reported losses in 2011-12, as was the case in 2010-11. SCARDBs’ loss-making position was on account of a decline in interest income coupled with increased growth in their total expenditure on account of a steep rise in provisions and contingencies and operating expenses (Table V.22). Asset quality of SCARDBs weakened further 5.46 The asset quality of SCARDBs weakened further with the NPA ratio hovering above 33 per cent (Table V.23). The NPA ratio of SCARDBs remained far higher than other segments of co-operatives as well as that for commercial banks suggesting the extent of the problems plaguing this long-term rural cooperatives segment (Chart V.25). SCARDBs in the western region had highest NPA ratios 5.47 Similar to StCBs, the financial position of SCARDBs in the western region was the weakest with more than three-fourths of their assets being in the non-performing category. Closely following the western region were the north-eastern and central regions. The ratio was the lowest for SCARDBs in the northern and southern regions (Chart V.26 and Appendix Table V.7). As noted earlier, StCBs in these two regions also had strong financial health as compared with StCBs in other regions. Primary Co-operative Agriculture and Rural Development Banks Marginal growth in the balance sheets of PCARDBs in 2011-12 5.48 The balance sheets of Primary Co-operative Agriculture and Rural Development Banks (PCARDBs) expanded marginally in 2011-12. The growth in assets was led by “other assets”, whereas the liabilities were driven by “other liabilities” indicating the reliance of these institutions on alternative sources of funds (Table V.24). A majority of the PCARDBs registered losses in 2011-12 5.49 At an aggregate level, PCARDBs reported losses in 2011-12 (Table V.25). About 50 per cent of the PCARDBs registered losses during the year. In addition, a disconcerting feature was that the financial position of PCARDBs does not indicate signs of a turnaround (Chart V.27 and Appendix Table V.8). PCARDBs weaker than SCARDBs in terms of financial soundness indicators 5.50 Long-term co-operative credit institutions, particularly PCARDBs have a fragile financial position. The NPA ratio was much higher and the recovery ratio was low in the case of PCARDBs in 2011-12 (Table V.26 and Chart V.28 read with Table V.23). 4. Status on Licensing of Rural Co-operatives 5.51 The Reserve Bank regulates the State Cooperative Banks (StCBs) and District Central Cooperative Banks (DCCBs) under the Banking Regulation Act, 1949 (AACS), while NABARD supervises them. The Committee on Financial Sector Assessment (Chairman: Dr. Rakesh Mohan and Co-Chairman: Shri Ashok Chawla) had recommended that rural co-operative banks, which fail to obtain licences by 2012, should not be allowed to operate. A roadmap was drawn up for achieving this objective in a non-disruptive manner in consultation with NABARD. Accordingly, the Reserve Bank relaxed norms which helped in granting licences to large number of rural cooperative banks and only 43 banks (StCB -1, DCCBs-42) remained unlicensed at end-March 2012. 5.52 In order to ensure stability of the financial system and to protect the interests of depositors of these unlicensed banks and also in public interest, the Reserve Bank issued directions prohibiting them from accepting fresh deposits. These banks were advised to draw Monitorable Action Plans (MAPs) to achieve licensing norms by September 30, 2012. Task forces, headed by representatives from the Reserve Bank, NABARD and the State Governments, were constituted to monitor MAPs implementation. 5.53 Following infusion of capital by some State Governments, 17 banks (StCB-1, DCCBs-16) became eligible for issue of licence. With this the number of unlicensed banks became 26 as at end- March 2013. The regulatory action with respect to these banks was placed before the Board for Financial Supervision (BFS). On the basis of instructions from BFS, show-cause notices were issued to all 26 unlicensed DCCBs for not complying with licensing criteria in March 2013. Consequent to the release of funds by a State Government, two DCCBs attained licensing norms, the third DCCB attained licensing norms on its own and licences were issued to these three DCCBs. Thus, as on July 19, 2013, the number of unlicensed banks was reduced to 23 in four States. 5. Overall Assessment UCBs exhibited improvements in asset quality, moderation in profitability; however capital adequacy of some institutions remains a concern 5.54 There was a moderation in the profitability of UCBs while the asset quality of these institutions improved. The number of UCBs attaining minimum statutory capital to risk weighted assets ratio remained stable. However, scheduled UCBs with low levels of CRAR need to improve their capital position. The ongoing process of consolidation has led to an increase in asset concentration. Given the UCBs’ credit disbursement to small enterprises, housing, education and micro-credit in small towns, these institutions need to play an important role in promoting financial inclusion. With regard to urban cooperative banks, the enactment of the Constitution (97th Amendment) Act, 2011, is likely to bring uniformity with respect to certain provisions in the State Co-operative Societies Acts and also promote professionalism in the management of these institutions. These changes are expected to have an important bearing on the overall operations of UCBs. Under short-term co-operatives the financial performance of StCBs and DCCBs exhibited improvement however PACS continued to be affected by financial weaknesses 5.55 Within rural co-operatives, while the performance of StCBs and DCCBs was better, PACS continued to incur losses on an aggregate basis. The financial soundness indicators of StCBs and DCCBs showed a general improvement in 2011-12 across all regions in the country. The losses of primary co-operative societies stem from governance and operational issues. Besides, the loan waiver scheme, the objective of which was supporting the farm sector in times of distress may have disincentivised the repayment of loans in good times under this segment. The prevailing situation in rural co-operatives necessitates some corrective steps to improve their financial soundness without jeopardising the objective of financial inclusion. Financial soundness of long-term cooperatives continued to be fragile 5.56 Long-term co-operatives reported losses; their NPA ratios were also far higher than the other institutions in rural co-operatives possibly reflecting the inherent drawbacks in the recovery mechanism pursued by these institutions. The growth in the asset size of both State and Primary Co-operative Agriculture and Rural Development Banks (SCARDBs and PCARDBs) remained much lower than their short-term counterparts in 2011- 12, as has also been in the recent past. This has led to a gradual decline in the share of long-term co-operatives in the total assets of the rural cooperative sector. 5.57 In sum, the institutional measures suggested by the Expert Committee on Short-term Rural Co-operatives, viz., strengthening Tier-I capital of DCCBs and the operationalisation of core banking solution for StCBs and DCCBs; providing authority to StCBs and DCCBs in taking business decisions within the directions and guidelines prescribed by the Reserve Bank need to be carried forward to strengthen rural co-operatives. Another imperative of urban co-operatives is that efforts need to be made to improve the capital position of banks which are falling short of the statutory minimum. 1 As at end-March 2012, the loans and advances extended by rural and urban co-operatives taken together were about 10 per cent of the total loans and advances disbursed by Scheduled Commercial Banks (SCBs). 2 Tier-I UCBs were defined as UCBs with:
All other UCBs are defined as Tier-II UCBs. 3 The section is based on the year 2011-12 given the lagged availability of data for rural co-operatives. 4 Short-term rural credit co-operatives comprise of State Co-operative Banks (StCBs) at the State level, District Central Co-operative Banks (DCCBs) at the district level and Primary Agricultural Credit Societies (PACS) at the village level. In 19 states, there exists a 3-tier short-term co-operative credit structure, comprising StCBs, DCCBs and PACS and in 12 states, there exists a 2- tier short-term co-operative credit structure. In the north-eastern States, including Sikkim, the structure is a 2-tier structure, comprising of StCBs and PACS. 5 The long-term rural co-operatives include State Co-operative Agriculture and Rural Development Banks (SCARDBs) operating at the State-level and PCARDBs operating at the district/block level. In most north-eastern States, except Assam and Tripura, there is no separate structure of long-term rural co-operatives. In Assam and Tripura, as also in Bihar, Uttar Pradesh and Gujarat, there is a unitary structure, with SCARDBs operating through their branches at the district-level and no separate entity of PCARDBs. By contrast, in other States except Himachal Pradesh and West Bengal, there is a federal structure, with SCARDBs operating through PCARDBs. In Himachal Pradesh and West Bengal, there is a mixed structure, with SCARDBs operating through PCARDBs as well as through their branches. 6 With regard to the remaining PACS, either they broke even, reporting neither profit nor loss, or there was no information available on their financial health. |
||||||||||||||||||||||||||||||||||||||||||||||||||||||||||||||||||||||||||||||||||||||||||||||||||||||||||||||||||||||||||||||||||||||||||||||||||||||||||||||||||||||||||||||||||||||||||||||||||||||||||||||||||||||||||||||||||||||||||||||||||||||||||||||||||||||||||||||||||||||||||||||||||||||||||||||||||||||||||||||||||||||||||||||||||||||||||||||||||||||||||||||||||||||||||||||||||||||||||||||||||||||||||||||||||||||||||||||||||||||||||||||||||||||||||||||||||||||||||||||||||||||||||||||||||||||||||||||||||||||||||||||||||||||||||||||||||||||||||||||||||||||||||||||||||||||||||||||||||||||||||||||||||||||||||||||||||||||||||||||||||||||||||||||||
പേജ് അവസാനം അപ്ഡേറ്റ് ചെയ്തത്:


