 IST,
IST,
I. Output
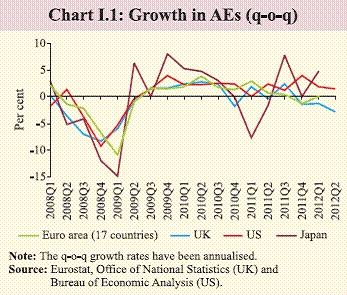
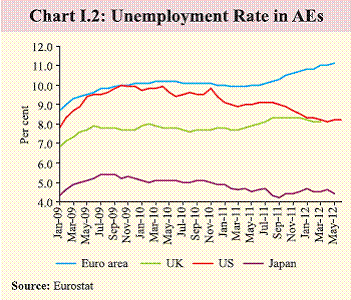
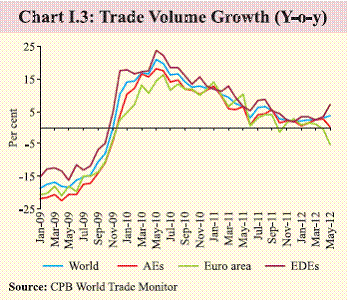
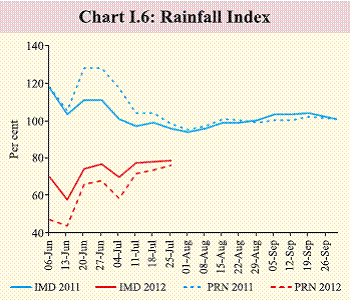
The Indian economy grew at a slower pace than its potential in 2011-12. Growth slowed down in all three sectors of the economy through the course of the year. Moderation in industrial growth persisted in the midst of domestic supply constraints, a clouded domestic policy environment and a deteriorating external outlook. The services sector also under-performed given its inter-linkages with the industrial sector. The available information suggests that slowdown has extended into Q1 of 2012-13, and output expansion in 2012-13 is likely to stay below the potential. Persistent euro area problems and weakening growth in EDEs may drag global growth in 2012 I.1 Global growth, which was better than expected during Q1 of 2012, weakened sharply during Q2 mainly due to increased uncertainties in the euro area and dampened demand conditions in emerging and developing economies (EDEs). Global growth projection for the year 2012 by the IMF (World Economic Outlook Update, July 2012) is 3.5 per cent. The growth projection for the EDEs has been revised downward (by 0.1 per cent from the earlier projection in WEO, April 2012) to 5.6 per cent. I.2 The deceleration in growth in the BRICS nations, which have so far been drivers of EDEs’ growth, has added a new dimension to the global slowdown, making near-term recovery difficult. Growth in China, India, Brazil and South Africa has decelerated since 2011, while that in Russia has been low since 2008. I.3 The euro area crisis has strongly affected the global economic outlook through effects on confidence as well as trade and capital flows. While economic activity in the euro area diminished or stagnated in Q4 of 2011 and Q1 of 2012, the US economy grew at a modest pace (Chart I.1). As per advance estimates, US growth decelerated to 1.5 per cent in Q2 of 2012. Even though the Japanese economy expanded at an annualised rate of 4.7 per cent in Q1 of 2012, it may slow down ahead as the impact of reconstruction spending wears off. I.4 The Institute for Supply Management (ISM) report on US manufacturing suggests a contraction in economic activity in the manufacturing sector in June 2012 (PMI of 49.7), the first time since July 2009. The uncertainty over the path of fiscal policy, which is set to tighten abruptly at the beginning of 2013 or what is termed the ‘fiscal cliff’, could further weaken the US growth later this year. Even though Germany recorded 0.5 per cent q-o-q growth in Q1 of 2012 (as against a contraction in Q4 of 2011), business sentiment fell for the second consecutive month in June to a two-year low. The UK economy witnessed its third consecutive quarterly contraction as the preliminary estimates indicate 0.7 per cent q-o-q decline in GDP in Q2 of 2012. I.5 In the US, the uptick in the unemployment rate to 8.2 per cent since May 2012 has compounded the sense that the economy is going through a sluggish patch. The unemployment rate across the euro area rose to a new high of 11.1 per cent in May 2012, the highest level since records began in January 1995 (Chart I.2). The unemployment rate for people below the age of 25 was even higher at 22.6 per cent. According to the OECD, the unemployment rate in the advanced economies (AEs) will stay high till the end of 2013. I.6 The weak economic activity in the AEs is impacting the EDEs. The reduced demand for exports and weak capital flows combined with their own domestic policy shortcomings has resulted in subdued economic performance in the EDEs, especially in the case of India and Brazil. China’s growth in Q2 of 2012 fell to a three-year low of 7.6 per cent. Dampening trade volume growth is affecting EDEs exports I.7 The slowing growth of the AEs and EDEs has resulted in significant cooling of international trade in Q2 of 2012 after a modest rebound in Q1 of 2012. World trade growth decelerated from its peak of 20 per cent (CPB World Trade Monitor Index) in May 2010 to as low as 2.3 per cent in April 2012 (Chart I.3). The downturn in Europe and resultant fall in import demand has adversely affected the EDEs as the EU constitutes their single largest market. There was a sharp deceleration in both China’s exports and imports during H1 of 2012 to 9.2 per cent and 6.6 per cent, respectively (23.9 per cent and 27.9 per cent in H1 of 2011). Continued deceleration of imports into China does not augur well for other EDEs. Growth slowdown persists during Q4 of 2011-12 in India I.8 The sequential slowdown in growth witnessed in the first three quarters of 2011-12 persisted with the fourth quarter registering growth of 5.3 per cent (Table I.1). This was the lowest y-o-y growth in any quarter of the previous seven years, including the crisis year of 2008-09. The sharp slowdown in growth in Q4 of 2011-12 is largely attributable to the contraction in value added in the manufacturing sub-sector and deceleration in most services sub-sectors. The downturn reflects the continued high inflation as well as the impact of other adverse global and domestic macro-economic factors. For 2011-12 as a whole, growth decelerated sharply to 6.5 per cent from 8.4 per cent in the previous two years.
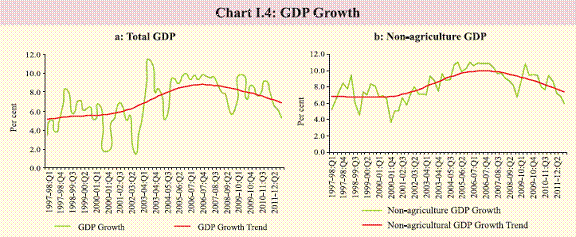
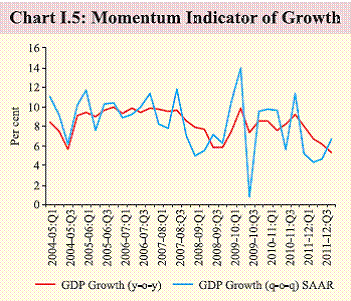
I.9 The potential growth rate, which is the maximum rate of growth that the economy can sustain without creating macroeconomic imbalances, moderated during 2009-10 to 2011- 12 from around 8.0 per cent to around 7.5 per cent (Chart I.4). The output gap was positive during 2009-10 and 2010-11. With the growth rate declining by nearly 2 percentage points in 2011-12, reflecting the impact of both cyclical as well as structural factors, the output gap turned negative during 2011-12. Growth momentum remains weak as is evident from low q-o-q SAAR numbers (Chart I.5). Deficient monsoon likely to impact kharif crops I.10 Foodgrain production in 2011-12 rose by 5.2 per cent from the previous year to an all-time high of 257.4 million tonnes. As per the fourth advance estimates of foodgrain production, there was record output of rice, wheat, cotton and sugarcane. In 2012-13, even though the south-west monsoon arrived on time along the coast of Kerala during the first week of June 2012, its progress to the rest of the country has been slow and uneven. In view of this, the India Meteorological Department (IMD) revised its forecast of rainfall for the period (June- September 2012) from 99 per cent of the long period average (LPA) in May 2012 to 96 per cent of LPA in June 2012 and further down to 92 per cent of LPA in July 2012. The latest information (till July 26, 2012) shows that the south-west monsoon has now covered the entire country but the cumulative rainfall is still 21 per cent below the LPA as against 3 per cent below LPA during the corresponding period in the previous year. I.11 Spatially, rainfall across the four main regions of the country is in deficit with the highest deficiency observed in north-west India (38 per cent below LPA). Overall, rainfall has been deficient/scanty across 63 per cent of the total geographical area of the country covering 22 of the 36 sub-divisions and normal/excess across the rest. In contrast, during the corresponding period last year, rainfall was excess/normal across 85 per cent of the geographical area covering 30 sub-divisions. The deficiency in monsoon as gauged from the Reserve Bank’s production-weighted rainfall index (PRN) is higher with the PRN on July 27, 2012 being 76 compared with a reading of 79 for the IMD index (Chart I.6). I.12 The unsatisfactory performance of the south-west monsoon so far in terms of quantum and spatial/temporal distribution resulted in the slow progress in sowing of kharif crops during June 2012. However, there has been significant improvement in sowing during July 2012 for most crops. Notwithstanding this improvement, area sown under pulses and coarse cereals declined sharply (Table I.2). The crop situation is likely to worsen further if El Nino conditions emerge during the later part of the season. Deficit rainfall has also affected the level of water in the 84 reservoirs under the Central Water Commission (CWC). The storage was 24 per cent of capacity on July 26, 2012 as against 43 per cent during the corresponding period last year.
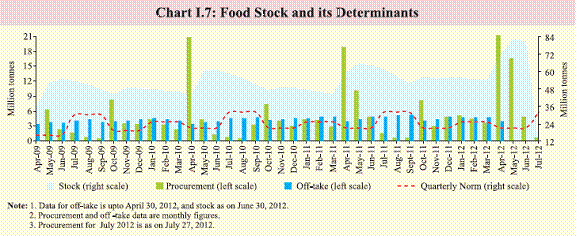
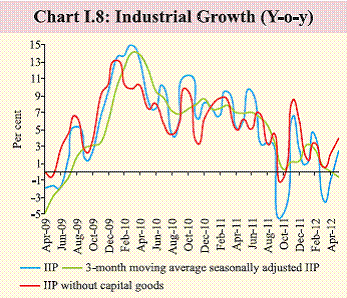
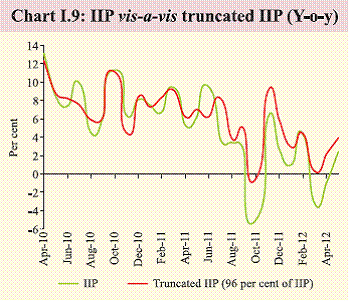
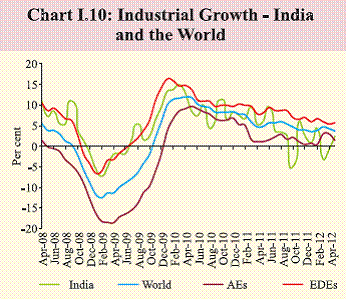
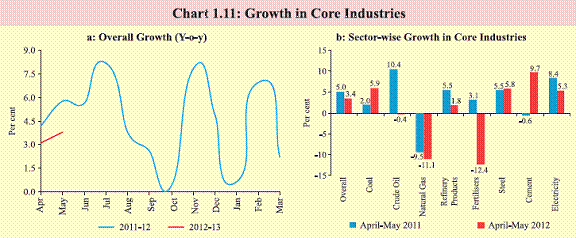
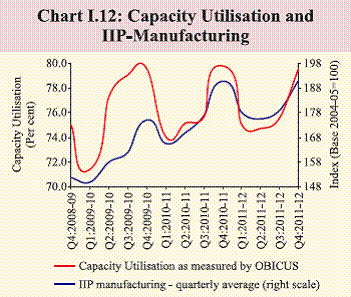
Contingency measures are required should monsoon fail I.13 Indian agriculture’s dependence on the monsoon has come down over the years and in recent episodes of deficient monsoons the output impact has been limited. The current level of stock of foodgrains is comfortable should foodgrains output be adversely impacted. At around 80.6 million tonnes in June 2012 (82 million tonnes in May 2012), stocks continue to remain one of the highest ever (Chart I.7). In fact, record stocks necessitate augmentation of storage capacity to avoid wastage of foodgrains. A short-term strategy to protect open stocks is being put in place. The government has also prepared contingency plans in the event of monsoon failure. This entails ensuring sufficient availability of all seeds, fodder, power and diesel, additional wage allocation under MGNREGA and sufficient funds under the National Disaster Relief Fund. An Inter- Ministerial Group has been constituted to review the situation on a weekly basis. On current assessment, rainfall during this year’s monsoon season has been slightly better than that during the drought year of 2009. I.14 Frequent price shocks with respect to high-value food items such as meat, fish, eggs, milk, and fruit and vegetables in the recent period reflect the persistence of supply-demand imbalances. To secure food and nutritional security, apart from increased production of these food items, an increased efficiency in post-harvest handling is essential. The development of vegetable clusters, terminal market complexes, cold chains, and warehouses under the public-private partnership model and operationalising warehouse receipts system are significant steps that hold immense potential for better post-harvest management and price discovery. I.15 To improve efficiency and develop a nation-wide agricultural market, 18 states/union territories have amended their Agriculture Produce Market Committee (APMC) Acts so far. Further reforms such as a single-point market fee system that facilitates the free movement of produce, reduction in price differences between the producer and the consumer market segments and popularising the practice of cleaning, grading, and packaging of the produce are expected to facilitate better market access by farmers, reduce transportation costs and increase the income of farmers. Industrial slowdown intensifies I.16 Growth in the index of industrial production (IIP) moderated sharply to 0.8 per cent during April-May 2012 as compared with 5.7 per cent during April-May 2011 (Table I.3). The slowdown in growth is reflected across all sectors. The mining sector continued to decline mainly due to regulatory and environmental issues affecting coal mining and the low output of natural gas from the Krishna-Godavari (KG) basin. I.17 The recent contraction in mining is constraining the growth in the manufacturing sector. Mining output has been contracting since Q2 of 2011-12 impacting manufacturing output adversely, despite increasing imports of industrial inputs such as coal and steel substituting for domestic supply of industrial inputs. An empirical analysis of monthly data from April 2010 onwards reveals that a one per cent increase in mining output, on an average, results in a 0.6 per cent increase in manufacturing output two periods ahead. Robust performance of the domestic mining sector which provides critical industrial inputs such as coal, natural gas and iron ore is, therefore, necessary for sustaining manufacturing growth. I.18 There has been a sharp moderation in manufacturing which was affected by sluggish investment activity, waning global demand and high input costs. While the industrial slowdown has been pervasive, it is compounded by the volatility in capital goods output (Chart I.8). Excluding the volatile items, the truncated IIP (96 per cent of IIP) growth in April-May 2012 is 3.0 per cent compared with 0.8 per cent growth in the general IIP (Chart I.9). Also, the growth pattern is skewed, with eight of the 22 industry groups showing negative growth during April-May 2012. I.19 By the use-based classification, moderation in growth is seen in all categories except consumer durables. The output of consumer non-durables has been declining since January 2012. The production of capital goods declined in April-May 2012. The declining domestic production of capital goods has been partly substituted by increase in capital goods imports. However, domestic production of capital goods has also suffered in the backdrop of weak investment environment. As these conditions persist, investment activity is likely to remain subdued. The modest performance of basic and intermediate goods has also added to the overall moderation in industrial activity. I.20 Revival of global growth is significant for industrial recovery. Domestic industrial growth has a strong correlation with global industrial growth. The correlation coefficient between domestic and global IIP during April 2008 to May 2012 is 0.75 (Chart I.10). Input bottlenecks and capacity constraints impacting core industries I.21 Growth of eight core industries decelerated to 3.4 per cent during April-May 2012 compared to 5.0 per cent during the corresponding period in the previous year. Output of crude oil, natural gas and fertilisers contracted while that of refinery products and electricity decelerated during April-May 2012. Deficit rainfall during the period also affected the generation of hydro power. The output of coal, cement and steel, however, showed improvement during the period (Chart 1.11). I.22 The government has initiated several measures to augment the production potential of core industries, in particular, mining, in the recent period. The improved performance of the coal industry could be partly attributed to this. However, several bottlenecks still afflict the mining sector output and a lot more needs to be done to remove structural constraints that have brought mining activity to a near standstill. I.23 The 17th round of the Order Books, Inventories and Capacity Utilisation Survey (http://www.rbi.org.in/OBICUS17) of the Reserve Bank for Q4 of 2011-12 indicates an improvement in the growth of new orders over the previous quarter, though the y-o-y growth was lower than in Q4 of the previous two years. Capacity utilisation level also improved in Q4 of 2011-12. The improvement is partly on account of seasonality but the level of capacity utilisation in the fourth quarter is fairly close to the peak level observed in the corresponding quarter of the previous year (Chart I.12). As expected, capacity utilisation has a strong comovement with IIP-manufacturing. Employment growth slows down I.24 The quarterly quick survey of employment conducted by the Labour Bureau in select sectors of the economy indicates that employment growth slowed considerably during Q4 of 2011-12 compared to the previous quarter and the corresponding quarter of the previous year. The quarter recorded the lowest rate of employment creation in two years, with all sectors barring IT/BPO and transport witnessing a decline in employment during the quarter. However, the employment of direct workers increased while that of contract workers declined during the quarter. Overall, employment generation in eight major industries during 2011-12 was lower than in the previous year by 14.3 per cent (Table I.4).
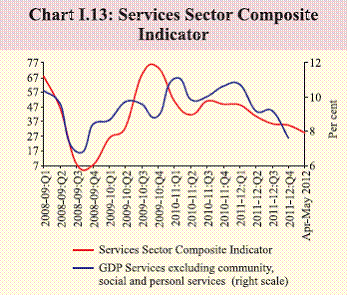
Services sector likely to moderate I.25 The slowdown in the industrial sector and the muted demand conditions have impacted the growth of the services sector. Various lead indicators of the services sector point towards deceleration in growth (Table I.5). Addition to the wireless subscriber base is moderating. This could be partly on account of mobile number portability reducing the need for multiple connections. A services sector composite indicator based on growth in indicators of construction, trade and transport, and finance, developed by the Reserve Bank shows continuation of slowdown in services in Q1 of 2012-13 (Chart I.13). The outlook for the services sector depends to a large extent on the revival in industrial growth and an improvement in the global economic conditions.
Growth in 2012-13 likely to be below potential I.26 Going forward, the outlook for growth looks weak and substantially affected by global headwinds, inflation and policy uncertainty. Although the south-west monsoon has been forecasted to be normal during 2012-13, its weak progress so far is a concern. The services sector is also showing signs of slowing down. Growth in communication services is likely to be low. The industrial sector, though improved in May, does not seem to be on course for sustained recovery. With growth slowing down, inflation is expected to moderate but demandsupply imbalances in respect of a number of items are limiting the price adjustment. Rupee depreciation in the recent period, however, is expected to support industrial and services sector activity through improved export competitiveness. |
||||||||||||||||||||||||||||||||||||||||||||||||||||||||||||||||||||||||||||||||||||||||||||||||||||||||||||||||||||||||||||||||||||||||||||||||||||||||||||||||||||||||||||||||||||||||||||||||||||||||||||||||||||||||||||||||||||||||||||||||||||||||||||||||||||||||||||||||||||||||||||||||||||||||||||||||||||||||||||||||||||||||||||||||||||||||||||||||||||||||||||||||||||||||||||||||||||||||||||||||||||||||||||||||||||||||||||||||||||||||||||||||||||||||||||||||||||||||||||||||||||
പേജ് അവസാനം അപ്ഡേറ്റ് ചെയ്തത്:


