 IST,
IST,
II Recent Economic Developments (Part 2 of 2)
Financial Markets
Financial Sector
External Sector
Bank Credit
2.56 Domestic credit (including non-SLR investments), at 12.2 per cent (net of merger effects) during 2002-03 (up to March 7, 2003), was higher than 10.9 per cent during the corresponding period of the previous year, driven by higher non-food credit offtake. The share of commercial credit (adjusted for merger effects) in domestic credit, at 58.5 per cent as on March 7, 2003, was the same as a year ago (Chart II.25). Net bank credit to the Government increased by 13.0 per cent during the current fiscal year, as compared with 14.0 per cent during the corresponding period of the previous year. The share of commercial banks in the total draft of resources by the Government from the banking sector during the year climbed to 136.6 per cent as on March 7, 2003, up from 95.2 per cent as on March 8, 2002 in view of the market demand for government paper. Bank credit to the commercial sector rose by 11.3 per cent (net of the merger impact) as compared with 9.2 per cent during the comparable period of 2001-02.
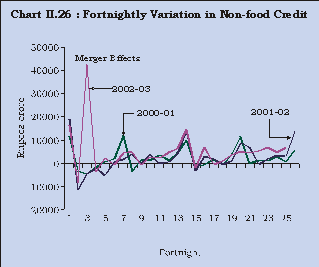
2.57 The growth in non-food credit (adjusted to exclude the merger impact and to include the non-SLR investments) was of 15.7 per cent during the current financial year (up to March 7, 2003) as compared with 9.9 per cent during the corresponding period of 2001-02. The incremental non-food credit in the latter half of the year (up to March 7, 2003) at Rs.57,150 crore was higher than Rs.40,503 crore during the comparable period of the previous year (Chart II.26). Reflecting lower procurement and increased off-take of foodgrains, food credit declined by Rs.4,262 crore during 2002-03 (up to March 7, 2003) as against an increase of Rs.13,913 crore recorded during the corresponding period of 2001-02 (Table 2.14).
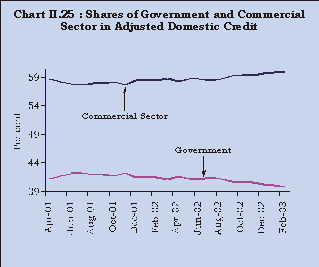
Table 2.14 : Select Banking Indicators : Financial Year Variations | |||||||||||||||||||||||||||||||||||||||
(Rupees Crore) | |||||||||||||||||||||||||||||||||||||||
Indicator | 2001-02 | 2000-01 | 2002-03P | 2001-02 | |||||||||||||||||||||||||||||||||||
(up to March 7) | (up to March 8) | ||||||||||||||||||||||||||||||||||||||
Absolute | Per cent | Absolute | Per cent | Absolute | Percent | Absolute | Per cent | ||||||||||||||||||||||||||||||||
1 | 2 | 3 | 4 | 5 | 6 | 7 | 8 | ||||||||||||||||||||||||||||||||
Aggregate Deposits | 1,40,742 | 14.6 | 1,49,273 | 18.4 | 1,74,660 | 15.8 | 1,29,040 | 13.4 | |||||||||||||||||||||||||||||||
15.2* | (12.0) | ||||||||||||||||||||||||||||||||||||||
Demand Deposits | 10,496 | 7.4 | 15,185 | 11.9 | 12,637 | 8.3 | 2,398 | 1.7 | |||||||||||||||||||||||||||||||
Time Deposits | 1,30,246 | 15.9 | 1,34,088 | 19.5 | 1,62,023 | 17.0 | 1,26,642 | 15.4 | |||||||||||||||||||||||||||||||
(12.6) | |||||||||||||||||||||||||||||||||||||||
Bank Credit | 78,289 | 15.3 | 75,476 | 17.3 | 1,24,899 | 21.2 | 64,699 | 12.7 | |||||||||||||||||||||||||||||||
Food Credit | 13,987 | 35.0 | 14,300 | 55.7 | -4,262 | -7.9 | 13,913 | 34.8 | |||||||||||||||||||||||||||||||
Non-food Credit | 64,302 | 13.6 | 61,176 | 14.9 | 1,29,162 | 24.1 | 50,786 | 10.8 | |||||||||||||||||||||||||||||||
Investments | 68,110 | 18.4 | 61,215 | 19.8 | 1,03,593 | 23.6 | 65,606 | 17.7 | |||||||||||||||||||||||||||||||
Government Securities | 71,141 | 20.9 | 61,579 | 22.1 | 1,04,097 | 25.3 | 68,291 | 20.1 | |||||||||||||||||||||||||||||||
Other Approved Securities | -3,032 | -10.1 | -364 | -1.2 | -504 | -1.9 | -2,685 | -8.9 | |||||||||||||||||||||||||||||||
P Provisional. | * | Net of IMDs. | Parenthetic figures are net of the impact of the mergers. | ||||||||||||||||||||||||||||||||||||
2.58 Scheduled commercial banks’ investments in government securities accelerated to 25.3 per cent during 2002-03 (up to March 7) from 20.1 per cent during the corresponding period in 2001-02. Commercial banks’ holding of government and other approved securities during the year so far has consistently been around 38.0 per cent of the net demand and time liabilities (NDTL) –much higher than the prescribed Statutory Liquidity Ratio (SLR) of 25.0 per cent. The excess liquid funds of the commercial banks flowing into the government securities market contributed to reducing the secondary market yields of Government securities across the spectrum (Chart II.27).
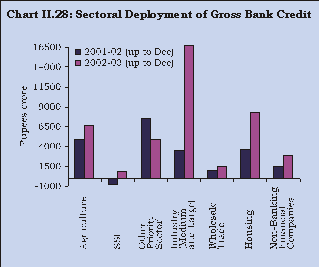
2.59 An analysis of the deployment of non-food gross bank credit of select scheduled commercial banks during 2002-03 (up to December) suggests that medium- and large-scale industry and housing emerged as the major drivers of growth of non-food credit during the year (Chart II.28 and Table 2.15).
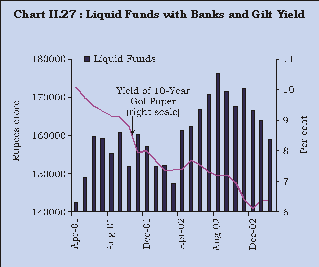
Table 2.15 : Sectoral and Industry-wise Deployment of Gross Bank Credit of Scheduled Commercial Banks (Fiscal Year Variations) | |||||||||||||||||||||||||||||||||||||||
(Rupees crore) | |||||||||||||||||||||||||||||||||||||||
2001-02 | 2002-03 | ||||||||||||||||||||||||||||||||||||||
Sector/Industry | up to December | up to December | |||||||||||||||||||||||||||||||||||||
Absolute | Per cent | Absolute | Per cent | ||||||||||||||||||||||||||||||||||||
1 | 2 | 3 | 4 | ||||||||||||||||||||||||||||||||||||
1. | Priority sector # | 11,515 | 7.5 | 12,420 | 7.1 | ||||||||||||||||||||||||||||||||||
o/w Agriculture | 4,893 | 9.4 | 6,673 | 11.0 | |||||||||||||||||||||||||||||||||||
Small Scale | -858 | -1.5 | 910 | 1.6 | |||||||||||||||||||||||||||||||||||
Others | 7,480 | 16.1 | 4,837 | 8.4 | |||||||||||||||||||||||||||||||||||
2. | Industry | 3,519 | 2.2 | 16,826 | 9.8 | ||||||||||||||||||||||||||||||||||
(Medium & Large) | |||||||||||||||||||||||||||||||||||||||
o/w Petroleum | -2,523 | -21.8 | -633 | -5.6 | |||||||||||||||||||||||||||||||||||
Infrastructure | 1,682 | 14.8 | 3,858 | 26.1 | |||||||||||||||||||||||||||||||||||
Cement | 214 | 5.6 | 750 | 17.8 | |||||||||||||||||||||||||||||||||||
Cotton Textiles | -1,279 | -9.7 | 1,680 | 14.3 | |||||||||||||||||||||||||||||||||||
Iron and Steel | 925 | 4.8 | 1,242 | 6.2 | |||||||||||||||||||||||||||||||||||
Coal | -43 | -4.2 | -71 | -5.0 | |||||||||||||||||||||||||||||||||||
Fertilisers | 403 | 7.7 | 564 | 10.3 | |||||||||||||||||||||||||||||||||||
Computer Software | 153 | 12.5 | 323 | 19.4 | |||||||||||||||||||||||||||||||||||
Gems & Jewellery | -173 | -2.6 | 952 | 14.7 | |||||||||||||||||||||||||||||||||||
3. | Housing | 3,672 | 22.7 | 8,287 | 37.1 | ||||||||||||||||||||||||||||||||||
4. | Wholesale Trade | 1,012 | 5.7 | 1,528 | 7.5 | ||||||||||||||||||||||||||||||||||
5. | Rest of the sectors | 8,928 | 11.5 | 10,480 | 11.3 | ||||||||||||||||||||||||||||||||||
Non-food Gross Bank Credit | 28,646 | 6.7 | 49,541 | 10.3 | |||||||||||||||||||||||||||||||||||
# | Excluding investments in eligible securities. | ||||||||||||||||||||||||||||||||||||||
Note : | Data are provisional and relate to select scheduled commercial banks which account for about 90 per cent of bank credit of all scheduled commercial banks. | ||||||||||||||||||||||||||||||||||||||
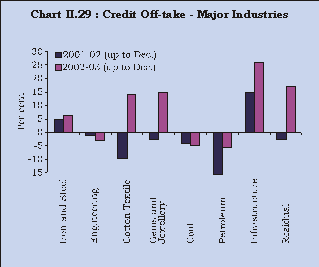
2.60 Amongst the medium- and large-scale industries, the higher credit off-take was fuelled mostly by cotton textiles, iron and steel, cement, computer software, gems and jewellery and infrastructure. It was, however, subdued in case of certain industries like engineering, sugar, coal and petroleum (Chart II.29).
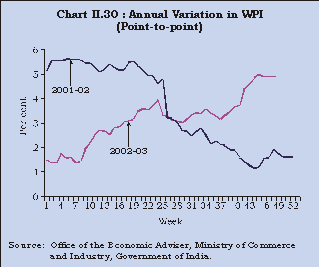
2.61 Inflation remained bening during 2002-03 (up to March 1, 2003). A number of factors,like a continuing weakness in global recovery, subdued global inflationary pressures, moderate recovery in investment demand, large buffer stocks and comfortable foreign exchange reserves, have contributed to the moderate inflation outcome during the year. The annual rate of inflation, measured as point-to-point variations in the wholesale price index (WPI), remained low up to mid-December 2002 (3.2 per cent as on December 14, 2002). However, it increased thereafter to touch 5.0 per cent on February 8, 2003 as compared with 1.2 per cent during the corresponding period of the previous year. This edging up of inflation is attributed partly to the the base effects and rising international oil prices (Chart II.30). The annual rate of inflation stood at 4.7 per cent on March 1, 2003.
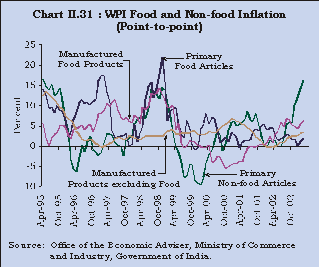
2.62 Despite the drought affecting kharif production substantially, the prices of food articles have risen only moderately. Better food management polices helped in containing the prices of food articles. However, in the post-kharif period, the primary non-food articles inflation has gone up substantially which could have some indirect impact on manufacturing prices (Chart II.31).
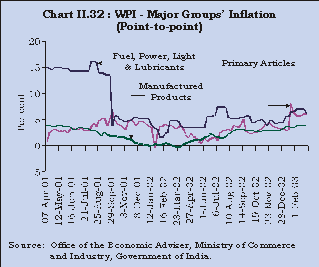
2.63 Manufacturing inflation recovered modestly from a trough in 2001-02, driven by an increase in prices of chemicals and chemical products, fertilisers, edible oils, man-made textiles and iron and steel. The industrial recovery appears to be driving up the prices of manufactured products as reflected in the rise in the prices of intermediate goods. While domestic prices of metals show co-movement with international price movements, the volatility has been relatively low. The annual primary articles inflation, on a point-to-point basis, increased during 2002-03 (Table 2.16 and Chart II.32). The shortfall in production of oilseeds due to poor rains led to a substantial rise in the prices of oilseeds and edible oils, necessitating imports of edible oils. Fuel group inflation, in contrast, is rising since December 2002 in consonance with hardening of international crude prices following mounting tensions in the Gulf.
Table 2.16 : Commodity-wise WPI Inflation (Point-to-point) | |||||||||||||||||||||||||||||||||||||||
(Per cent) | |||||||||||||||||||||||||||||||||||||||
Commodity | Weight | Annual Variation | |||||||||||||||||||||||||||||||||||||
2000 -01 | 2001- 02 | 2002-03 | |||||||||||||||||||||||||||||||||||||
(As on March | |||||||||||||||||||||||||||||||||||||||
1, 2003) | |||||||||||||||||||||||||||||||||||||||
1 | 2 | 3 | 4 | ||||||||||||||||||||||||||||||||||||
All Commodities | 100.0 | 4.9 | 1.6 | 4.7 | |||||||||||||||||||||||||||||||||||
I) | Primary Articles | 22.0 | -0.4 | 3.9 | 6.0 | ||||||||||||||||||||||||||||||||||
i) | Cereals | 4.4 | -5.5 | 0.8 | 4.6 | ||||||||||||||||||||||||||||||||||
ii) | Pulses | 0.6 | 7.1 | -3.3 | -2.6 | ||||||||||||||||||||||||||||||||||
iii) | Fruits & Vegetables | 2.9 | -2.9 | 14.4 | 1.0 | ||||||||||||||||||||||||||||||||||
iv) | Milk | 4.4 | 0.4 | 4.7 | 2.5 | ||||||||||||||||||||||||||||||||||
v) | Eggs, Fish and Meat | 2.2 | -2.1 | 9.3 | -4.3 | ||||||||||||||||||||||||||||||||||
vi) | Condiments and Spices | 0.7 | -13.8 | -0.2 | 5.1 | ||||||||||||||||||||||||||||||||||
viii) | Fibres | 1.5 | 7.4 | -17.9 | 24.9 | ||||||||||||||||||||||||||||||||||
ix) | Oilseeds | 2.7 | 2.8 | 6.8 | 23.4 | ||||||||||||||||||||||||||||||||||
II) | Fuel, Power, Light and Lubricants | 14.2 | 15.0 | 3.9 | 6.1 | ||||||||||||||||||||||||||||||||||
i) | Mineral Oils | 7.0 | 17.0 | 1.2 | 9.2 | ||||||||||||||||||||||||||||||||||
ii) | Electricity | 5.5 | 11.5 | 9.2 | 3.4 | ||||||||||||||||||||||||||||||||||
iii) | Coal Mining | 1.8 | 18.1 | -1.9 | 0.0 | ||||||||||||||||||||||||||||||||||
III) | Manufactured Products | 63.8 | 3.8 | 0.0 | 3.7 | ||||||||||||||||||||||||||||||||||
i) | Sugar, Khandsari and Gur | 3.9 | -6.1 | -3.2 | -12.6 | ||||||||||||||||||||||||||||||||||
ii) | Edible Oils | 2.8 | -4.8 | 12.5 | 22.2 | ||||||||||||||||||||||||||||||||||
iii) | Food Products | 11.5 | -3.7 | 0.3 | 5.1 | ||||||||||||||||||||||||||||||||||
iv) | Cotton Textiles | 4.2 | 6.3 | -6.7 | 4.7 | ||||||||||||||||||||||||||||||||||
v) | Man-made Textiles | 4.7 | 2.0 | -4.7 | 14.5 | ||||||||||||||||||||||||||||||||||
vi) | Chemicals and Chemical Products | 11.9 | 4.0 | 2.5 | 2.5 | ||||||||||||||||||||||||||||||||||
vii) | Fertilisers | 3.7 | 3.4 | 3.6 | 1.7 | ||||||||||||||||||||||||||||||||||
viii) | Urea-N-Content | 2.2 | 1.8 | 4.7 | 1.1 | ||||||||||||||||||||||||||||||||||
ix) | Cement | 1.7 | 20.3 | -4.7 | 1.4 | ||||||||||||||||||||||||||||||||||
x) | Iron and Steel | 3.6 | 1.3 | 0.0 | 6.8 | ||||||||||||||||||||||||||||||||||
xi) | Non-electrical Machinery | 3.4 | 6.9 | 5.4 | 2.7 | ||||||||||||||||||||||||||||||||||
xii) | Electrical Machinery | 5.0 | 11.8 | -1.1 | -0.3 | ||||||||||||||||||||||||||||||||||
xiii) | Transport Equipment and Parts | 4.3 | 5.8 | 1.3 | -1.3 | ||||||||||||||||||||||||||||||||||
Source : | Office of the Economic Adviser, Ministry of Commerce and Industry, Government of India. | ||||||||||||||||||||||||||||||||||||||
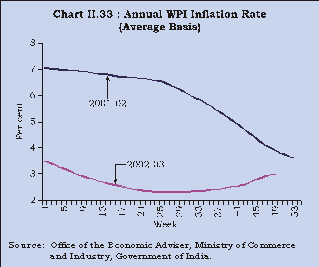
2.64 The annual average inflation, measured on the basis of annual percentage variation in the average wholesale price index, a better indicator of underlying inflation pressures, trended downwards to touch 2.3 per cent on October 12, 2002 and rose thereafter, ruling at 3.0 per cent as on March 1, 2003. The annual average WPI inflation during the comparable period of 2001-02 stood at 3.9 per cent (Chart II.33).
2.65 During 2002-03 (up to March 1, 2003), on an average basis, the primary articles and fuel group inflation decelerated to 3.2 per cent and 4.9 per cent, respectively, from 3.7 per cent and 8.9 per cent during the corresponding period last year. On the other hand, manufactured products inflation increased moderately to 2.4 per cent from 1.8 per cent during the same period. An analysis of the weighted contributions of major groups of WPI (on an average basis) during 2002-03 so far indicates that, while the contribution of the manufactured products group increased to 44.6 per cent from 29.6 per cent during the corresponding period of the previous year, that of the fuel group declined to 31.6 per cent from 46.7 per cent over the same period. The weighted contributions of primary articles group was steady at around 23.8 per cent during the same period (Chart II.34).

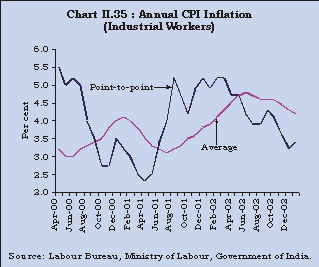
2.66 At the retail level, consumer price inflation, as measured by the annual variation in the consumer price index for industrial workers (CPI-IW), on a point-to-point basis, decelerated to 3.4 per cent in January 2003 from 4.9 per cent in January 2002. On an average basis, however, consumer inflation stood higher at 4.2 per cent as compared with 3.9 per cent a year ago (Chart II.35).
2.67 Inflationary pressures generally remain subdued across the globe during the year. International commodity prices recovered in the second half of 2002 after bottoming out in late 2001 from a prolonged decline in the aftermath of the Asian crisis. Non-fuel commodity prices, however, remain bound by weak demand and inventory drawdown. Since early August 2002, spot oil prices have risen markedly owing to concerns about a further deterioration in the geopolitical situation in the Middle East. Thus, the major risk to the current benign outlook for inflation hinges upon the prospects for uncertainty relating to the future movements in international oil prices.
2.68 Orderly conditions prevailed in the financial markets during 2002-03 (Chart II.36). The presence of adequate liquidity conditions and moderation of inflation expectations enabled a softening of interest rates. The foreign exchange market continued to witness excess supply conditions. The capital market began to recover from November 2002 after being adversely affected by a number of external shocks, including border tensions. At the same time, the Reserve Bank carried forward structural reforms to develop the various financial market segments with a view to enhancing financial stability and improving allocative efficiency.
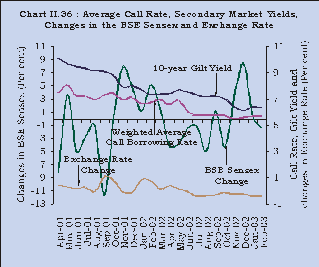
2.69 Reflecting ample liquidity conditions during 2002-03, there was a softening of interest rates across the various segments of the financial market, although the pace of reduction of interest rates was not necessarily uniform. At the short end of the market, the average overnight call rates declined from 6.58 per cent in April 2002 to 5.71 per cent by February 2003 and further to 5.21 per cent on March 17, 2003.
The primary implicit yields of both 91-day and 364-day Treasury Bills declined to 5.89 per cent as on March 19, 2003 from 5.97 per cent and 6.09 per cent, respectively, as on April 3, 2003. At the longer end of the spectrum, the secondary market yields on government securities in the maturity range of 10 to 20 years softened from 7.37-7.91 per cent in April 2002 to 6.34-7.05 per cent by February 2003. Deposit rates of public sector commercial banks with a maturity of more than one year softened from 7.25-8.75 per cent during March 2002 to 5.25-7.00 per cent by end-February 2003. However, the fall in prime lending rates of the public sector banks from 10.0-12.5 per cent during March 2002 to 9.00-12.25 per cent by end-February 2003 did not match the fall in yields in government securities.
Call Money Market
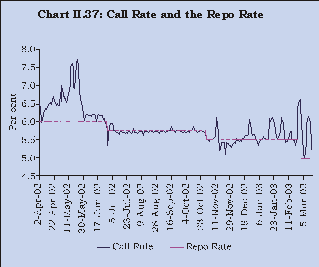
2.70 The call/notice money market was orderly and stable during 2002-03 so far. The weighted average call money borrowing rates remained, by and large, within the informal corridor of the repo and reverse repo rate. After edging up during the first two months of the fiscal year, the weighted average call money borrowing rate softened thereafter, occasionally dipping below the repo rate (Chart II.37).
2.71 Various reform measures were undertaken in the call money market during the year. The phasing out process of non-banks from the call/notice money market began with mapping of a four-stage exit of non-banks from this market. During the first stage, which commenced with effect from May 5, 2001, non-banks were allowed to lend, on an average, up to 85 per cent of their average daily lending in the call/notice market during 2000-01 in a reporting fortnight. Such limits would come down to 75 per cent as part of stage II from a date to be notified later by the Reserve Bank when the Negotiated Dealing System/Clearing Corporation of India Limited (CCIL) becomes fully operational and widely accessed. Call lending by corporates was disallowed effective July 1, 2001. The Reserve Bank instituted a daily call money borrowing ceiling of 2 per cent of aggregate deposits (as at the end of March of the previous financial year) for urban co-operative banks, which was extended to State Co-operative Banks (SCBs) and District Central Co-operative Banks (DCCBs). In respect of scheduled commercial banks, effective from the fortnight beginning October 5, 2002, the fortnightly average ceiling for call/notice money lending for banks was stipulated at 50 per cent of their owned funds with the daily lending ceiling fixed at 100 per cent of their owned funds. The fortnightly average ceiling for call/ notice money borrowing for banks was placed at 150 per cent of their owned funds or 2 per cent of aggregate deposits, whichever is higher, as at end-March of the preceding financial year. The daily borrowing ceiling was specified at 250 per cent of their owned funds. Simultaneously, primary dealers were permitted to lend in the call/notice money market up to 25 per cent of their net owned funds. Effective from the fortnight beginning December 14, 2002, the fortnightly average ceiling for call/notice money lending for banks was further scaled down to 25 per cent of their owned funds and the daily lending ceiling to 50 per cent of their owned funds. The fortnightly average ceiling for call/notice money borrowing for banks is 100 per cent of their owned funds or 2 per cent of aggregate deposits, whichever is higher, as at end-March of the preceding financial year with the daily borrowing ceiling at 125 per cent of their owned funds.
2.72 The progression of money market reforms was smooth with the monthly weighted average call money borrowing rates steadily softening as the current financial year has progressed.
2.73 The fiscal year 2002-03 commenced with easy liquidity conditions as reflected in the substantial amount of repo bids received under the LAF auctions, pulling call rates below the repo rate during the first week of April 2001. The absorption of surplus liquidity through both LAF auctions as well as OMO outright sales and the launching of the government borrowing programme balanced the money market liquidity, reverting the call money rates above the repo rate. The pick up in the tempo of the Government borrowing combined with border tensions in May 2002 tightened liquidity conditions, firming up the weighted average call money borrowing rates to 7.7 per cent on May 22, 2002.
2.74 The Reserve Bank’s primary market operations, monetary easing and redemption inflows comforted the money markets in June 2002. The Reserve Bank undertook devolvements and private placements of government primary issuances and advanced the date of the CRR cut of 50 basis points to 5.0 per cent, by a fortnight to June 1, 2002. These measures as well as government bond redemptions softened call money rates steadily to a band of 6.0-6.2 per cent during end-May to June 23, 2002. The easy liquidity conditions also reflected the fact that the repo cut-off rate was brought down by 25 basis points to 5.75 per cent on June 27, 2002.
2.75 The banks appeared to have factored in the two-stage prudential restrictions on their call money market exposures during the third quarter of 2002-03 quite smoothly as the call money borrowing rates hovered mostly at or below the repo rate. Prudential limits on borrowings and lendings of scheduled commercial banks and on lendings of primary dealers in the call/notice money market became operative, effective October 5, 2002. Simultaneously, the collateralised lending facility available to banks and primary dealers was phased out.
2.76 The repo rate reduction on October 30, 2002 by 25 basis points to 5.5 per cent, expectedly brought down the call money rate. However, the call money rates exhibited some volatility with the weighted average borrowing rate inching up above 6.0 per cent on November 12, 2002 reflecting, inter alia, outflows on account of a gilt auction as well as a 13-day repo auction at a time when banks were making preparations towards graduating for maintaining a minimum of 80 per cent of eligible CRR balances on a daily basis. The markets, however, soon stabilised with the weighted average call money borrowing rate coming down to 5.27 per cent on November 30, 2002.
2.77 The second stage of prudential restrictions on call money lendings and borrowings of banks became effective fortnight beginning December 14, 2002. The usual advance tax outflows and State loan auctions in December 2002 firmed up call rates temporarily. There was some temporary tightness of liquidity in January 2003 as a result of open market sales. The call rates, however, soon turned easy on account of augmenting of money market liquidity through redemptions, coupon inflows and some selling of government securities with the waning of expectations of any reduction in policy interest rates and war tensions in the Middle East. There was some edging up of call rates towards the last week of February 2003 on account of some outflows of funds towards State loan auctions. Although the repo rate was reduced by 50 basis points to 5.0 per cent, a second round of State loan auctions pushed call rates to 6.2 per cent as on March 12, 2003. The call rate eased thereafter to 5.21 per cent as on March 17, 2003.
Government Securities Market
2.78 The Reserve Bank continued to take measures to deepen and widen the government securities markets. As a step towards enhancing transparency, an indicative calendar for the issuance of marketable dated Government securities for the first half of year 2002-03 was issued on March 27, 2002 to enable investors to plan their investments in a better manner. The calendar was generally adhered to with some minor deviations. In continuation of this, the Reserve Bank announced the calendar for the second half-year (October-March) on September 18, 2002 in consultation with the Government. In future, the calendar would be issued every half-year. A bond with put and call options (6.72 per cent Government Stock 2007/12) exercisable on or after 5 years from the date of issue was issued for the first time. The Reserve Bank issued a 30-year paper in July 2002, in line with the policy of elongating the maturity structure of dated securities.
2.79 Stable and soft money market interest rates, ample liquidity conditions and moderate inflation expectations provided the conditions for a continued rally in the prices of government securities through most of the year up to mid-January 2003. The surplus liquidity in the banking system drove down gilt yields during 2002-03 (up to mid-January 2003). The outlook on gilts turned bearish during the second half of January due to a host of negative factors like the rising oil prices, a worsening situation in the Middle East, a sharp rise in domestic WPI inflation rate and indications of a recovery in industrial production.
2.80 Yields fell in the usual flush of early April liquidity but started firming up by May 2002, with the tightening of liquidity conditions, a lower than expected CRR reduction in the Monetary and Credit Policy of April 2002 and as the market expectation of a Bank Rate cut did not materialise (Chart II.38). Besides, border tensions also affected market sentiment by end-May. This was reflected in a drop in the market turnover. The rise in yields abated as market sentiment improved after the Reserve Bank advanced the CRR reduction by a fortnight in June 2002. As monetary conditions continued to ease mainly due to a sharp rise in capital inflows, yields continuously declined till mid-January 2003. The investor interest in gilts was further strengthened by the monetary easing in the Mid-Term Review of the Monetary and Credit Policy in October 2002. As prices continued to rally, transaction volumes also steadily increased, reaching a peak in November 2002. The OMO sales as well as renewed tensions in the Middle East in January 2003, however, halted the rally and the yields have somewhat firmed up since mid-January 2003. Gilt prices rallied sharply after the Union Budget 2003-04 with a reduction in the repo rate by 50 basis points to 5.0 per cent on February 28, 2003. However, continuing uncertainties and the usual year-end profit booking led to the reversal of post-Budget gains in early March 2003.
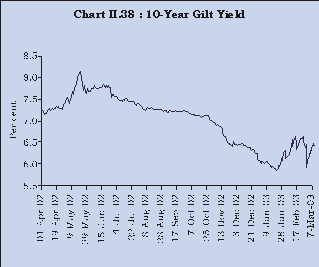
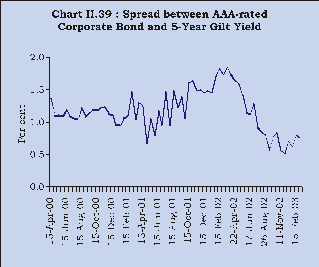
2.81 The average decline of yields in the 2-5 year segment has been of the order of 23 basis points while the same for the 6-10 year and 11-20 year sector has fallen by 83 and 89 basis points, respectively. The 10-year yield rose by about 85 basis points to 8.13 per cent by the third week of May 2002 from 7.28 per cent at the beginning of the current financial year and subsequently eased to 6.34 per cent at the end of February 2003. While yields have declined across the maturity spectrum, there has also been a flattening of the yield curve during the year which could be reflecting a combination of factors including a demand for longer-term paper in the face of sustained easy liquidity and subdued inflation expectations. The spread between AAA-rated corporate bonds and government securities, which widened during 2001-02, narrowed by March 2003 (Chart II.39).
Foreign Exchange Market
2.82 The Indian Rupee generally exhibited an appreciating trend with respect to the US dollar during 2002-03 due to excess supply conditions on account of steady foreign exchange inflows from exporters, foreign direct investment as well as remittances by NRIs coupled with modest corporate demand. The slow growth in imports continued despite some industrial recovery, exacerbating the appreciating pressure. The exchange rate of the Indian Rupee vis à-vis the US dollar moved within a range of Rs.47.63 Rs.49.06 per US dollar during 2002-03 (up to March 13, 2003) (Chart II.40). On the basis of monthly average exchange rates, the Indian Rupee appreciated by 2.5 per cent from Rs.48.92 per US dollar in April 2002 to Rs.47.73 per US dollar in February 2003.
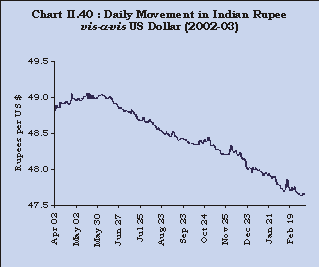
2.83 The Rupee remained broadly stable during the first quarter of 2002-03, except for a brief period of uncertainty on account of concerns regarding higher global oil prices and border tensions in May 2002. There was appreciating pressure since June 2002 on account of the positive sentiment created by easing of border tensions and the continued weakness of US dollar against other major international currencies on account of doubts over the strength of the US recovery and a series of corporate accounting scandals in the US. The strengthening of the Rupee continued in the following months due to heavy US dollar inflows mainly in the form of foreign direct investments and exporter remittances. This prompted the Reserve Bank to mop up surplus US dollars in the market in order to prevent excessive appreciation of the Rupee.
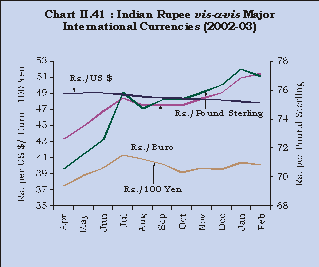
2.84 Cross-currency movements reveal that due to depreciation of the US dollar against major currencies, the Rupee depreciated steadily against the Euro and the Pound Sterling during 2002-03 (up to February) (Chart II.41). In terms of monthly average exchange rates, while the Rupee depreciated by 8.3 per cent against the Pound Sterling, its depreciation against the Euro was sharper at 15.8 per cent during the 11-month period. The Euro became costlier than the US dollar in terms of Rupees for the first time on November 7, 2002, with the value of Euro rising to Rs.48.54 per Euro as against Rs.48.33 per US dollar on the same day. The Rupee depreciated against the Japanese Yen by 6.6 per cent during the same period.
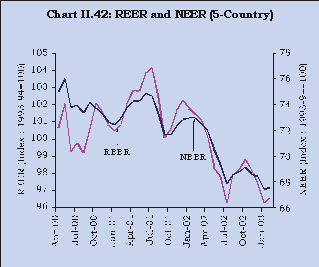
2.85 The depreciation of the Rupee against major currencies is also reflected in the movements in the nominal effective exchange rate (NEER) and real effective exchange rate (REER) (Chart II.42). The REER of the Indian Rupee depreciates with the depreciation in the US dollar against the major currencies as well as depreciation of the Indian rupee against the US dollar. Further, the REER also depreciates with a fall in inflation in India as compared with other major economies included in the basket. Despite the recent appreciation of rupee against the US dollar, the NEER and REER depreciated reflecting a depreciation of the US dollar against the major currencies. Inflation remained subdued in India as well as abroad.
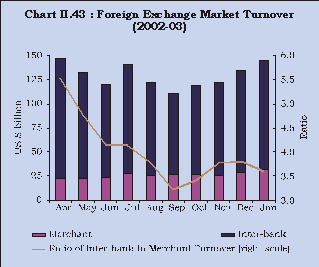
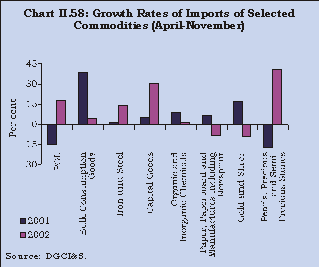
2.86 The Clearing Corporation of India (CCIL), which commenced its operations from February 15, 2002 in clearing and settlement of transactions in government securities, also started settlement of foreign exchange transactions through multilateral netting of member obligations for both the Indian Rupee and US dollar. This process significantly reduces individual funding requirements for every member as well as liquidity risk in the market. The average monthly total turnover in the foreign exchange market marginally increased to US $ 129.2 billion during 2002-03 (up to January 2003) from US $ 118.5 billion in 2001-02. The monthly turnover remained within the range of US $ 22.5-31.7 billion in the merchant segment and in a range of US $ 84.1-124.3 billion in the inter-bank market during 2002-03 (up to January 2003) (Chart II.43). Reflective of the stable foreign exchange market conditions, the ratio of inter-bank to merchant turnover fell steadily from 5.5 per cent in April 2002 to 3.6 per cent in January 2003.
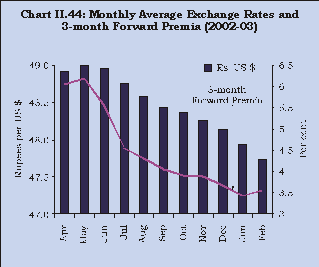
2.87 In the swap segment of the foreign exchange market, the forward premia hardened for all the three maturities (one- three- and six-month) during April-May 2002, partly reflecting uncertainties generated by border tensions. With the return of stability in the spot segment of the foreign exchange market resulting from steady supply of US dollar, the forward premia for all three maturities declined steadily during the next nine months (June 2002 – February 2003). In terms of monthly averages, the three-month and the six-month forward premia declined from 6.23 per cent and 6.19 per cent, respectively, in May 2002 to 3.55 per cent, each, in February 2003 (Chart II.44).
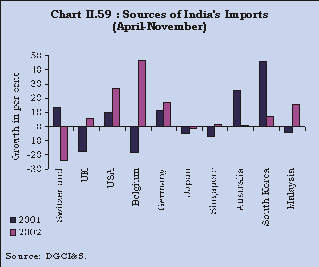
Capital Market
2.88 During 2002-03 so far, both the primary and secondary segments of the capital market remained generally subdued on account of several domestic and external factors. Financial assistance sanctioned and disbursed by the all-India Financial Institutions (AIFIs) also declined sharply.
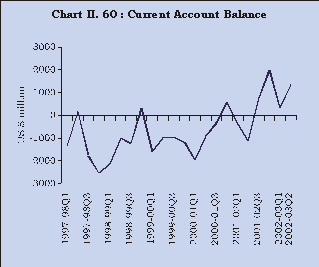
Primary Market
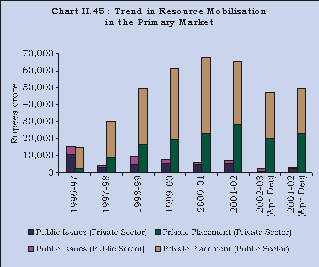
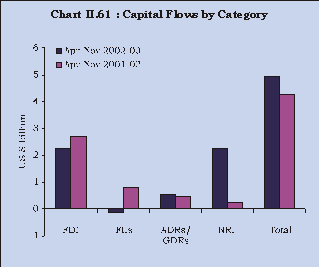
2.89 The public issues market continued to witness depressed conditions during 2002-03 (up to January 2003) as the resource mobilisation aggregating Rs.3,259 crore from 12 issues was lower than Rs.4,375 crore raised through 17 issues during 2001- 02 (up to January 2002) and Rs.7,112 crore raised through 24 issues during 2001-02 (Chart II.45). During 2002-03 (up to January 2003), there were five issues aggregating Rs.1,049 crore from the non-Government public limited companies (private sector) and seven issues aggregating Rs.2,210 crore by the public sector entities in the financial sector. The entire resource mobilisation during 2001-02 (up to January 2002) was accounted for by private sector companies.
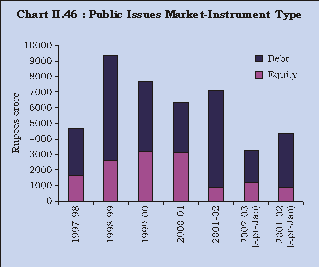
2.90 The share of equity in the total resource mobilisation increased sharply to 37.0 per cent during 2002-03 (up to January 2003) as compared with 19.6 per cent during the corresponding period of the previous year, following floatation of equity issues from the banks in the public sector (Chart II.46). All the issues during 2002-03 (up to January 2003) were mega issues (Rs.100 crore and above) (except one issue of Rs.36 crore) with the average size of the issues correspondingly working out to Rs.272 crore as compared with Rs.257 crore during the corresponding period of the previous year.
2.91 The private placement market, which has become quite popular in recent years, witnessed some slowdown in resource mobilisation during April-December, 2002. The resource mobilisation from the private placement market, at Rs.46,647 crore was 5.6 per cent lower than Rs.49,437 crore raised during the comparable period of the previous year due to a decline in resource mobilisation by the AIFIs and state-level undertakings in the public sector.
2.92 Resource mobilisation through ADRs, GDRs and FCCBs from the international capital market, at Rs.3,314 crore during 2002-03 (up to January 2003), was 41.5 per cent higher than Rs.2,341 crore raised during the corresponding period of the previous year.
2.93 According to the data available with SEBI, net resource mobilisation by mutual funds (including UTI), at Rs.16,612 crore during 2002-03 (up to January 2003), was 45.9 per cent higher than Rs.11,389 crore during the comparable period of the previous year, mainly due to the sizeable funds raised under debt-oriented schemes. The Unit Trust of India (UTI), however, witnessed a net outflow of Rs.8,720 crore during 2002-03 (up to January 2003).
2.94 Financial assistance sanctioned and disbursed by the term-lending institutions, at Rs.13,933 crore and Rs.12,185 crore, respectively, declined sharply by 49.7 per cent and 45.6 per cent, respectively, during 2002-03 (up to January 2003) as compared with the declines of 24.8 per cent and 11.5 per cent (excluding ICICI), respectively, during the corresponding period of the previous year.
Secondary Market
2.95 The stock markets witnessed subdued conditions due to several factors, such as, border tensions, inadequate monsoon and subdued trends in international markets, especially following the discovery of accounting discrepancies in some major US companies and international disturbances (Chart II.47).
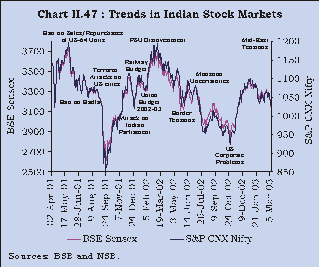
2.96 The stock markets began 2002-03 on a positive note, led by a rally in PSU scrips following disinvestment initiatives by the Government but soon turned bearish by end-May 2002 as border tensions mounted. The markets recovered partly in early June 2002 as border tensions abated but the BSE Sensex fell below the 3000-mark by end-July 2002, reflecting monsoon uncertainties and weakening of international markets following the discovery of accounting discrepancies in large US firms (Chart II.48).
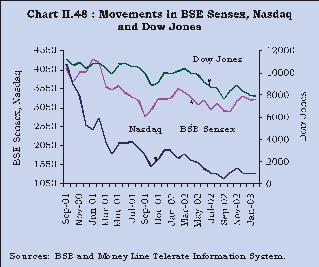
2.97 After a brief spell of recovery in August, the markets declined again by October, on account of lower than expected quarterly results and uncertainties regarding PSU disinvestment. The market sentiment turned positive by early November 2002 mainly due to a revival of PSU disinvestment initiatives by the Government, bargain buying by institutional investors, especially in technology scrips and a revival in international markets. A downtrend set in again from end-January 2003 as the market sentiment was affected by the Middle East crisis. Bank scrips were in the limelight following the permission to increase FDI in private sector banks and increase in profitability. PSU stocks also became attractive on account of disinvestment initiatives by the Central Government. In contrast with a 5.4 per cent decline in the BSE Sensex during 2002-03 (up to February 2003), the BSE-500 registered only a marginal decline of 0.3 per cent over the same period reflecting buying interest in PSU scrips and mid-caps outside the ambit of the narrow blue-chip indices.
2.98 The volatility in share prices, as measured by the coefficient of variation, at 5.0 per cent during 2002- 03 (up to February 2003), was lower than 7.2 per cent during the corresponding period of the previous year. Foreign institutional investors’ (FIIs) net investments in equity markets declined to Rs.2,376 crore during 2002-03 (up to February 2003) as compared with Rs.5,785 crore during the corresponding period of the preceding year. The mutual funds remained net sellers in equity markets during 2002-03 so far.
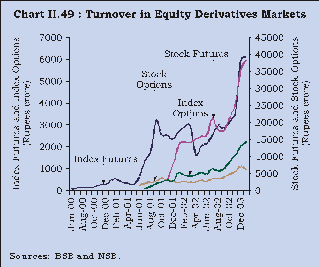
2.99 The derivative segment continued to expand with the total turnover rising to Rs.50,080 crore during February 2003 from Rs.20,535 crore during March 2002 (Chart II.49).
Scheduled Commercial Bank s 2
2.100 The operating profits of scheduled commercial banks (SCBs) during 2001-02 increased by 50.9 per cent to Rs.29,814 crore. Notwithstanding higher provisioning and contingencies, the net profits in 2001-02 increased by 80.7 per cent to Rs.11,572 crore.
2.101 This increase in bank profitability may be attributed to a softer interest regime resulting in gains from treasury operations coupled with containment in operating expenses. Among the major financial parameters, the growth in income during 2001-02 was 14.4 per cent while that in expenditure was 11.0 per cent. The growth in other income accelerated to 41.6 per cent from 8.8 per cent in the previous year while operating expenditure declined by 1.4 per cent to Rs.33,696 crore, thereby boosting the net profit. The ratio of net profits to total assets of SCBs increased to 0.75 per cent as at end-March 2002 from 0.49 per cent, a year ago. The decline in lending rates together with an increase in competitive pressures impacted on the bottomline as reflected in the decline in net interest income to 2.6 per cent as at end-March 2002 from 2.8 per cent as at end-March 2001 (Chart II.50).
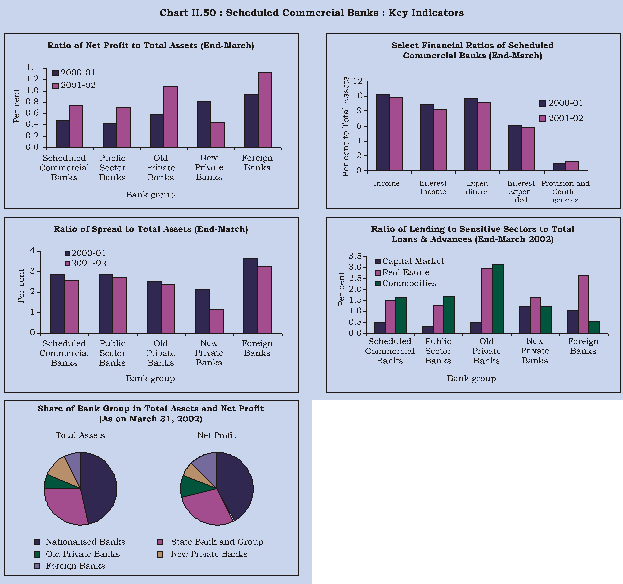
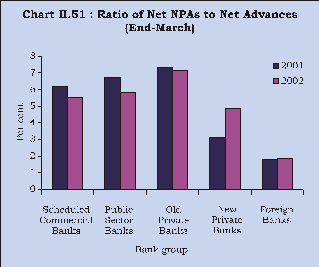
2.102 The ratio of gross non-performing assets (NPAs) to total assets of SCBs declined to 4.6 per cent as at end-March 2002 from 4.9 per cent as at end-March 2001, while net NPAs to total assets declined to 2.3 per cent from 2.5 per cent. For the same period, the ratio of gross NPAs to gross advances declined to 10.4 per cent from 11.4 per cent in 2000-01 and net NPAs to net advances declined to 5.5 per cent from 6.2 per cent (Chart II.51).
2.103 As at end-March 2002, 85 out of 97 SCBs recorded a capital to risk-weighted asset ratio (CRAR) in excess of 10 per cent, seven banks had CRAR between 9 per cent and 10 per cent, while five banks had CRAR below the 9 per cent mark. The corresponding distribution of banks in the previous year was 84 banks, 11 banks and five banks, respectively.
2.104 The Reserve Bank undertook several measures to enhance soundness of the banking sector alongside the deregulation of interest rates and balance sheet restrictions, especially in respect of the investment portfolio (Table 2.17). The Mid-Term Review of Monetary and Credit Policy of October 2002 revised norms for loan classification, according to which, effective March 31, 2005, an asset would be classified as doubtful if it remained in the substandard category for 12 months (instead of 18 months earlier). The additional provision need to be phased in over a four-year period, commencing from the year ending March 31, 2005.
Table 2.17 : Changes in the Regulatory Framework | |||||||||||||||||||||||||||||||||||||||
Variable | 1992- | 1993- | 1994- | 1995- | 1996- | 1997- | 1998- | 1999- | 2000- | 2001- | |||||||||||||||||||||||||||||
1 | 2 | 3 | 4 | 5 | 6 | 7 | 8 | 9 | 10 | ||||||||||||||||||||||||||||||
1. | CRAR | ||||||||||||||||||||||||||||||||||||||
(per cent to risk | |||||||||||||||||||||||||||||||||||||||
weighted assets) | |||||||||||||||||||||||||||||||||||||||
Domestic Banks with | 4 | 8 | 8 | 8 | 8 | 8 | 8 | 9 | 9 | 9 | |||||||||||||||||||||||||||||
International Business | |||||||||||||||||||||||||||||||||||||||
Other Domestic Banks | 4 | 4 | 4 | 8 | 8 | 8 | 8 | 9 | 9 | 9 | |||||||||||||||||||||||||||||
Foreign Banks | 8 | 8 | 8 | 8 | 8 | 8 | 8 | 9 | 9 | 9 | |||||||||||||||||||||||||||||
2. | Non-performing Assets | ||||||||||||||||||||||||||||||||||||||
(period overdue | |||||||||||||||||||||||||||||||||||||||
in quarters) | |||||||||||||||||||||||||||||||||||||||
Sub-standard Assets | 4 | 3 | 2 | 2 | 2 | 2 | 2 | 2 | 2 | 2# | |||||||||||||||||||||||||||||
Doubtful Assets | 8 | 8 | 8 | 8 | 8 | 8 | 8 | 8 | 6 | 6 ## | |||||||||||||||||||||||||||||
3. | Provisioning | ||||||||||||||||||||||||||||||||||||||
Requirements | |||||||||||||||||||||||||||||||||||||||
(per cent to | |||||||||||||||||||||||||||||||||||||||
corresponding asset) | |||||||||||||||||||||||||||||||||||||||
Standard Assets * | 0.25 | 0.25 | 0.25 | ||||||||||||||||||||||||||||||||||||
Sub standard Assets | 10 | 10 | 10 | 10 | 10 | 10 | 10 | 10 | 10 | 10 | |||||||||||||||||||||||||||||
Doubtful Assets | |||||||||||||||||||||||||||||||||||||||
Secured portion** | 20-50 | 20-50 | 20-50 | 20-50 | 20-50 | 20-50 | 20-50 | 20-50 | 20-50 | 20-50 | |||||||||||||||||||||||||||||
Unsecured portion | 100 | 100 | 100 | 100 | 100 | 100 | 100 | 100 | 100 | 100 | |||||||||||||||||||||||||||||
Loss Assets | 100 | 100 | 100 | 100 | 100 | 100 | 100 | 100 | 100 | 100 | |||||||||||||||||||||||||||||
4. | Mark to Market | 30 | 30 | 30 | 40 | 50 | 60 | 70 | 75 | $$ | $$ | ||||||||||||||||||||||||||||
(per cent) | |||||||||||||||||||||||||||||||||||||||
# | 1 quarter from the year ending March 31, 2004 | ||||||||||||||||||||||||||||||||||||||
## | 4 quarters effective March 31, 2005 | ||||||||||||||||||||||||||||||||||||||
* | on global portfolio basis | ||||||||||||||||||||||||||||||||||||||
** | 20 per cent if a doubtful asset (DA) = 1 year; 30 per cent if DA of 1-3 years; 50 per cent if DA>3 years. | ||||||||||||||||||||||||||||||||||||||
$$ | According to the revised classification norms for investment portfolio (including SLR and non-SLR securities) effective half-year | ||||||||||||||||||||||||||||||||||||||
ended September 30, 2000, banks should classify the same into three categories, viz., Held to Maturity (HTM), Available for Sale | |||||||||||||||||||||||||||||||||||||||
(AFS) and Held for Trading (HFT) categories. The investments under HTM should not exceed 25 per cent of banks’ total investments. | |||||||||||||||||||||||||||||||||||||||
Co-operative Banks
2.105 At the end of March 2002, the number of urban co-operative banks (UCBs) was 2,090. Information on the financial performance of UCBs relating to profits/ losses are available for 1,854 banks, which roughly cover 88.7 per cent of the total UCBs. Of these, 1,629 UCBs registered profits while the rest incurred losses. The percentage of profitable UCBs among the reporting banks increased to 87.9 per cent during 2001-02 from 83.9 per cent in the previous year.
Scheduled Urban Co-operative Banks
2.106 As on March 31, 2002, there were 52 scheduled UCBs as compared with 51 scheduled UCBs in the previous year. During 2001-02, the total income increased by 2.6 per cent notwithstanding the decline in interest income by 2.9 per cent. The total expenditure of the scheduled UCBs declined by 9.9 per cent in 2001-02. Consequently, the operating profit increased by 1.3 per cent.
Financial Institutions
2.107 The profitability analysis of the nine FIs 3 indicates that the combined net profits of these institutions declined by 46.5 per cent during 2001-02. This reflected a decline in income by 3.2 per cent and a concomitant increase in expenditure by 4.8 per cent, mainly due to a sharp increase of 97.3 per cent in provisions. The industrial slowdown and exposure to certain industries has adversely affected the quality of assets of FIs. The spread (net interest income) as a ratio of total assets worsened from 1.55 per cent in 2000-01 to 1.27 per cent in 2001-02. The share of net NPAs in net loans as at end-March 2002 was highest in the case of Industrial Investment Bank of India (IIBI) at 24.1 per cent, followed by Industrial Finance Corporation of India (IFCI) (22.5 per cent), Tourism Finance Corporation of India (TFCI) (20.2 per cent) and Industrial Development Bank of India (IDBI) (13.4 per cent). The CRAR of all institutions, excepting IFCI (3.1 per cent), were well above the benchmark minimum of 9 per cent.
Non-Banking Financial Companies
2.108 As at end-March 2001, the total outstanding public deposits of the 1,012 deposit holding companies (both registered and unregistered) aggregated Rs.18,243 crore, equivalent to 1.7 per cent of the outstanding deposits (Rs.10,55,386 crore) of scheduled commercial banks (excluding regional rural banks). The aggregate assets of the NBFC sector increased to Rs.54,489 crore as on March 31, 2001 from Rs.51,324 crore as on March 31, 2000. The profitability analysis of the NBFCs (excluding residuary non-banking financial companies) indicates that this segment recorded a net loss of Rs.471 crore in 2000-01 in contrast to a net profit of Rs.137 crore in the previous year. Income registered a decline of 16.5 per cent largely due to a drop in fund-based income while the decline in expenditure was 6.9 per cent. At the disaggregated level, equipment leasing companies registered a sharp growth of 46.7 per cent in public deposits held by them while those held by investment and loan companies declined sharply by 63.5 per cent during the same period.
Insurance Companies
2.109 The process of liberalisation of the insurance market continued to gather pace during 2002-03. The Insurance and Regulatory Development Authority (IRDA) registered one new life insurance company and three general insurance companies taking the number of life insurers and general insurers both to 13 during 2002-03 so far. According to the IRDA, the life insurance business at force (in terms of premium) expanded by 38.9 per cent during 2001-02 as compared with 37.4 per cent during the previous year. The general insurance business (in terms of gross direct premium income) increased by 26.3 per cent during 2001-02 as compared with 5.9 per cent during the previous year. The share of the private insurers, life and non-life worked out to about 0.5 per cent. During 2001-02, all insurance companies satisfied the solvency margins set by the IRDA.
Global Economic Scenario
2.110 The near-term outlook for global growth continues to remain uncertain in view of the hesitant and limited nature of the recovery that characterised the global growth process in the second half of 2002. The bursting of the technology, telecom and media bubbles, meltdowns in equity prices, oil price hikes, war tensions and corporate accounting problems continue to hinder the recovery process. According to the estimates generated by the IMF, world output is expected to recover to about 3.7 per cent in 2003 from 2.8 per cent in 2002 and 2.2 per cent in 2001. World trade volume is also projected to exhibit a stronger recovery in 2003 in relation to 2002 (Table 2.18).
Table 2.18 : Global Economy – Key Indicators | |||||||||||||||||||||||||||||||||||||||
(Annual per cent change) | |||||||||||||||||||||||||||||||||||||||
Variable | September 2002 | Difference from April | |||||||||||||||||||||||||||||||||||||
Projections | 2002 projections | ||||||||||||||||||||||||||||||||||||||
2000 | 2001 | 2002 | 2003 | 2002 | 2003 | ||||||||||||||||||||||||||||||||||
1 | 2 | 3 | 4 | 5 | 6 | ||||||||||||||||||||||||||||||||||
1. | World Output | 4.7 | 2.2 | 2.8 | 3.7 | .. | -0.3 | ||||||||||||||||||||||||||||||||
2. | Advanced Economies | 3.8 | 0.8 | 1.7 | 2.5 | .. | -0.5 | ||||||||||||||||||||||||||||||||
3. | Developing Countries | 5.7 | 3.9 | 4.2 | 5.2 | -0.1 | -0.3 | ||||||||||||||||||||||||||||||||
4. | World trade (Volume) | 12.6 | -0.1 | 2.1 | 6.1 | -0.4 | -0.5 | ||||||||||||||||||||||||||||||||
5. | Oil Prices (US $) | 57.0 | -14.0 | 0.5 | -0.8 | 5.8 | 3.5 | ||||||||||||||||||||||||||||||||
6. | Non-oil commodity prices (US $) | 1.8 | -5.4 | 4.2 | 5.7 | 4.3 | -1.5 | ||||||||||||||||||||||||||||||||
Source : | World Economic Outlook, September 2002. | ||||||||
2.111 The signs of recovery witnessed around early 2002 in the USA subsequently lost momentum. This has raised concerns about the strength and durability of global recovery in the face of persistent weak economic activity in other major industrial countries as well as war tensions. Quarterly estimates of GDP indicate that the major economies continue to experience slower growth rates which reaffirm the weakness of the recovery process. Activity in Japan and Euro area continue to remain weak. In Japan, a modest rebound is projected for the remaining period of 2002 and 2003. Domestic demand remains sluggish in the Euro area as the recovery is lagging behind in other areas like North America and the emerging markets in Asia (Table 2.19).
Table 2.19 : Cross-Country Quarterly GDP Growth | |||||||||||||||||||||||||||||||||||||||
(Year-on-year, in per cent) | |||||||||||||||||||||||||||||||||||||||
Area | 2001 | 2002 | |||||||||||||||||||||||||||||||||||||
Q1 | Q2 | Q3 | Q4 | Q1 | Q2 | Q3 | Q4 | ||||||||||||||||||||||||||||||||
1 | 2 | 3 | 4 | 5 | 6 | 7 | 8 | ||||||||||||||||||||||||||||||||
USA | -0.6 | -1.6 | -0.3 | 2.7 | 5.0 | 1.3 | 4.0 | 1.4 | |||||||||||||||||||||||||||||||
Euro Area | 2.4 | 1.5 | 1.3 | 0.5 | 0.3 | 0.7 | 0.8 | .. | |||||||||||||||||||||||||||||||
Japan | 1.0 | -2.1 | -1.3 | -0.4 | 0.1 | 1.3 | 0.7 | 0.5 | |||||||||||||||||||||||||||||||
Source : | US Bureau of Economic Analysis; European Central Bank Monthly Bulletin (Various Issues) and Bank of Japan’s Monthly Report on Finance and Economic Development (Various issues). | ||||||||||||||||||||||||||||||||||||||
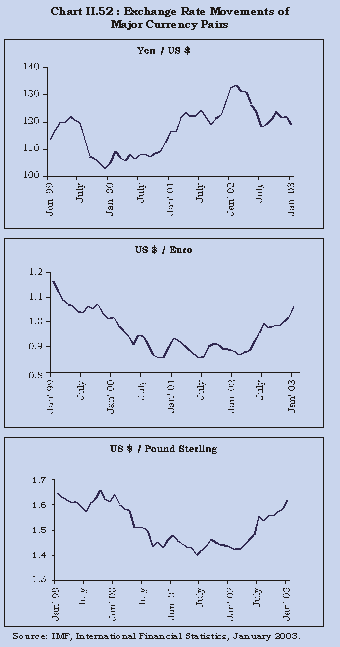
2.112 In the currency market, the movement in major exchange rates was dominated by a large depreciation of the US dollar against the euro and yen (Chart II.52). This is partly a reflection of the growing concerns about the large US current account deficit and a decline in the attractiveness of US assets. Amidst the global slowdown, the US current account deficit improved very little since 2000. On the other hand, some of the emerging market economies in Asia, Japan and to some extent Europe are witnessing surpluses in their current accounts.
2.113 The outlook for emerging market economies has become increasingly diverse. Latin American countries, in particular, witnessed substantial turbulence, largely due to country-specific factors, including concerns about debt dynamics and political uncertainties, generating a lower risk appetite and the increased possibility of contagion. Developing Asia, on the other hand, saw a recovery, posting a growth of 6.1 per cent in 2002, driven by improvement in both exports and domestic demand. The IMF projections suggest that this region may sustain the same growth rate in 2003, with scope for some further recovery.
2.114 The global financial markets weakened since end-March 2002, reflecting a deterioration in the balance sheets of financial intermediaries, corporates and households, concerns about the strength and durability of the recovery and unsettled geo-political conditions. Equity markets and bond yields weakened sharply, while credit spreads widened in bond markets reflecting concerns relating to corporate earnings. A heightened risk aversion contributed to a sharp rise in interest rate spreads.
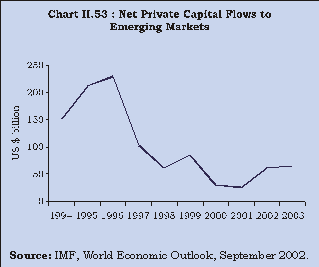
2.115 The net private capital flows to emerging market economies grew by more than two and a half times during 2002 as compared with the last year, with the major portion accounted by the emerging market economies of Asia (Chart II.53). The private capital flows to developing Asia increased substantially during 2002.
2.116 There are several downside risks to the growth outlook for 2003. The most prominent concern is the unfavorable geopolitical situation and the associated implications for international oil prices. The IMF estimates suggest that a sustained US $ 5 increase in oil prices could lower global GDP growth by 0.3 percentage points. Other downside risks are: i) dependence of the recovery on the outlook for the US, with the pick-up in Europe yet to be self-sustained and domestic demand growth in Japan likely to remain constrained by banking and corporate sector difficulties, ii) volatility in equity markets, iii) possibility of sudden corrections in the US dollar, iv) increased risks in emerging markets, particularly in Latin America and Turkey which could potentially impact on capital flows to emerging market economies, and v) continuing weakness in the economic recovery in Japan and its vulnerability to adverse shocks, such as an appreciation of the yen. Financial market developments also reflect heightened risk aversion. A further decline in asset prices can affect the growth prospects by weakening the balance sheets of corporates, institutions and households.
2.117 The need for industrial countries to maintain accommodative monetary policies has been emphasised by the IMF in the World Economic Outlook of September 2002. Interest rates are already at a very low level in the developed countries. The US Federal Reserve cut its target for the Federal Funds Rate to 1.25 per cent in November 2002, after having already lowered it in eleven steps from 6.5 per cent to 1.75 per cent during 2001. As inflationary pressures abated, the European Central Bank (ECB), which had kept its key interest rate (minimum bid rate on the main refinancing operations) unchanged through 2002 (up to November 2002), reduced it by 50 basis points to 2.75 per cent in December 2002 and further by 25 basis points to 2.5 per cent in March 2003. In the UK, the repo rate was reduced by 25 basis points to 3.75 per cent in February 2003.
Merchandise Trade
2.118 India’s exports staged a remarkable recovery during 2002-03 (up to January 2003) after declining by 1.6 per cent during 2001-02 (Chart II.54 and Table 2.20). As per the latest provisional data released by the Directorate General of Commercial Intelligence and Statistics (DGCI&S), India’s exports during 2002-03 (up to January 2003), at US $42.2 billion, increased by 17.3 per cent in sharp contrast to a decline of 0.3 per cent during the corresponding period of the previous year. The outlook for export growth during the remainder of 2002-03 remains positive.
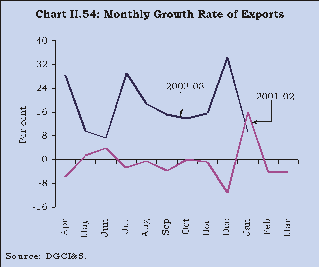
Table 2.20 : India’s Foreign Trade | |||||||||||||||||||||||||||||||||||||||
(US $ Billion) | |||||||||||||||||||||||||||||||||||||||
April-March | April-January | ||||||||||||||||||||||||||||||||||||||
Item | 2000-01 | 2001-02 | 2001-02 | 2002-03 P | |||||||||||||||||||||||||||||||||||
1 | 2 | 3 | 4 | ||||||||||||||||||||||||||||||||||||
Exports | 44.6 | 43.8 | 35.9 | 42.2 | |||||||||||||||||||||||||||||||||||
(21.0) | (-1.6) | (-0.3) | (17.3) | ||||||||||||||||||||||||||||||||||||
(a) | Oil | 1.9 | 2.1 | 1.7 | 1.7 | ||||||||||||||||||||||||||||||||||
(4,709.7) # | (11.6) | (8.7) | (-1.2) | ||||||||||||||||||||||||||||||||||||
(b) | Non-Oil | 42.7 | 41.7 | 34.2 | 40.5 | ||||||||||||||||||||||||||||||||||
(16.1) | (-2.2) | (-0.7) | (18.2) | ||||||||||||||||||||||||||||||||||||
Imports | 50.5 | 51.4 | 42.5 | 49.3 | |||||||||||||||||||||||||||||||||||
(1.7) | (1.7) | (0.2) | (15.9) | ||||||||||||||||||||||||||||||||||||
(a) | Oil | 15.7 | 14.0 | 11.7 | 14.3 | ||||||||||||||||||||||||||||||||||
(24.1) | (-10.5) | (-14.1) | (22.1) | ||||||||||||||||||||||||||||||||||||
(b) | Non-Oil | 34.9 | 37.4 | 30.8 | 35.0 | ||||||||||||||||||||||||||||||||||
(-5.9) | (7.2) | (7.0) | (13.6) | ||||||||||||||||||||||||||||||||||||
Trade Balance | -6.0 | -7.6 | -6.6 | -7.2 | |||||||||||||||||||||||||||||||||||
(a) | Oil | -13.8 | -11.9 | -10.0 | -12.6 | ||||||||||||||||||||||||||||||||||
(b) | Non-Oil | 7.8 | 4.3 | 3.4 | 5.5 | ||||||||||||||||||||||||||||||||||
P | Provisional. | ||||||||||||||||||||||||||||||||||||||
# | Exports of petroleum products rose sharply to US $ 1,870 million in 2000-01 from US $ 39 million in 1999-00. | ||||||||||||||||||||||||||||||||||||||
Figures in brackets relate to percentage variation over the corresponding period of the previous year. | |||||||||||||||||||||||||||||||||||||||
Note | : Figures may not add up to totals due to rounding-off. | |||||||||
Source | : DGCI&S. | |||||||||
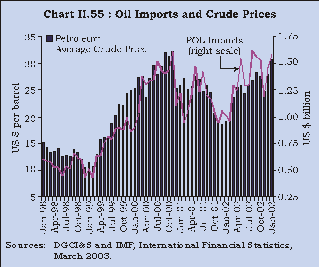
2.119 Imports, at US $ 49.3 billion during 2002-03 (up to January 2003), witnessed an increase of 15.9 per cent as compared with a marginal rise of 0.2 per cent during the comparable period of the previous year, mainly on account of higher oil imports (Chart II.55). Oil imports during this period increased sharply by 22.1 per cent as against a decline of 14.1 per cent during 2001-02 (up to January 2002), due to high international crude oil prices. In consonance with a pick-up in industrial activity, non-oil imports, at US $ 35.0 billion, recorded a higher increase of 13.6 per cent as compared with 7.0 per cent during the corresponding period of the previous year. The trade deficit during this period widened to US $ 7.2 billion from US $ 6.6 billion during 2001-02 (up to January 2002).
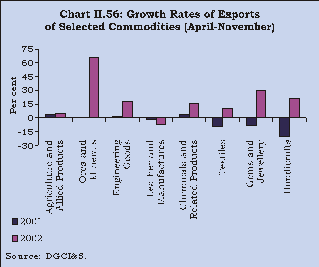
2.120 The detailed data on commodity/country-wise trade are available up to the period April-November 2002. Exports of manufactured goods as well as primary products posted robust growth as compared with the corresponding period of the previous year. During April-November 2002, while the exports of manufactured goods increased by 16.2 per cent in contrast to the decline of 4.6 per cent during the corresponding period of the previous year, primary products exports recorded a higher increase of 14. per cent as compared with that of 3.5 per cent during April-November 2001 (Table 2.21 and Chart II.56).
Table 2.21 : Growth Rates of India’s Principal Exports | |||||||||||||||||||||||||||||||||||||||
(Per cent) | |||||||||||||||||||||||||||||||||||||||
Item | April-March | April-November | |||||||||||||||||||||||||||||||||||||
2000-01 | 2001-02 | 2001-02 | 2002-03 P | ||||||||||||||||||||||||||||||||||||
1 | 2 | 3 | 4 | ||||||||||||||||||||||||||||||||||||
I. | Primar y Products | 9.2 | -0.9 | 3.5 | 14.9 | ||||||||||||||||||||||||||||||||||
(a) | Agriculture and | 6.5 | -2.0 | 3.9 | 4.9 | ||||||||||||||||||||||||||||||||||
Allied Products | |||||||||||||||||||||||||||||||||||||||
(b) | Ores and | 25.9 | 5.0 | 1.0 | 65.5 | ||||||||||||||||||||||||||||||||||
Minerals | |||||||||||||||||||||||||||||||||||||||
II. | Manufactured | 15.6 | -3.5 | -4.6 | 16.2 | ||||||||||||||||||||||||||||||||||
Goods | |||||||||||||||||||||||||||||||||||||||
of which: | |||||||||||||||||||||||||||||||||||||||
(a) | Leather and | 22.3 | -2.0 | -2.0 | -7.0 | ||||||||||||||||||||||||||||||||||
Manufactures | |||||||||||||||||||||||||||||||||||||||
(b) | Chemicals and | 25.1 | 1.7 | 3.8 | 16.3 | ||||||||||||||||||||||||||||||||||
Related Products | |||||||||||||||||||||||||||||||||||||||
(c) | Engineering Goods | 32.3 | 0.8 | 1.9 | 18.3 | ||||||||||||||||||||||||||||||||||
(d) | Textiles | 16.8 | -10.0 | -9.1 | 10.3 | ||||||||||||||||||||||||||||||||||
(e) | Handicrafts | -1.1 | -17.2 | -19.8 | 21.0 | ||||||||||||||||||||||||||||||||||
(f) | Gems and jewellery | -1.6 | -1.1 | -8.8 | 29.4 | ||||||||||||||||||||||||||||||||||
(g) | Carpets | -9.8 | -13.5 | -14.3 | -6.8 | ||||||||||||||||||||||||||||||||||
III. | Petroleum Products | 4,709.7 # | 13.7 | 24.8 | 11.3 | ||||||||||||||||||||||||||||||||||
Total Exports | 21.0 | -1.6 | -0.8 | 18.0 | |||||||||||||||||||||||||||||||||||
P | Provisional | ||||||||||||||||||||||||||||||||||||||
# | Exports of petroleum products rose sharply to US $ 1,870 million in 2000-01 from US $ 39 million in 1999-00. | ||||||||||||||||||||||||||||||||||||||
Source : DGCI&S. | |||||||||||||||||||||||||||||||||||||||
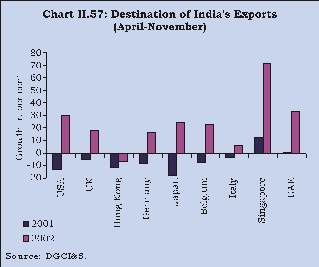
2.121 The destination-wise data showed an increase in the exports to Organisation of Economic Cooperation and Development (OECD), Organisation of Petroleum Exporting Countries (OPEC), Eastern Europe and developing countries of Asia and Latin America. Among the major destination countries, sharp increases in exports were observed in respect of USA, Japan, Belgium, Germany, UK, People’s Republic of China, Indonesia, UAE, South Korea, Singapore and Sri Lanka, while the exports to Hong Kong declined (Chart II.57).
2.122 Commodity-wise data on imports during April-November 2002 revealed that non-oil imports increased by 12.8 per cent as compared with 7.7 per cent during the corresponding period of the previous year. There was a decline in the imports of gold and silver by 9.4 per cent during April-November 2002 owing, inter alia, to a sharp escalation in their global prices. Non-oil imports excluding gold and silver, recorded an increase of 16.5 per cent mainly brought about by increases in the imports of capital goods and export related items (Chart II.58).
2.123 With a revival in industrial activity, the imports of capital goods showed a robust increase of 30.4 per cent during April-November 2002 as compared with 5.3 per cent during the corresponding period of the previous year. Within the capital goods group, imports of ‘electronic goods including computer software’ and ‘transport equipments’ increased significantly. Imports of export-related items like raw cashew nuts increased perceptibly along with that of ‘pearls, precious and semi-precious stones’. The imports of industrial raw materials and intermediate goods such as ‘pulp and waste paper’, ‘artificial resins and plastic materials’ and crude rubber (including synthetic and reclaimed) also showed an increase consistent with an increase in industrial activity. Imports of fertilisers, ‘paper, paperboard and manufactures including newsprint’ and ‘metalliferous ores and metal scrap’ showed a decline.
2.124 The country-wise analysis of import data for the period April-November 2002 reveals an increase in imports from the OECD, OPEC, Eastern Europe and developing countries of Asia and Africa, while imports from Latin American countries declined (Chart II.59).
Invisibles and Current Account
2.125 Invisibles earnings continued to provide significant support to India’s balance of payments during 2002-03 (up to November). The buoyancy in the invisible account was sustained as the net invisible surplus (on account of transactions in services, transfers and income) increased to US $ 10.0 billion during April-November 2002. According to disaggregated data available up to September 2002, the higher surplus was mainly due to higher software and private transfer receipts. Software exports rose by 13.4 per cent during the first half of 2002-03 from the corresponding half of the previous year.
2.126 With the merchandise trade deficit contracting, and the increased invisible surplus, the current account balance moved into a surplus of US $ 2.5 billion during April-November 2002 as against a deficit of US $ 1.3 billion during the corresponding period of 2001 (Chart II.60).
Capital Account
2.127 Net capital flows increased from US $ 6.2 billion during April-November 2001 to US $ 8.0 billion during April-November 2002 (Chart II.61).
2.128 Estimates show that positive exchange rate expectations, a freer trade and payments regime, burgeoning international reserves and improving fundamentals provided a safe haven for adjustments in financial claims leading to larger inflows during April - November 2002 (Table 2.22).
Table 2.22 : Estimates of Sources of Accretion to Foreign Exchange Reserves | |||||||||||||||||||||||||||||||||||||||
(US $ billion) | |||||||||||||||||||||||||||||||||||||||
Item | April- | April- | |||||||||||||||||||||||||||||||||||||
November | November | ||||||||||||||||||||||||||||||||||||||
2001 | 2002 | ||||||||||||||||||||||||||||||||||||||
1 | 2 | ||||||||||||||||||||||||||||||||||||||
I. | 1. | Exports | 29.0 | 34.0 | |||||||||||||||||||||||||||||||||||
2. | Imports | 38.3 | 41.5 | ||||||||||||||||||||||||||||||||||||
3. | Invisibles (net) | 8.0 | 10.0 | ||||||||||||||||||||||||||||||||||||
4. | Current Account Balance (1-2+3) | -1.3 | 2.5 | ||||||||||||||||||||||||||||||||||||
II. | Capital Account (net) | 6.2 | 8.0 | ||||||||||||||||||||||||||||||||||||
5. | Foreign Investment | 2.7 | 1.9 | ||||||||||||||||||||||||||||||||||||
6. | Banking Capital, of which: | 3.6 | 4.0 | ||||||||||||||||||||||||||||||||||||
NRI Deposits | 2.2 | 2.1 | |||||||||||||||||||||||||||||||||||||
7. | External Commercial Borrowings | -0.9 | -1.8 | ||||||||||||||||||||||||||||||||||||
8. | External Assistance | 0.1 | -0.4 | ||||||||||||||||||||||||||||||||||||
9. | Short Term Credit | -0.5 | 0.5 | ||||||||||||||||||||||||||||||||||||
10. | Other capital | 1.2 | 3.8 | ||||||||||||||||||||||||||||||||||||
of which: | |||||||||||||||||||||||||||||||||||||||
(i) Leads and lags in export receipts | 0.5 | 2.8 | |||||||||||||||||||||||||||||||||||||
III. | Overall Balance | 4.9 | 10.5 | ||||||||||||||||||||||||||||||||||||
IV. | Accretion to Foreign Exchange | ||||||||||||||||||||||||||||||||||||||
Reserves (excluding valuation change) | 4.9 | 10.5 | |||||||||||||||||||||||||||||||||||||
V. | Valuation change | -0.4 | +2.1 | ||||||||||||||||||||||||||||||||||||
(appreciation‘+’/ depreciation ‘-’) | |||||||||||||||||||||||||||||||||||||||
VI. | Accretion to Foreign Exchange Reserves (including valuation change) (IV + V) | 4.5 | 12.6 | ||||||||||||||||||||||||||||||||||||
2.129 Amongst the major components of capital flows, while foreign direct investment flows were a little lower than in the previous year, portfolio investment flows failed to pick up (Table 2.23). Outflows under external commercial borrowings increased further as the appetite for external finance remained subdued, partly on account of ample domestic liquidity.
Table 2.23 : Foreign Investment Flows by Category | |||||||||||||||||||||||||||||||||||||||
(US $ million) | |||||||||||||||||||||||||||||||||||||||
2000-01 | 2001-02 | April-December (P) | |||||||||||||||||||||||||||||||||||||
Item | 2001-02 | 2002-03 | |||||||||||||||||||||||||||||||||||||
1 | 2 | 3 | 4 | ||||||||||||||||||||||||||||||||||||
A. | Direct | 2,339 | 3,904 | 2,712 | 2,256 | ||||||||||||||||||||||||||||||||||
Investment | |||||||||||||||||||||||||||||||||||||||
a) | Government | ||||||||||||||||||||||||||||||||||||||
(SIA/FIPB) | 1,456 | 2,221 | 1,581 | 925 | |||||||||||||||||||||||||||||||||||
b) | RBI | 454 | 767 | 564 | 598 | ||||||||||||||||||||||||||||||||||
c) | NRI | 67 | 35 | 33 | – | ||||||||||||||||||||||||||||||||||
d) | Acquisition | ||||||||||||||||||||||||||||||||||||||
of shares * | 362 | 881 | 534 | 733 | |||||||||||||||||||||||||||||||||||
B. | Portfolio | ||||||||||||||||||||||||||||||||||||||
Investment | 2,760 | 2,021 | 1,343 | 386 | |||||||||||||||||||||||||||||||||||
a) | GDRs/ | ||||||||||||||||||||||||||||||||||||||
ADRs # | 831 | 477 | 477 | 537 | |||||||||||||||||||||||||||||||||||
b) | FIIs @ | 1,847 | 1,505 | 827 | -151 | ||||||||||||||||||||||||||||||||||
c) | Off-shore | ||||||||||||||||||||||||||||||||||||||
funds and | |||||||||||||||||||||||||||||||||||||||
others | 82 | 39 | 39 | – | |||||||||||||||||||||||||||||||||||
Total (A+B) | 5,099 | 5,925 | 4,055 | 2,642 | |||||||||||||||||||||||||||||||||||
P | Provisional. | ||||||||||||||||||||||||||||||||||||||
* | Relates to acquisition of shares of Indian companies by non- residents under Section 5 of FEMA 1999. | ||||||||||||||||||||||||||||||||||||||
# | Represents the amount raised by Indian corporates through Global Depository Receipts (GDRs) /American Depository Receipts (ADRs). | ||||||||||||||||||||||||||||||||||||||
@ | Represents net inflow of funds by Foreign Institutional | ||||||||||||||||||||||||||||||||||||||
Investors (FIIs). | |||||||||||||||||||||||||||||||||||||||
2.130 Non-resident deposits were broadly of the same order as in the previous year. Short-term credits rose in line with the increase in POL imports (Table 2.24).
Table 2.24 : Inflows under NRI Deposit Scheme | |||||||||||||||||||||||||||||||||||||||
(US $ million) | |||||||||||||||||||||||||||||||||||||||
Scheme | April-December (P) | ||||||||||||||||||||||||||||||||||||||
2000-01 | 2001-02 | 2001-02 | 2002-03 | ||||||||||||||||||||||||||||||||||||
1 | 2 | 3 | 4 | ||||||||||||||||||||||||||||||||||||
1. | FCNR(B) | 904 | 594 | 585 | 592 | ||||||||||||||||||||||||||||||||||
2. | NR(E)RA | 860 | 1,626 | 1,206 | 4,582 | ||||||||||||||||||||||||||||||||||
3. | NR(NR)RD | 553 | 508 | 463 | -2,891 | ||||||||||||||||||||||||||||||||||
Total | 2,317 | 2,728 | 2,254 | 2,283 | |||||||||||||||||||||||||||||||||||
P | Provisional. | ||||||||||||||||||||||||||||||||||||||
Foreign Exchange Reserves
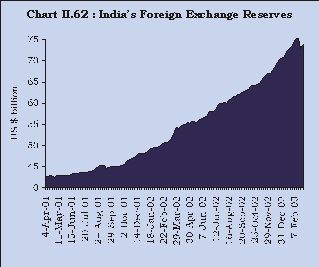
2.131 The foreign exchange reserves increased by US $ 21.2 billion during 2002-03 (up to February 21, 2003) on the top of an increase of US $ 11.8 billion during 2001-02 (Chart II.62). The foreign exchange reserves declined to US $ 72.9 billion on February 28, 2003 on account of pre-payment of external debt of US $ 2.97 billion by the Central Government. At US $ 73.9 billion as on March 13, 2003, the level of reserves was equivalent to more than a year’s imports. The increase in reserves was almost entirely on account of foreign currency assets. Gold holdings of the Reserve Bank increased by a marginal US $ 0.7 billion. Currency valuation effects arising from a realignment of the US dollar with other major currencies accounted for US $ 3.5 billion of the reserve accretion during 2002–03 (up to March 13, 2003).
2.132 The recent sustained increase in the reserves have raised issues about the costs and benefits of reserves. The financial cost of additional reserve accretion is estimated to be low, given that debt flows contributed only 23 per cent of the reserve accretion during April-November 2002 while the surplus in the current account, non-debt creating flows and valuation factors, which do not involve contractual servicing obligations, together contributed 77 per cent of the reserve accretion. These costs are likely to be more than offset by the return on additional reserves.
2.133 Forward liabilities of the Reserve Bank were fully extinguished by September 2002. Forward assets of US $ 2.6 billion were accumulated by end-February 2003.
2.134 The accumulation of foreign exchange reserves during the year is in line with the Reserve Bank’s policy of maintaining an adequate level of foreign exchange reserves to meet import requirements, unforeseen contingencies, volatility, self-fulfilling and speculative adverse expectations and liquidity risks associated with different types of capital flows. The policy for reserve management continues to be judiciously built upon a host of identifiable factors and other contingencies, including the size of the current account deficit, the size of short-term liabilities (including current repayment obligations on long-term loans), the possible variability in portfolio investment and other types of capital flows, the unanticipated pressures on the balance of payments arising out of external shocks and movements in the repatriable foreign currency deposits of Non-Resident Indians (NRIs). Taking these factors into account, India’s foreign exchange reserves are at present comfortable and consistent with the rate of growth, the share of external sector in the economy and the size of risk-adjusted capital flows.
2.135 A number of measures of current and capital account relaxations were undertaken during the year as a part of the ongoing liberalisation of exchange control regulations and taking into account the stable market conditions and healthy foreign exchange inflows (Box II.2).
Box II.2 Current and Capital Account Liberalisation Policies adopted in India: 2002-03
|
External Debt
2.136 India’s external debt, at US $ 101.97 billion as at end-September 2002, increased by 0.7 per cent from the end-June 2002 level and 3.5 per cent over end-March 2002 (Table 2.25).
Table 2.25 : India’s External Debt | |||||||||||||||||||||||||||||||||||||||
As at the end of | |||||||||||||||||||||||||||||||||||||||
Item | March 2002 | June 2002 | September 2002 | ||||||||||||||||||||||||||||||||||||
Amount | Share in | Amount | Share in | Amount | Share in | ||||||||||||||||||||||||||||||||||
(US $ Million) | Total Debt | (US $ Million) | Total Debt | (US $ Million) | Total Debt | ||||||||||||||||||||||||||||||||||
(Per cent) | (Per cent) | (Per cent) | |||||||||||||||||||||||||||||||||||||
1 | 2 | 3 | 4 | 5 | 6 | ||||||||||||||||||||||||||||||||||
1. | Multilateral | 31,898 | 32.4 | 32,288 | 31.9 | 32,132 | 31.5 | ||||||||||||||||||||||||||||||||
2. | Bilateral | 15,347 | 15.6 | 16,306 | 16.1 | 16,234 | 15.9 | ||||||||||||||||||||||||||||||||
3. | IMF | 0 | 0 | 0 | 0 | 0 | 0 | ||||||||||||||||||||||||||||||||
4. | Export Credit | 5,005 | 5.1 | 4,957 | 4.9 | 4,769 | 4.7 | ||||||||||||||||||||||||||||||||
5. | Commercial Borrowings | 23,338 | 23.7 | 23,081 | 22.8 | 22,344 | 21.9 | ||||||||||||||||||||||||||||||||
6. | NRI Deposits (Long-Term) | 17,154 | 17.4 | 18,617 | 18.4 | 20,658 | 20.3 | ||||||||||||||||||||||||||||||||
7. | Rupee Debt | 3,002 | 3.0 | 2,912 | 2.9 | 2,800 | 2.7 | ||||||||||||||||||||||||||||||||
8. | Long-Term Debt (1 to 7) | 95,744 | 97.2 | 98,161 | 96.9 | 98,937 | 97.0 | ||||||||||||||||||||||||||||||||
9. | Short-Term Debt * | 2,745 | 2.8 | 3,092 | 3.1 | 3,035 | 3.0 | ||||||||||||||||||||||||||||||||
10. | Total Debt (8+9) | 98,489 | 100.0 | 1,01,253 | 100.0 | 1,01,972 | 100.0 | ||||||||||||||||||||||||||||||||
* | Excludes suppliers credit of up to 180 days. | ||||||||||||||||||||||||||||||||||||||
2.137 The consolidation of external debt was carried further during the quarter as indicated by key indicators of debt sustainability. The concessional debt as a proportion to total debt continued to be significant. The size of short-term debt remained modest both in regard to total debt and reserves. The proportion of short-term debt to total debt remained broadly stable at around 3.0 per cent as at end-September 2002 as compared with 3.1 per cent as at end-June 2002 and 2.8 per cent as at end-March 2002. The ratio of short-term debt to foreign exchange reserves declined to 4.8 per cent as at end-September 2002 from 5.3 per cent as at end-June 2002 and 5.1 per cent as at end-March 2002.
2 Includes the impact of merger of ICICI Ltd. with ICICI Bank Ltd. on assets, liabilities, performance, NPAs and capital adequacy of scheduled commercial banks.3 ICICI Ltd. merged with ICICI Bank Ltd. with effect from March 30, 2002 and is, therefore, excluded.
പേജ് അവസാനം അപ്ഡേറ്റ് ചെയ്തത്:


