 IST,
IST,
II. Aggregate Demand
Demand conditions in the economy remained tepid during Q2 of 2012-13. Private consumption, the mainstay of aggregate demand, continued to decelerate, reflecting the impact of high inflation. However, government consumption accelerated during the first half of the year. The envisaged fiscal correction now underway is expected to improve demand management. Steps to contain subsidies need to be persisted with and expedited so that fiscal imbalance is reduced and resources are freed to step up capital expenditure next year. There was a marginal sequential rise in investment in Q2 of 2012-13, as reflected in a modest increase in gross fixed capital formation as also the sanctioned project assistance during the quarter. A turnaround in the investment cycle, which has been in downturn for two years, crucially hinges on increased public investment to crowd in private investment and resolution of power and road sector bottlenecks. Expenditure side of GDP continued to show weak demandII.1 Growth in GDP at market prices decelerated sharply to 2.8 per cent in Q2 of 2012-13 from 6.9 per cent in the corresponding period of 2011-12, the lowest in the previous 13 quarters (Table II.1). Though private final consumption expenditure (PFCE) continues to be the major driver of growth, its contribution to growth has declined since Q4 of 2011-12 (Table II.2). II.2 During H1 of 2012-13, growth in GDP at market prices was significantly lower than that at factor cost due to lower growth in net indirect taxes. The deceleration was reflected in all components except government final consumption expenditure (GFCE). Growth in private consumption moderated due to high inflation coupled with lower income growth during 2012-13 so far. Net exports growth continued to be negative partly due to weak external demand. This is in line with the record current account deficit observed during Q2 of 2012-13. II.3 Going forward, possible moderation in inflation would support private final consumption. The announced efforts towards fiscal consolidation could also restrain government final consumption somewhat. More definitive indication of a pick-up in gross fixed capital formation is yet to be seen. On the whole, the growth process during 2012-13 would be largely driven by private consumption. Problems facing infrastructure sector still constraining investmentII.4 As on November 1, 2012, out of 563 central sector projects (of `1.5 billion and above), largely concentrated in five sectors, viz., road transport and highways, power, petroleum, railways and coal, nearly half were reported to be delayed. As a result, there were significant cost overruns in many of these projects. The major factors reported for the time overruns were delays in land acquisitions/ environmental clearances/tie-up of project financing/finalising of engineering designs, lack of infrastructure support and linkages, change in scope and other contractual issues. The maximum number of delays was reported for two key infrastructure sectors – power, and road transport and highways.
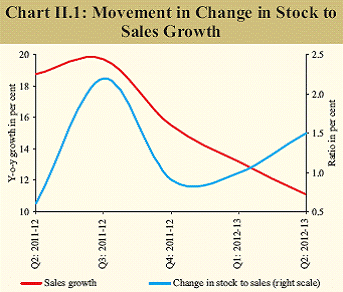
II.5 The problems in the power sector are yet to be fully resolved despite concerted efforts by the government. On the coal linkage issue, while power producers have started signing new fuel supply agreement with Coal India Limited that commits supply of 65 per cent of the assured coal quantity through domestic sources and another 15 per cent in the form of imported coal, the key issue of price pooling remains unresolved. Given the large price differential between domestic and imported coal, the understanding on price pooling is essential to bridge the demand-supply gap through imports. Also, adequate response from state governments on the discom restructuring package is not forthcoming. The state governments and their state electricity boards need to quickly commit themselves to the restructuring of their debt with all attendant requirements. II.6 In the road sector, the record tendering by the National Highways Authority of India awarding 6,491 kilometres of road projects in 2011-12 has not helped in reversing the declining investment in this sector as a very large number of these projects have not achieved environmental clearances. Some projects are also stuck due to land acquisition issues. In addition, firms engaged in these projects are finding it difficult to achieve financial closure. Investment in road sector has collapsed in 2012-13, with scant interest in new projects, large delays and poor execution in existing projects. Even the projects being awarded on engineering, procurement and construction (EPC) basis, where the state bears the cost, are making little headway. This is because the new legal framework necessitates upfront environmental clearances for even small stretches of land, before private contractors execute the project. Sales growth moderates further, indicating slack demandII.7 Sales growth for listed non-government non-financial (NGNF) companies moderated and reached its lowest level in three years in Q2 of 2012-13 (Table II.3). The deceleration in sales was spread across manufacturing, IT and non-IT services sectors, all size groups and all use-based groups, except intermediate groups, with sharper deceleration in motor vehicles, iron and steel, and textiles. However, net profits recorded a growth of more than 25 per cent in Q2 of 2012-13 reversing the declining trend of the previous four quarters. The growth in profits was on a low base and reflected support from other income and lower rate of growth in interest payments. Resultantly, profit margins also improved during the quarter (Table II.4). Inventory accumulation, reflected in the change in stock-to-sales ratio, went up during the quarter but remained below the recent peak observed in Q3 of 2011-12 (Chart II.1).
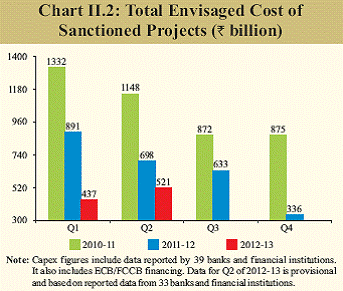
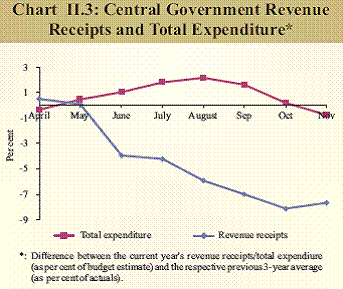
II.8 Early results of 166 companies for Q3 of 2012-13 indicate continued moderation in sales. Expenditure growth also decelerated further and profit margins remained almost intact. However, the early results are from a small set of companies which are not representative of the overall corporate sector. Marginal increase in envisaged project expenditureII.9 Based on data received from 39 banks/ financial institutions as also on financing from external commercial borrowings (ECB) and foreign currency convertible bonds (FCCB), there was a small increase in the total cost of projects sanctioned in Q2 of 2012-13. However, the amount of sanctioned assistance was much lower than during the corresponding quarter of the previous year (Chart II.2). Fresh policy measures helping fiscal consolidation II.10 In October 2012, the government announced a revised fiscal roadmap following the recommendations of the Report of the Committee on Roadmap for Fiscal Consolidation (Chairman: Dr. Vijay L. Kelkar). As per the revised roadmap, the gross fiscal deficit (GFD) for 2012-13 is estimated at 5.3 per cent of GDP compared with the budget estimate of 5.1 per cent. The government’s fiscal consolidation plan envisages fiscal deficit to decline to 4.8 per cent of GDP in 2013-14 and by 0.6 percentage points every year thereafter to reach 3.0 per cent of GDP in 2016-17. II.11 The government has taken several steps to curtail deficit and put government finances on a more sustainable path. In a significant move, in January 2013, the government partially deregulated the prices of diesel, allowing full adjustment of prices for bulk consumers and a staggered increase for others. On the other hand, the annual supply of subsidised LPG cylinders per household has been increased to nine, from the cap of six announced in September 2012. These measures on the whole constitute an important signal to address fiscal imbalances, though its impact in the current fiscal year is expected to be negligible. II.12 Renewed thrust to disinvestment of public sector undertakings so as to meet the budgetary target, cut-back in both plan and non-plan expenditure and increased reliance on direct cash transfers to cut leakages in subsidies also constitute important steps in reducing fiscal deficit. The government has, however, committed to retaining allocations to all flagship schemes to protect the poor. On tax reforms, it has committed to introducing the goods and services tax (GST) and reviewing the Direct Tax Code (DTC). More recently, the government has reiterated its stance of restricting expenditure in the last quarter of the financial year to 33 per cent of the budget estimates, and that during March to 15 per cent, to curb the bunching of expenditure towards the close of the financial year. II.13 Further fiscal consolidation measures would be necessary in near term. The Kelkar committee has recommended several steps in this direction. For instance, over the next two to three years, resources could be raised by monetising government’s unutilised and under-utilised land resources. These resources could be used to finance infrastructure needs particularly in urban areas. Such innovative measures would need to be examined though, as such asset sales do not support a structural correction in the fiscal position Fiscal deficit remains high as slowdown impacts revenuesII.14 During the first eight months of the current year, the fiscal deficit amounted to 4.1 per cent of GDP or 80.4 per cent of the budget estimates (Table II.5). Revenue deficit, at 3.1 per cent of GDP, was marginally lower than in the corresponding period of the previous year. Given the current trends, significant shortfall in tax revenues and some shortfall in budgeted spectrum receipts is likely. Realisation of budgeted disinvestment proceeds crucially hinges on market conditions. However, the government is working to achieve the revised fiscal deficit target of 5.3 per cent with containment of both plan and non-plan expenditure during the last quarter of the year. Growth slowdown remains a drag on revenue collectionsII.15 Revenue collections remained sluggish at 47.6 per cent of budget estimates during April-November 2012 (49.7 per cent in the previous year). The growth in collection of corporation tax and excise duties remained modest due to continued growth moderation, while customs duty collections were adversely impacted, reflecting the deceleration in imports. Collections under personal income tax, however, remained buoyant partly due to lower refunds compared to previous year. Non-tax revenue receipts, at 46.3 per cent of budget estimates, were also significantly lower than the receipts of 57.7 per cent during the corresponding period of the previous year due to the poor response to spectrum auction and the reported staggering of auction receipts. Non-plan expenditure continues to exert pressure despite a moderation in total expenditure II.16 During April-November 2012, the total expenditure of the government was lower at 58.2 per cent of the budget estimates (60.5 per cent in the previous year). The deceleration in expenditure has been more pronounced since September 2012, with a narrowing down in the differential between the current year’s expenditure (as per cent of budget estimate) and the respective three-year average (as per cent to actual), indicating the government’s efforts to rein in expenditure (Chart II.3). II.17 The total expenditure of the government during 2012-13, however, is likely to exceed budget estimates mainly on account of nonplan revenue expenditure. At 16.7 per cent, the growth in non-plan revenue expenditure during April-November 2012 was significantly higher than the budgeted growth of 6.1 per cent. Quality of fiscal adjustment remains a concernII.18 Significant cut-backs in plan and capital expenditure and reliance on non-durable receipts such as disinvestment proceeds could compromise the quality of fiscal adjustment. During April-November 2012, plan expenditure and capital expenditure as percentages to budget estimates were significantly lower than those in the preceding year. Plan expenditure as a percentage of budget estimate was lower for major departments/ministries such as power, road transport and highways, rural development and women and child development. Lower public investment in crucial infrastructure would have implications for growth. While the quality of expenditure remains an area of concern, fiscal augmentation through increased recourse to disinvestment proceeds and oneoff receipts such as spectrum auctions may not be sustainable. Additional market borrowing likely to be averted this year, but further steps needed II.19 The government announced the first supplementary demand for grant, which entails a net cash outgo of `308 billion mainly to provide part compensation for estimated under-recoveries to oil marketing companies (`285 billion) and infusion of equity in Air India (`20 billion). This additional expenditure may not entail any additional market borrowings. However, the subsidy provision made so far appears inadequate. Reviving investment demand is the key to economic turnaroundII.20 The government has made a commitment to bring down the level of the fiscal deficit. However, if the compression in government expenditure is mainly from plan/capital heads, it raises concerns relating to quality of the fiscal consolidation. As the reforms announced by the government take effect, the improvement in investment climate would help in reviving growth. Increased public investment to crowdin private investment along with removal of structural impediments slowing private investment is needed to pull the economy out of the current slowdown. * Despite their well-known limitations, expenditure-side GDP data are being used as proxies for components of aggregate demand. |
||||||||||||||||||||||||||||||||||||||||||||||||||||||||||||||||||||||||||||||||||||||||||||||||||||||||||||||||||||||||||||||||||||||||||||||||||||||||||||||||||||||||||||||||||||||||||||||||||||||||||||||||||||||||||||||||||||||||||||||||||||||||||||||||||||||||||||||||||||||||||||||||||||||||||||||||||||||||||||||||||||||||||||||||||||||||||||||||||||||||||||||||||||||||||||||||||||||||||||||||||||||||||||||||||||||||||||||||||||||
പേജ് അവസാനം അപ്ഡേറ്റ് ചെയ്തത്:


