 IST,
IST,
III. The External Sector
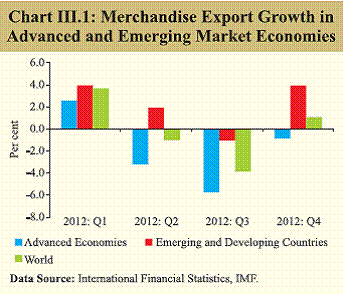
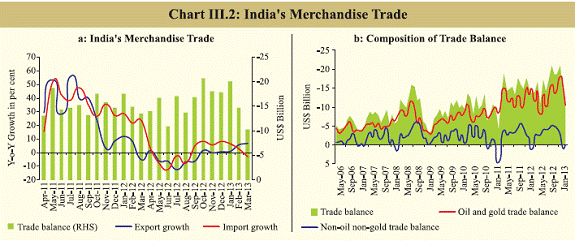
External imbalances came to the fore during 2012-13 as the CAD-GDP ratio reached an all time high of 6.7 per cent in Q3 mainly on account of the growing trade deficit. Although non-oil non-gold imports have decelerated in recent months, the sticky oil and gold imports resulted in the widening of trade deficit. However, the overall balance of payments was in marginal surplus due to strong capital inflows, led by FII investments. In Q4 of 2012-13, CAD is expected to have narrowed on the back of a turnaround in export growth and stabilisation of import growth. The recent moderation in commodity prices, including oil and gold will also help reduce the pressure on the current account. Despite these factors, the CAD is likely to remain above sustainable level. This requires policy attention, as the lumpiness and volatility of capital flows expose CAD financing to risks of sudden stops and reversals in these flows. No definitive signs of global recovery III.1 During 2012, global trade expanded at its slowest pace since the mid-1990s with the exception of a large contraction in 2009. Slow growth in the advanced economies (AEs) continued to remain a weak link in global trade expansion, while emerging market and developing economies (EMDEs) seem to be contributing to global trade through increased intra-industry and South-South trade. The upturn in world exports in Q4 of 2012, though small, was largely supported by the relatively better growth performance in EMDEs, while exports from AEs showed contraction (Chart III.1). Going forward, the lower-than-expected growth in China in Q1 of 2013 comes as a dampener, and tilts towards downside the overall balance of risks to the global economic and trade outlook. Exports pick-up in Q4 of 2012-13 III.2 Reflecting the modest increase in trade activities across EMDEs, India’s merchandise exports showed a turnaround from December 2012 after a subdued performance in previous months (Table III.1 and Chart III.2a). In Q4 of 2012-13, export growth at 4.7 per cent was higher compared with 4.0 per cent in the corresponding period of 2011-12. While the recovery in exports in January 2013 was mainly due to higher demand from Saudi Arabia, Malaysia and a few African economies, the exports to China continued to contract. Commodity-wise data show that export pick-up was confined to a few sectors. Petroleum products, oil cakes, gems and jewellery, engineering goods and cotton yarn accounted for more than 75 per cent of the total rise in exports in Q4 of 2012-13. III.3 Notwithstanding a modest increase in exports in recent months, the trade deficit remained significantly higher in 2012-13. In fact, the non-oil non-gold trade balance has shown an improvement since November 2012, turning mildly positive in February 2013 (Chart III.2b). Net imports of POL and gold accounted for nearly 82 per cent of India’s trade deficit during 2012-13. III.4 In the recent period, the government undertook a slew of measures to address the high trade deficit attributed to low exports and high POL and gold imports. In January 2013, the government authorised oil marketing companies to hike diesel prices on a monthly basis, thereby allowing gradual deregulation of diesel prices.
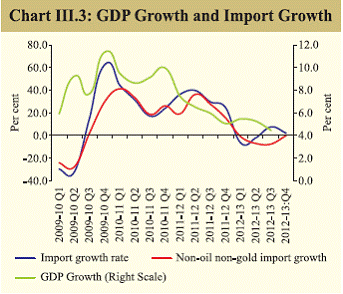
III.5 To curb the import demand for gold, the customs duty on gold import was raised further from 4 per cent to 6 per cent in January 2013. Under the Gold Deposit Scheme, the central government has allowed mutual funds / ETFs to deposit part of their gold with the banks. Recognising the concerns relating to high gold imports and its impact on India’s CAD, the Union Budget 2013-14 emphasised that the household sector must be incentivised to save in financial instruments rather than buy gold and hence, proposed various measures including the introduction of inflation-indexed bonds. CAD risks may moderate in the near term, though structural impediments remain III.6 The current account deficit (CAD) rose to a historical high of 6.7 per cent of GDP in Q3 of 2012-13 (Table III.2). On BoP basis, merchandise exports remained almost stagnant at level achieved in Q3 of 2011-12. Though, sluggish global demand has largely been responsible for continued weak exports, there is a need to address domestic policy issues impeding export growth. For example, despite being one of the major coal producers in the world, India had to import 113 million tonnes during the period April 2012-January 2013, which is a jump of 29 per cent, on top of a rise of 47 per cent witnessed during the previous year. In 2012-13, diesel consumption increased by 6.8 per cent over 2011-12. III.7 Other major sources of current receipts, viz., exports of services, most notably software, and private transfers also decelerated and were thus inadequate to offset the impact of the high trade deficit on the current account balance. Non-oil non-gold imports have continued to decelerate, broadly tracking the slowdown in GDP growth (Chart III.3). In contrast, despite various dampening factors such as slowdown in growth, depreciation of the rupee and policy measures like duty hike on gold, the demand for oil and gold imports has remained significant.
III.8 Global commodity prices, especially of oil and gold, have fallen recently. The softening of oil prices mainly reflects the subdued growth outlook for some advanced economies and also China. With the strengthening of US dollar, the role of gold as a safe haven asset may have weakened. Apart from that, the possibility of gold sale by some indebted euro area economies also appears to be the cause of fall in gold prices. Consequent to decline in oil and gold prices, pressures on the CAD in the short-run may have eased but there is hardly any space for complacency. III.9 While the CAD, even at this large level, could be fully financed by capital inflows during 2012-13, volatility in such flows remains a risk. Given the slowing growth and attendant macro-financial risks, as also the possibilities of global ‘risk off’ turning into global ‘risk on’ leading to reversal of capital flows from emerging markets, it is necessary to lower external sector risks by lowering the CAD to its sustainable level and not become complacent about external inflows. Overall, private sector external debt has become large and, going forward, some prudence may be necessary on external commercial borrowing (ECBs) and short-term trade credit. Capital flows continue to be strong, enabling CAD financing III.10 Even though the CAD rose sharply in Q3 of 2012-13, net capital flows were able to finance it fully and there was even a marginal accretion to foreign exchange reserves (Table III.3). While portfolio flows broadly tracked the global optimism in Q4 of 2012-13, domestic policy measures also served as pull factors to attract FII flows to India. In addition to increasing FII limits in debt securities (both corporate and government) in Q3, various policy announcements in Q4, viz., (i) postponing the implementation of the General Anti- Avoidance Rule (GAAR) by two years, (ii) simplification of ‘Know Your Customer’ registration rules for overseas investors and (iii) removal of separate limits for FIIs on different types of corporate bonds may have improved the market sentiment. The recent fall in global commodity prices has somewhat alleviated CAD risks and thus attracted greater FII inflows, though its financing remains a challange. III.11 While non-debt flows picked up in Q4, there was a mixed trend in the major components of debt-creating flows. While NRI deposits moderated in Q4, net flows in the form of ECBs showed an increase (Table III.4). Moderation in NRI deposits might be partly reflecting the subdued income growth conditions in major source countries. During Q4, ECBs have been raised mainly to fund the power sector, modernisation, import of capital goods and new projects. In view of rising private external debt, it is important to keep in view the end-use of ECBs.
Rupee remained range bound, supported by portfolio flows III.12 The trend of a stronger rupee observed during December 2012 to early-February 2013 was mainly supported by portfolio capital flows and various reform measures announced during the period. Even though the rupee witnessed some weakness during the second week of February to early March, it remained largely range-bound with some subsequent appreciation during April 2013. In Q4, the level of the real effective exchange rate (i.e., REER based on 6 and 36 currency baskets) remained almost at the level recorded in Q3 (average basis). REER witnessed some depreciation during 2012-13 (Table III.5). External debt, particularly short-term debt, rose further in Q3 III.13 India’s external debt increased to US$ 376 billion as at end-December 2012, reflecting continued dependence on ECBs and short-term borrowings to meet the widening CAD (Table III.6). Short-term debt on a residual maturity basis has risen by about US$ 19 billion in the first three quarters of 2012-13.
Vulnerability indicators weakened further III.14 India’s external sector vulnerability indicators deteriorated further in Q3 of 2012-13 (Table III.7). Reflecting the sharper rise in external debt as compared to growth in nominal GDP (in rupee terms), the ratio of external debt to GDP increased in Q3. Similarly, the import cover declined marginally, as imports were spurred largely by oil and gold imports during the period. Reflecting the widening CAD, the net international investment liabilities-GDP ratio increased to 15.4 per cent at end-December 2012 from 15.1 per cent at end-September 2012. Sustained efforts needed to bring the CAD to sustainable levels, though fall in commodity prices brings temporary respite III.15 Export growth turned positive since December 2012 and this bodes well for narrowing the CAD in Q4 of 2012-13. Further, the recent fall in the prices of gold and POL, which constitute nearly 45 per cent of India’s imports, may help alleviate the pressure on the trade deficit and, in turn, on the CAD. Even though the CAD-GDP ratio is likely to moderate from Q4 of 2012-13, it may still remain above the sustainable level in the short to medium term. Capital flows, particularly equity flows, remain strong, mainly reflecting easy global liquidity (push factor) and market participants’ expectations of higher returns from the Indian markets (pull factor). The reduced pressures on the trade deficit coupled with higher capital flows are likely to facilitate smooth financing of the CAD. Nonetheless, several risks remain, which require policy attention. First, even as POL and gold prices cool off, the moderation in CAD may still not be sufficient to bring it down to the sustainable level. Second, apart from POL and gold imports, there are also some other impediments to CAD reduction. Indian exports need to build productivity-based competitiveness and in this context, infrastructural constraints need to be addressed. It would be erroneous to take comfort from factors that are exogenous in nature, such as the fall in oil and gold prices, without addressing domestic structural problems. Third, even though FII flows remain strong at the moment, they may become volatile if global financial conditions turn adverse. Moreover, the continuation of these flows depends on the growth prospects of the Indian economy and any sign of uncertainty regarding these prospects may hamper these flows. Fourth, the global economic outlook is far from rosy and downside risks remain substantial. Thus, sustaining Indian export recovery in such an uncertain situation would be a challenge that needs domestic efforts to raise productivity-based competitiveness. To sum up, though the recent developments have given a temporary respite to CAD risks and have eased the pressure on its financing, policy efforts need to continue to bring it down to a sustainable level.
|
|||||||||||||||||||||||||||||||||||||||||||||||||||||||||||||||||||||||||||||||||||||||||||||||||||||||||||||||||||||||||||||||||||||||||||||||||||||||||||||||||||||||||||||||||||||||||||||||||||||||||||||||||||||||||||||||||||||||||||||||||||||||||||||||||||||||||||||||||||||||||||||||||||||||||||||||||||||||||||||||||||||||||||||||||||||||||||||||||||||||||||||||||||||||||||||||||||||||||||||||||||||||||||||||||||||||||||||||||||||||||||||||||||||||||||||||||||||||||||||||||||||||||||||||||||||||||||||||||||||||||||||||||||||||||||||||||||||||||||||||||||||||||||||||||||||||||||||||||||||||||||||||||||||||||||||||||||||||||||||||||||||||||||||||||||||||||||||||||||||||||||||||||||||||||||||||||||||||||||||||||||||||||||||||||||||||||||||||||||||||||||||||||||||||||||||||||||||||||||||||||||||||||||||||||||||||||||||||||||||||||||||||||||||||||||||||||||||
പേജ് അവസാനം അപ്ഡേറ്റ് ചെയ്തത്:


