 IST,
IST,
IV. Monetary and Liquidity Conditions
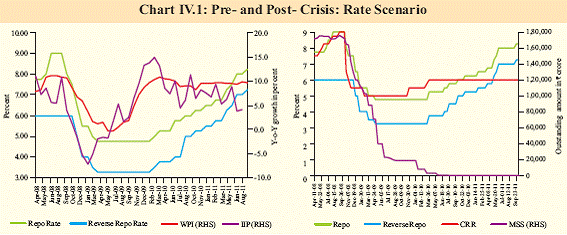
In the Q2 of 2011-12, liquidity conditions continued to remain in deficit mode, in line with the policy objective of the Reserve Bank. Base money decelerated as currency growth moderated. Money (M3) growth, however, accelerated moderately as the money multiplier increased. While credit growth is above the indicative trajectory, it will moderate as growth decelerates. Going forward, the global uncertainty and fiscal pressures pose challenges to effective monetary policy management. Significant monetary tightening in the face of high inflation IV.1 The Reserve Bank has been pursuing a tight monetary policy stance since early 2010 in response to sustained inflationary pressures. Inflation, which initially emerged from supply side constraints, increasingly became generalised and the Reserve Bank had to calibrate its policy response to anchor inflation expectations, while at the same time ensuring that the growth impulses of the economy were not hampered. In continuation of this policy stance, the Reserve Bank raised the policy repo rate by 50 bps in July 2011 and again by 25 bps in September 2011 (Table IV. 1). The level of policy rate and inflation presently are broadly comparable to the levels prevailing in September 2008 (Chart IV.1).
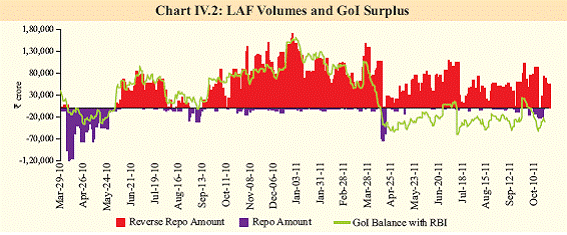
Liquidity remained in deficit mode IV.2 The average LAF injection, which was around `49,000 crore in the first quarter of 2011-12, dropped marginally to around `47,000 crore in the second quarter of 2011-12 mirroring the increase in centre’s cash deficit. Liquidity deficit largely remained within (+/-) 1 per cent of NDTL of the banks, in line with the stated policy objective of the Reserve Bank. The liquidity deficit, which had witnessed some stress in June 2011 due to quarterly advance tax payouts, eased in early July 2011, reflecting the drawdown of Central Government cash balances and transition to WMA/OD (Chart IV.2 and Table IV.2). Since the introduction of the new operating procedures of monetary policy in May 2011, injection of liquidity under the marginal standing facility (MSF) has been limited to two occasions (`100 crore on June 10 and `4,105 crore on July 15, 2011), which is indicative of the liquidity position not getting over tight.
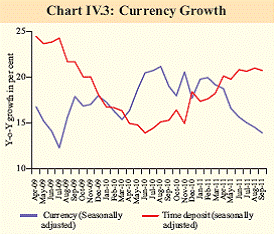
IV.3 While repo auctions under LAF continued to be conducted between 9.30 am and 10.30 am, the Reserve Bank decided to shift the reverse repo auctions under LAF and MSF operations to the afternoon time slot of 4.30 pm to 5.00 pm on all working days (excluding Saturdays) with effect from August 16, 2011. The prime reason for shifting the reverse repo window to the afternoon slot is to encourage the market participants to trade amongst themselves and to park any surplus with the Reserve Bank only after exhausting all other avenues to deploy the funds in the money market. Base money growth slows, reflects moderation in currency expansion IV.4 The decelerating trend of base money since December 2010 continued during the second quarter of 2011-12 mainly on account of an absence of significant injection of primary liquidity by the Reserve Bank. While moderate amount of liquidity was injected through LAF operations, no significant primary liquidity was injected either by way of outright purchases of G-Sec or forex operations. In addition, currency growth, which had witnessed significant acceleration and remained above money supply growth for most part of 2010-11, has also been decelerating since the first quarter of 2011-12 which moderated the base money expansion. The increase in term deposit interest rates since September 2010 prompted a switch from currency holdings and demand deposits to time deposits (Chart IV.3).
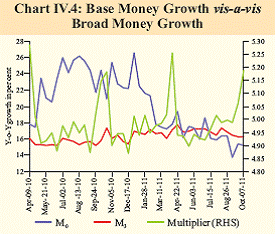
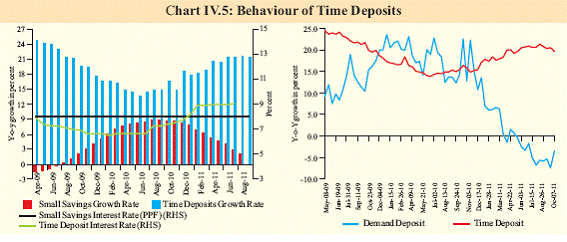
Growing endogeneity of money keeps money supply above trajectory IV.5 While the base money growth has decelerated sharply, the money supply growth accelerated moderately as the money multiplier rose (Table IV.3 and Chart IV.4). This divergent trend in base money and broad money arises out of increasing endogeneity of money supply as banks respond to strong credit demand, which is met through recourse to additional borrowings, including that from the central bank. Robust deposit growth IV.6 Deposits registered robust growth since December 2010 due to successive hikes in interest rates. The opportunity cost of saving in lower interest bearing instruments like small savings increased, resulting in a shift from small savings to term deposits (Chart IV.5).
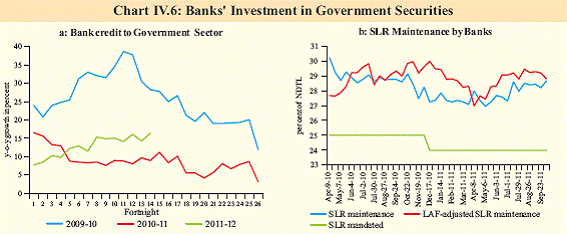
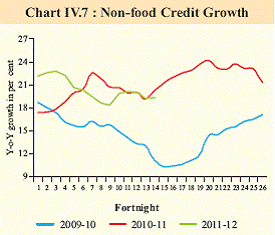
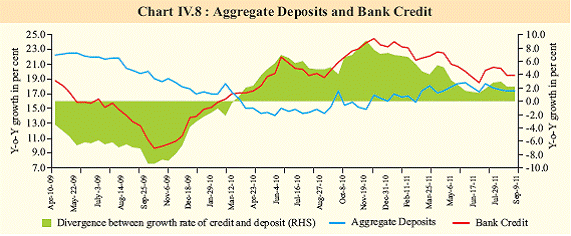
IV.7 During 2011-12 so far, banks’ investment in government securities has accelerated (Chart IV.6 a). However, no sharp rise in SLR maintenance is observed as NDTL has increased at a higher rate (Chart IV.6 b). Credit expansion still above indicative trajectory but may correct ahead IV.8 Credit growth, which had witnessed a sharp deceleration in the first quarter of 2011-12, continued the trend in the initial period of the second quarter, partly reflecting high base of last year (Chart IV.7). Notwithstanding this deceleration, credit growth remained above the indicative trajectory of 18 per cent set out by the Reserve Bank in the July 2011 review, mainly due to high nominal GDP growth. IV.9 During the first three quarters of 2010- 11, the divergence between credit growth and deposit growth was high and growing. As the cost of funds under LAF increased progressively with the rise in the repo rate, banks raised their deposit and lending rates. This stronger transmission of monetary policy helped in narrowing the divergence between deposit and credit growth. The gap between the two declined from 9 percentage points in mid- December 2010 to 5.6 percentage points in March 2011 and further to 2.1 percentage points in October 2011 (Chart IV.8). Non-banking sources dominate credit expansion IV.10 The non-bank sources have occupied the space that was vacated by banks in meeting the credit requirements of the economy during 2011-12 so far (up to September 2011) (Table IV.4). This is reflected in the increase in the share of non-bank sources in total flow of financial resources from about 46 per cent in April-September 2010 to 54 per cent in April- September 2011, with both domestic and foreign funding sources showing significant increase. Within domestic sources, net issuance under CPs, NBFCs-ND-SI and housing finance companies (HFCs) increased. The resource flow from external sources rose on account of higher mobilisation through FDI and ECBs.
Credit expansion not broad-based IV.11 The credit growth of foreign banks registered a sharp rise, while that of public sector banks continued to witness a deceleration in continuation of the trend observed in first quarter of 2010-11. As public sector banks continued to be the largest lenders, the overall credit growth decelerated (Table IV.5).
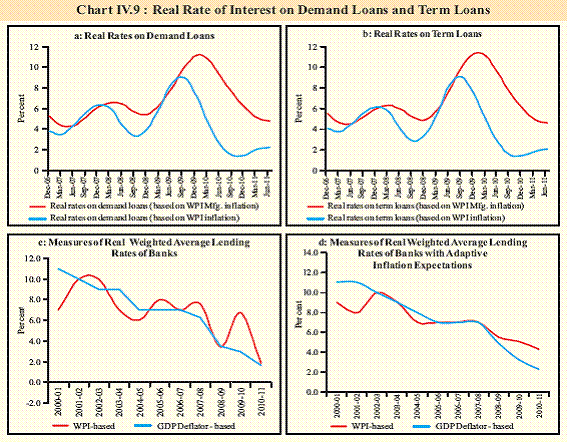
IV.12 The credit deceleration has been diffused over a wide range of sectors that include chemical and chemical products, engineering, power, telecommunications and consumer durables (Table IV.6). The slowdown in credit growth may have been prompted by deceleration in investment demand that could have impacted term loans. Further, the top rated corporates resorted to relatively cheaper sources of borrowings including ECBs and CPs. Real interest rates low and non-disruptive to growth IV.13 Real lending interest rates have remained positive, but low and supportive of growth in the recent period (Chart IV.9). Despite monetary tightening, real interest rates have fallen due to high inflation.
Monetary overshooting a risk in the face of fiscal pressures IV.14 Credit growth has remained strong notwithstanding the successive interest rate hikes. As a result, even though there has been only moderate injection of primary liquidity through LAF transactions, broad money growth has stayed above the indicative trajectory, operating on the impetus provided by the endogenous factors like strong credit growth and high deposit growth, bolstered by substitution from currency to deposits. Going forward however, credit growth could moderate as growth decelerates and inflation moderates. However, even with some deceleration expected in credit growth, containing monetary growth remains a challenge in face of large market borrowing.
|
||||||||||||||||||||||||||||||||||||||||||||||||||||||||||||||||||||||||||||||||||||||||||||||||||||||||||||||||||||||||||||||||||||||||||||||||||||||||||||||||||||||||||||||||||||||||||||||||||||||||||||||||||||||||||||||||||||||||||||||||||||||||||||||||||||||||||||||||||||||||||||||||||||||||||||||||||||||||||||||||||||||||||||||||||||||||||||||||||||||||||||||||||||||||||||||||||||||||||||||||||||||||||||||||||||||||||||||||||||||||||||||||||||||||||||||||||||||||||||||||||||||||||||||||||||||||||||||||||||||||||||||||||||||||||||||
പേജ് അവസാനം അപ്ഡേറ്റ് ചെയ്തത്:


