28. Group - Wise Index Numbers of Industrial Production (Base : 1993-94 = 100) - ആർബിഐ - Reserve Bank of India
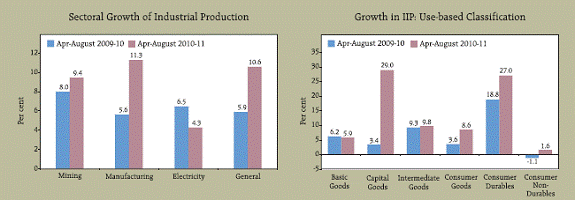
28. Group - Wise Index Numbers of Industrial Production (Base : 1993-94 = 100)
Sr. |
Industry |
Weight |
Annual |
Cumulative |
Monthly |
||||
2007-08 |
2008-09 |
2009-10 P |
April - August |
August |
|||||
2009-10 |
2010-11 P |
2009 |
2010 P |
||||||
1 |
2 |
3 |
4 |
5 |
6 |
7 |
8 |
9 |
10 |
|
General Index |
100.00 |
268.0 |
275.4 |
304.2 |
285.0 |
315.1 |
292.8 |
309.1 |
I. |
Sectoral Classification |
||||||||
1 |
Mining and Quarrying |
10.47 |
171.6 |
176.0 |
193.4 |
179.1 |
196.0 |
178.1 |
190.6 |
2 |
Manufacturing |
79.36 |
287.2 |
295.1 |
327.3 |
305.0 |
339.5 |
314.0 |
332.6 |
3 |
Electricity |
10.17 |
217.7 |
223.7 |
237.2 |
237.0 |
247.1 |
245.1 |
247.6 |
II. |
Use-Based Classification |
||||||||
1 |
Basic Goods |
35.57 |
223.9 |
229.7 |
246.2 |
239.3 |
253.3 |
243.3 |
252.4 |
2 |
Capital Goods |
9.26 |
370.8 |
397.9 |
474.8 |
371.2 |
478.7 |
406.4 |
395.8 |
3 |
Intermediate Goods |
26.51 |
264.1 |
259.0 |
294.3 |
289.4 |
317.9 |
295.6 |
325.2 |
4 |
Consumer Goods |
28.66 |
293.6 |
307.5 |
329.9 |
309.6 |
336.2 |
314.8 |
336.6 |
4(a) |
Consumer Durables |
5.36 |
378.0 |
395.0 |
498.6 |
454.7 |
577.6 |
491.8 |
622.2 |
4(b) |
Consumer Non-Durables |
23.30 |
274.2 |
287.3 |
291.1 |
276.2 |
280.6 |
274.1 |
270.8 |
Source : Central Statistical Organisation, Government of India. |
|||||||||
 |


