 IST,
IST,


Balance Sheet Channel of Monetary Policy Transmission: Insights from Indian Manufacturing Firms
|
Bhavesh Salunkhe, Sapna Goel, Amit Kumar, Preetika, Kunal Priyadarshi and Satyananda Sahoo^ Monetary policy partly influences investment through the balance sheet channel – a mechanism where interest rate changes affect a firm’s financial health (cashflow and net worth) – which in turn impacts its borrowing capacity and investment decisions. The study investigates the existence of balance sheet channel of monetary policy transmission in India by estimating instrumental variable fixed-effects panel regression model for manufacturing firms spanning 2003-2023. It assesses whether investment sensitivity to cashflow changes during different monetary policy phases and varies between constrained (small, highly leveraged) and unconstrained (large, less leveraged) firms. The results confirm the presence of the balance sheet channel, particularly among small firms. Introduction Investment plays a critical role in driving economic growth, and monetary policy is a key tool used by central banks to influence investment activity. The empirical estimates suggest that a one percentage point reduction in the real policy interest rate can increase the investment rate by about 9 basis points (bps) in the short-run and 109 bps in the long-run (RBI, 2020). While the extant literature has empirically examined the effectiveness of monetary policy transmission in India across various channels [Patra et al., (2016); Khundrakpam and Jain (2012); Mohan (2008) etc.], the studies on balance sheet channel which operates by affecting a firm’s financial health – cashflow and net worth – influencing its borrowing capacity and investment decisions are limited [Angelopoulou and Gibson (2009); Bernanke and Gertler (1995); and Oliner and Rudebusch (1994) etc.] and under-researched in India. Tight monetary policy can weaken firms’ financial positions by lowering equity prices, reducing net worth, and raising borrowing costs, thereby limiting access to credit and curbing investment. This mechanism— central to the balance sheet channel of monetary policy transmission— has been observed in countries like Japan (Masuda, 2015) and the U.S. (Kashyap et al., 1992). Weaker balance sheets raise the external finance premium—the additional cost of external funds (such as debt and equity) over internal funds—making borrowing more expensive and further constraining investment, particularly for financially constrained firms. This study seeks to fill this gap by examining whether changes in monetary policy affects the sensitivity of investment to cashflow in Indian manufacturing firms (2002-03 to 2022-23), and whether this sensitivity differs between financially constrained (small, highly leveraged) and unconstrained (large, less leveraged) firms. Following Angelopoulou and Gibson (2009), the study estimates Tobin’s Q-model to assess the cashflow sensitivity of investment under different monetary policy periods. The findings suggest that the balance sheet channel of monetary policy transmission is active amongst the Indian manufacturing firms, particularly in small firms, while no conclusive differences are found across leverage groups. The rest of the study is organised as follows – section II highlights stylised facts about investment in India, followed by literature review in section III. Section IV discusses data sources and methodology, while section V elucidates the empirical exercise and results. Finally, section VI concludes. II. Investment Trends in India: Stylised facts Post the liberalisation reforms of 1991, fixed investment1 in India gained traction with manufacturing sector commanding an average share of 31.4 per cent in overall gross fixed capital formation (GFCF) during 1995-99. Since 2000s, however, with a shift in foreign direct investment inflows from manufacturing to services sector and emergence of new services activity, India’s overall GFCF has been driven by services thereafter. Fixed investment rate in India peaked at 35.8 per cent in 2007-08. It was 28.5 per cent in 2019-20, before regaining some momentum in the post-pandemic period (Chart 1). At the institutional level, within the manufacturing sector, the share of public sector investment has reduced, while private corporates have managed to hold ground albeit with some moderation since 2015- 16. Investment by the household sector, however, has risen since 2016-17 (Chart 2).    Fazzari et al. (1988) conducted a pioneering study estimating the sensitivity of investment to cashflow across different types of firms. They found that internal and external finances are not perfectly substitutable, with internal funds offering a cost advantage. Notably, investment by financially constrained firms is highly sensitive to cashflow, unlike unconstrained firms that can more easily access external financing. Similarly, firm-level data for Indian manufacturing firms reveal that both size and leverage2 of firms significantly affect investment decisions. While large firms have historically maintained higher investment and cashflow, small firms experienced a notable rise in both during 2021–23, indicating a potential shift in financial dynamics (Chart 3). Highly leveraged firms had consistently higher investment than cashflow until 2021-23, when cashflow surpassed investment. These firms have initially focused on high investment despite moderate cashflow, especially during 2008-09. Recent trends (especially 2021-23), however, indicate a shift towards improving cashflow, possibly to manage debt better or strengthen liquidity. In contrast, significantly higher cashflow than investment for less leveraged firms, implies a cautious and self-sufficient approach focused on maintaining liquidity and reducing financial risk (Chart 4). Different phases of monetary policy tightening, based on policy rate movements, have been identified for the study period. The first phase (October 2005-September 2008) witnessed a 300 bps hike in repo rate and 400 bps in cash reserve ratio (CRR). Owing to heightened supply-side pressures, the second phase (March 2010-March 2012) featured a 375 bps repo rate increase. In the third phase (September 2013-December 2014), the repo rate rose by 75 bps and the fourth phase (June 2018-January 2019) saw a 50 bps hike due to elevated crude oil prices and certain policy measures. Lastly, in the fifth phase (May 2022–Dec 2023), a 250 bps increase was implemented to counter inflationary risks (Chart 5).3  The literature on transmission mechanisms of monetary policy, in general, documents four key channels – (i) interest rate, (ii) credit aggregates comprising balance sheet and bank lending, (iii) exchange rate and (iv) asset prices (Mishkin, 1995). In recent times, however, expectations channel has gained significance, given the forward-looking nature of the monetary policy. The credit channel, which gained recognition following the seminal work of Bernanke and Gertler (1995), highlights that due to the existence of information asymmetries, investment is impacted by net worth of a firm. Therefore, even a minor monetary policy shock can have a notable impact on firm’s investment behaviour. Reinforcing these findings, Angelopoulou and Gibson (2009); and Oliner and Rudebusch (1996) examined the balance sheet channel and concluded that firms, especially the constrained ones, become more sensitive to cashflow fluctuations during periods of monetary policy tightening as the cost of external finance would be higher relative to internal financing. Similarly, using loan-level data, Aysun and Hepp (2013) also supported the existence of balance sheet channel. However, several studies such as Erickson and Whited (2000), present a critique of cashflow as a variable by reporting no statistical significance of the variable. While Sahoo and Bishnoi (2023) and Rafique et al. (2021) posit a positive significant impact of cashflow on firm investment, Cleary (1991) inferred that the unconstrained firms are more sensitive to cashflow availability to fund their investments. Additionally, a positive link has been affirmed between a firm’s Tobin’s Q ratio and their investment in studies by Fazzari et al. (1988), Masuda (2015) and Rafique et al. (2021). Sahoo and Bishnoi (2023) further support this association, specifically, for manufacturing firms in India.  The prevailing literature underscores the intricate nature of monetary policy transmission and its impact on firm’s investment behaviour. Further, financial indicators such as Tobin’s Q ratio and profit after tax (PAT) offer insights into firm’s valuation and cashflow dynamics, highlighting their critical role in investment decisions under varying financial conditions. Building on this vast body of knowledge and dearth of such studies in Indian context, this study aims to gauge the understanding and effectiveness of the balance sheet channel of monetary policy transmission and its impact on Indian manufacturing firms. IV. Data Description and Methodology The study uses firm level annual data on 779 listed Indian manufacturing firms spanning 2002-03 to 2022-23. The data have been sourced from the ProwessIQ database, maintained by the Centre for Monitoring Indian Economy (CMIE). The measures to capture monetary policy phases are constructed using data from Handbook of Statistics on Indian Economy published by the RBI. For disaggregated analysis, following Masuda (2015) and Balfoussia and Gibson (2018), the firms are categorised by size (small vs. large) and leverage (high vs. less). The size of a firm is measured by its total assets. Average total assets of a firm are computed over the sample period thereby, providing the size distribution of the firms. Small firms are then defined as those with an average total assets below the 50th percentile of the size distribution, while the rest are classified as large. Being relatively young and less established, small firms typically have limited collateral and are considered financially constrained (Angelopoulou and Gibson, 2007). Similarly, leverage, the amount of debt a firm uses to finance its assets, is measured as the ratio of total (long-term) debt to equity. Firms above the median leverage ratio are classified as highly leveraged. Due to higher default risk, such firms also face financial constraints. IV.1 Variable Description Dependent Variable (INVit): ‘Firm level investment’ defined as annual change in gross fixed assets of the firm, scaled by the firm’s average total assets over period ‘t’ and ‘t-1’ has been used. This adjustment ensures that the investment metric is standardised across companies of different sizes, thereby, controlling for bias due to variation in company size within the sample. Independent Variables (i) Cashflow (Cashit) Profit after tax (PAT) scaled by firm’s total assets has been used as a proxy for a firm’s cashflow (Angelopoulou and Gibson, 2009; and Gupta and Mahakud, 2019). (ii) Tobin’s Q Ratio (Qratioit) It is a ratio developed to compare the market value of a firm’s assets to their replacement cost. A Q > 1 implies that the market values the firm’s assets more than the cost of replacing its assets, suggesting an incentive to invest. On the other hand, a Q < 1 indicates that the firm’s assets are valued less by the market than their replacement cost, signalling disinvestment. It thus helps to control for firm’s opportunities and incentives to investment. However, the replacement cost of capital is not directly observable and accordingly, as suggested in literature, the average total assets has been taken as its proxy. Following Sahoo and Bishnoi (2023), the Q-ratio has been specifically tailored for the Indian context as follows:  where, ‘Market value of the equity’ is the product of ‘shares outstanding’ and ‘weighted average price of share’ of the firm, while ‘Book value of debt’ is proxied by ‘Long term borrowing’. (iii) Monetary Policy Measures Two monetary policy measures have been used to represent the monetary policy phases in India. (a) Narrative Measure (NM): Following Angelopoulou and Gibson (2007), monetary policy dummies at monthly frequency have been constructed that take value ‘1’ during the months of monetary policy tightening and ‘0’ otherwise. They are then averaged over the year to match yearly frequency of firm level data. Different tightening phases of monetary policy identified based on direction of change in the policy repo rate are October 2005-September 2008, March 2010-March 2012, September 2013-December 2014, June 2018-January 2019, and May 2022-December 2023. (b) Weighted Average Call Money Rate (WACR): Over the estimation period, the Reserve Bank followed two broad approaches of monetary policy, viz., multiple indicator approach (2003 to Q3 of 2016) and inflation targeting framework thereafter, with repo rate as the main tool. Initially, policy signals were conveyed through both repo and reverse repo rates under the liquidity adjustment facility, with the effective rate depending on liquidity conditions (Kapur and Behera, 2012). Since May 2011, the repo rate became the sole policy rate and the WACR was explicitly recognised as the operating target of monetary policy due to faster transmission of signals (RBI, 2011). Under the current flexible inflation-targeting framework adopted in May 2016, the WACR continues to be the operating target of monetary policy and this study, therefore, uses the WACR to represent monetary policy phases. (iv) Real GDP Growth Annual real GDP growth has been included with one-period lag. (v) Dummy Variables Taking cognisance of three major crises that have occurred during the sample period, three dummy variables are included – global financial crisis (GFC) dummy (2008-09), high non-performing assets (NPA) dummy (2013-18) and Covid-19 dummy (2020-22). These dummies take value ‘1’ for crisis years and ‘0’ otherwise. IV.2 Model Specification Instrumental variable fixed-effects panel regression model has been used to estimate the relationship among investment, firm specific financial variables, real GDP growth and monetary policy. This relationship can be expressed in the form of following regression model, also called augmented specification of Q-model (Fazzari et al., 1988). 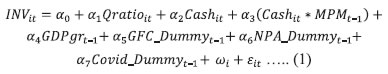 where, subscript ‘it’ indicates firm ‘i’ in period ‘t’. MPMt-1 is monetary policy measure in the previous period, 'ωi' controls for firm-specific fixed effects, and εit is the error term. The instrumental variable fixed effects model has been used due to possible endogeneity of ‘Q’ variable in the model (investment decisions of firms affect their market value and replacement cost of assets). The Hausman specification test suggests rejection of random effects model in favour of fixed effects. V. Summary Statistics and Econometric Findings V.1 Descriptive Statistics Small firms, being younger and less established, have lower and more volatile investment and cashflow than large firms on average. Highly leveraged firms exhibit higher average investment than their less leveraged counterparts. Moreover, the lower average Tobin’s Q ratios of small and highly leveraged firms suggest that large and less leveraged firms enjoy better opportunities and incentives to invest (Table 1). V.2 Econometric Results As stated, NM and WACR have been used to represent monetary policy phases. While column (1) of Table 2 shows the baseline specification of Equation 1 (specified in section IV.2), columns (2) and (3) include interaction of cashflow variable with NM and WACR, respectively, to test if cashflow sensitivity of investment varies with monetary policy phases. Assuming one-year period as sufficient for the transmission process, lagged values of monetary policy measures (NM and WACR) have been used in the interaction term. The cashflow coefficient in normal times is statistically significant and negative4 (Columns 2 and 3 in Table 2), implying less investment in the current period indicated by a build-up of cashflow. The interaction term, however, is positive and statistically significant for both measures of monetary policy. It implies that during periods of tight monetary policy, firms face financing constraints, making them rely more on internal funds for investment. This suggests the presence of balance sheet channel of monetary policy transmission across manufacturing firms. Alternatively, during expansionary monetary policy periods, the firms are less constrained by internal finances (cashflow) as access to external finance becomes easier. This underscores the proposition that monetary policy affects the investment not only through cost of capital channel but also by increasing external finance premium. Tobin’s ‘Q’ is positive and statistically significant across all specifications, reflecting the vital role played by capital markets in a firm’s investment opportunities. GDP growth also has a positive and statistically significant impact on firm’s investment. Covid-19 and NPA dummies are negative and statistically significant, as expected. Delving into the sub-samples, Tables 3 and 4 demonstrate the estimation results for small and large firms, respectively.5 In normal times, the cashflow coefficient is negative and statistically significant for small firms, while for large firms, it is positive but statistically significant only in case of model with WACR (Table 4). When monetary policy is tight, the cashflow sensitivity of small firms becomes positive and statistically significant (columns 2 and 3 in Table 3), showing that their investment decisions depend more on their internal funds due to financial constraints. Conversely, an expansionary monetary policy would ease these constraints, reducing their reliance on cashflow for investment. For large firms, tight monetary policy reduces cashflow sensitivity. These findings are in consonance with Angelopoulou and Gibson (2009); and Oliner and Rudebusch (1994) and indicate the presence of balance sheet channel in case of small firms. Tobin’s ‘Q’ has positive and statistically significant impact on investment of both small and large firms. Moreover, the NPA and Covid-19 dummies are negative and statistically significant as expected for both firm sizes. While the impact of these crises on small firms is expected, large firms may have experienced a decline in investment activity due to supply chain disruptions, heightened global uncertainty, falling demand and increased underutilisation of capacity. GDP growth variable is significant only in case of large firms. GFC dummy has a positive but statistically insignificant impact on investment of both firm sizes. The estimation results for highly leveraged and less leveraged firms are presented in Tables 5 and 6, respectively.6 In normal times, the cashflow coefficient is negative for both highly leveraged and less leveraged firms but is only statistically significant in specific cases. During tight monetary policy, the cashflow sensitivity of investment becomes positive for both firm types, suggesting increased reliance on internal funds and presence of balance sheet channel. Unlike in case of size based classification, the difference in cashflow sensitivity of investment between these two firm types is inconclusive. Tobin’s Q ratio has a positive and statistically significant impact on investment of both highly leveraged and less leveraged firms. GDP growth has a positive and statistically significant impact on investment only for highly leveraged firms while the NPA and Covid-19 dummies are negative and statistically significant for both types of firms. This could be due to shrinkage in their cashflow, heightened risk of default during Covid-19 and limited access to credit during NPA crisis. The balance sheet channel of monetary policy transmission emphasises how changes in interest rates affect a firm’s net worth, cashflow, and liquidity – factors that influence its borrowing capacity and investment decisions. This study investigates the presence of balance sheet channel in India using firm level data on manufacturing firms over two decades (2003-2023). The analysis employs an instrumental variable fixed-effects panel regression model to examine the relationship between investment, firm-specific financial variables, real GDP growth, and monetary policy. The findings confirm the presence of the balance sheet channel in manufacturing firms. Furthermore, a detailed analysis, segmented by firm size and leverage, suggests that small firms, being more financially constrained, are more sensitive to internal funds under tight monetary policy. Large firms, with better access to external finance, are relatively less affected. While the balance sheet channel operates for both highly leveraged and less leveraged firms, there is no clear evidence of differences in their sensitivity to cashflow. These findings suggest that strengthening corporate balance sheets and targeted credit support – particularly for small firms – can enhance the effectiveness of accommodative monetary policy in stimulating investment. Future research can explore sector-specific patterns to deepen understanding of transmission dynamics across industries. References: Angelopoulou, E., and Gibson, H. D. (2009). The Balance Sheet Channel of Monetary Policy Transmission: Evidence from the United Kingdom. Economica, 76(304), 675-703. Ashcraft, A. B., and Campello, M. (2007). Firm Balance Sheets and Monetary Policy Transmission. Journal of Monetary Economics, 54(6), 1515-1528. Aysun, U., and Hepp, R. (2013). Identifying the Balance Sheet and the Lending Channels of Monetary Transmission: A Loan-Level Analysis. Journal of Banking and Finance, 37(8), 2812-2822. Bernanke, B., and Gertler, M. (1995). Inside the Black Box: the Credit Channel of Monetary Policy Transmission. Journal of Economic Perspectives, 9(4), 27-48. Boschen, J. F., and Mills, L. O. (1991). The Effects of Countercyclical Monetary Policy on Money and Interest Rates: An Evaluation of Evidence from FOMC Documents. Federal Reserve Bank of Philadelphia Working Papers No. 91-20. Boschen, J. F., and Mills, L. O. (1995). The Relation between Narrative and Money Market Indicators of Monetary Policy. Economic Inquiry, 33(1), 24-44. Cleary, S. (1999). The Relationship between Firm Investment and Financial Status. The Journal of Finance, 54(2), 673-692. Erickson, T., and Whited, T. M. (2000). Measurement Error and the Relationship between Investment and Q. Journal of Political Economy, 108(5), 1027-1057. Fazzari, S., Hubbard, R. G., Petersen, B., Blinder, A., and Poterba, J. (1988). Financing Constraints and Corporate Investment. Brookings Papers on Economic Activity, 1988(1), 141-206. Gupta, G., and Mahakud, J. (2019). Alternative Measure of Financial Development and Investment- Cash Flow Sensitivity: Evidence from an Emerging Economy. Financial Innovation, 5(1), 1. Kapur, M. and Behera, H. (2012). Monetary Transmission Mechanism in India: A Quarterly Model. RBI Working Paper Series, WPS (DEPR) 09/2012. Kashyap, A., Stein, J., and Wilcox, D. (1992). Monetary Policy and Credit Conditions: Evidence from the Composition of External Finance. The American Economic Review, 83(1), 78-98. Khundrakpam, J., and Jain, R. (2012): Monetary Policy Transmission in India: A Peep Inside the Black Box. RBI Working Paper Series No. 11, 11/2012. Masuda, K. (2015). Fixed Investment, Liquidity Constraint, and Monetary Policy: Evidence from Japanese manufacturing firm panel data. Japan and the World Economy, 33, 11-19. Minguez J.M.G. (1997). The Balance-Sheet Transmission Channel of Monetary Policy: The Cases of Germany and Spain. Bundesbank Document No. 9713. Mishkin, F. (1995). Symposium on the Monetary Transmission Mechanism. Journal of Economic perspectives, 9(4), 3-10. Mohan, R. (2008). Monetary Policy Transmission in India. BIS papers, 35. Oliner Stephen, D., and Rudebusch, G. D. (1996). Is there a Broad Credit Channel for Monetary Policy? Federal Reserve Bank of San Francisco Economic Review, 1, 3-13. Patra, M. D., Pattanaik, S., John, J., and Behera, H. K. (2016). Monetary Policy Transmission in India: Do global Spillovers Matter? Reserve Bank of India Occasional Papers, 37(1), 1-34. Rafique, A., Quddoos, M. U., Ali, S., Aslam, F., and Ahmad, M. (2021). Monetary Policy Transmission: Balance Sheet Channel and Investment Behavior of Firms in Pakistan. Economic Journal of Emerging Markets, 13(1), 1-12. Ramey, V. (1993). How important is the Credit Channel in the Transmission of Monetary Policy? In Carnegie-Rochester Conference Series on Public Policy, 39, 1-45. North-Holland. RBI (2006). Annual Report 2005-06. Reserve Bank of India. RBI (2009). Annual Report 2008-09. Reserve Bank of India. RBI (2010). Annual Report 2009-10. Reserve Bank of India. RBI (2011). Report of working group on operating procedure of monetary policy. RBI (2020). Report on Currency and Finance 2020-21. Reserve Bank of India. RBI (2022). Monetary Policy Report. September. Reserve Bank of India Sahoo, P., and Bishnoi, A. (2023). Drivers of Corporate Investment in India: The Role of Firm-Specific Factors and Macroeconomic Policy. Economic Modelling, 125, 106330. ^ Bhavesh Salunkhe, Sapna Goel, Amit Kumar and Satyananda Sahoo (ssahoo@rbi.org.in) are from the Department of Economic and Policy Research (DEPR), Kunal Priyadarshi is from Financial Markets Regulation Department (FMRD) and Preetika was a research intern in DEPR. The views expressed in this article are those of the authors and do not represent the views of the Reserve Bank of India (RBI). 1 Since, GFCF roughly comprises 90 per cent share in overall investment, the section focuses on trends relating to fixed investment only. 2 The criteria of splitting the sample based on size and leverage have been discussed in detail in section IV. 3 The details of each phase are discussed in Annex Table 1. 4 Although cash flow coefficient is negative and statistically significant in the current period, it was positive and statistically significant at lag 1, indicating lagged impact of cash flow on investment of firms. 5 For robustness check, in an alternate scenario, small firms have also been defined as the firms whose average size is less than the 75th percentile of average size distribution over the sample period. The results are similar and provided in the annex tables 2(a) and 2(b). 6 Highly leveraged firms have also been defined based on the mean leverage ratio being greater than the 75th percentile and the rest being considered as less leveraged. The results were inconclusive and are provided in the annex tables 3(a) and 3(b). |

ഈ പേജ് ഷെയർ ചെയ്യുക:


റിസർവ് ബാങ്ക് ഓഫ് ഇന്ത്യ മൊബൈൽ ആപ്ലിക്കേഷൻ ഇൻസ്റ്റാൾ ചെയ്ത് ഏറ്റവും പുതിയ വാർത്തകളിലേക്ക് വേഗത്തിലുള്ള ആക്സസ് നേടുക!
ഞങ്ങളുടെ ആപ്പ് ഇൻസ്റ്റാൾ ചെയ്യാൻ QR കോഡ് സ്കാൻ ചെയ്യുക


പേജ് അവസാനം അപ്ഡേറ്റ് ചെയ്തത്:


