 IST,
IST,


ESG Disclosures and Performances: Cross-Country Evidence
by Saurabh Ghosh^ and Siddhartha Nath^ We present a cross-country empirical analysis indicating that the Environmental, Social and Governance (ESG) indices performed better than their broad market counterparts. In the literature there are debates surrounding whether ESG activities are in the interest of shareholders or the outcome of agency problems. Our article fits at the heart of this debate and suggests that the ESG indices withstood the unanticipated shock (COVID19) better than the broad market indices. In the backdrop of these findings, we discuss some policy options to encourage undertaking of ESG initiatives by the Indian corporates. Introduction The term “Environmental, Social and Governance (ESG)” risks refer to the risks that the governments, corporates and financial institutions are exposed to due to large scale trends, e.g., climate change, resource scarcity, demographic shifts etc. In the context of corporate finance, discussions on ESG frequently include how companies integrate and manage these risks as part of their business models, and to what extent investors integrate them into their decisions. The growing emphasis on ESG risks by the public authorities across the globe shows the paramount importance of managing these risks to ensure sustainable growth process. The most effective way to institutionalise this practice would be to integrate these principles into the investment policy and practices. Public authorities across the globe are paying increasing attention to the integration of these principles into their regulatory frameworks (BIS, 2021). Building on the recommendations of the Task Force on Climate-Related Financial Disclosures (TCFD), the International Sustainability Standards Board (ISSB) released its first set of proposed sustainability standards for comment. These standards also include industry-based disclosure requirements derived from the Sustainability Accounting Standards Board (SASB). Most of the large economies around the world including India have already come a long way by making sustainability disclosures mandatory for listed corporations. However, transparency and reporting standards of these disclosures continue to remain as a challenge for broad-based implementation of this policy (Bouye et. al. (2021)). While it is almost unanimous that better disclosure standards will benefit regulators in the long-term, there are some debates relating to their short-term consequences. A large body of available literature (Cai et. al. (2016), Liang and Renneboog (2017a and 2017b))1 suggests that the ESG related performances by the corporations in a country are associated with the country’s economic development, legal systems promoting competition, civil liberties, political rights, harmony, autonomy etc. At the firm-level, higher ESG considerations are associated with better corporate governance, higher institutional ownership, balanced gender-political leaning of the board members etc., (Gillan et. al. (2021)). In the context of business, increasing ESG considerations are generally found to be associated with goodwill, reputation and positive consumer perception (Schiller (2018), Dai et. al. (2020)). This provides a company with fair justifications why they might choose to integrate these principles into their business models. Despite these evidences favouring ESG considerations, there are debates surrounding whether ESG activities are in the broader interest of shareholders or the outcome of agency problems (Gillan et. al., (2021)). Moreover, undertaking ESG initiatives by the corporations might be mixed with scepticism, especially by the smaller, capital starved entities. In fact, a branch of literature suggests that higher disclosures of ESG risks and stricter screening by the authorities may lead to lower stock prices and higher cost of raising capital for a firm (Heinkel et. al., (2001), Chava (2014), Ng and Rezaee (2015) etc.), potentially discouraging them from undertaking ESG disclosures and initiatives. Our article fits at the heart of this debate, and the evidences presented in this article suggest that the stock price indices of companies leading in ESG initiatives have generally outperformed the broad market indices over the long-term in most of the advanced and emerging market economies. This means that undertaking ESG considerations may be associated with better financial market returns than not undertaking such considerations. The rest of this article is organised as following: Section 2 explains the data used for our analysis, followed by cross-country exploratory data analysis in Section 3. In Section 4, we use two empirical models (difference-and-difference and Market Model) to substantiate that stock prices of companies that led in terms of ESG initiatives performed better than the overall market during the COVID-19 pandemic. Finally, Section 5 concludes the paper. We have used Morgan Stanley Capital International (MSCI) ESG indices for our analysis. We chose 18 countries for our analysis, 10 emerging economies, viz., Brazil, China, India, Indonesia, South Korea, Malaysia, Russia, South Africa, Taiwan and Thailand: and 8 advanced economies, viz., Australia, Canada, Hong Kong, Japan, Sweden, Switzerland, UK and USA. The sample period for our analysis ranges from September 2010 to August 2021. MSCI ESG leaders’ indices are constructed on the basis of ESG ratings for the companies given by MSCI. MSCI ESG ratings for the companies measure a company’s exposure and resilience to those long-run ESG risks that are financially relevant. MSCI ESG ratings are designed to pick up certain risks that are overlooked by the conventional assessment of financial risks, which could impact the financial performance, once they materialise2. Along with the exposure of a company to certain risks, MSCI ESG ratings also look at how the company is managing those risks3. Companies are provided ratings based on these aspects and ESG ratings help identifing companies that are leading or lagging within their industry peers. As a result, MSCI ESG indices are designed to facilitate integration of ESG considerations into an investor’s investment decisions. To assess companies’ and the sectors’ exposure to and management of ESG related risks, MSCI collects data from a variety of sources that are mostly publicly available, e.g., academia, government, NGO databases, Transparency International, US EPA, and World Bank (MSCI, 2022). Company specific information are collected from various disclosures from the companies, government databases on ESG compliances and controversies, media reports, NGOs, stakeholder sources etc. MSCI identifies 35 ‘key issues’ under 10 broad themes covering all pillars; environmental, social and governance (Table 1 in the Annex). The final ESG rating of a company is defined as a weighted average of ratings on individual key issues. Company ratings are then normalised relative to their industry peers. The weights are defined for an industry by considering both the positive and negative impacts of that industry’s operations on environment and society, and the timeline within which these impacts are expected to materialise. For instance, a key issue identified as “High Impact” and “Short Term” would be weighted three times higher than a key issue identified as “Low Impact” and “Long Term”. The industry weights are applied on each company’s score on each of the key issues to arrive at the aggregate performance of that company, which is then normalised within its own industry, and provided ratings between best (AAA) and worst (CCC). The index compositions i.e., the number of constituents/companies and the weights of top constituents in both in MSCI broad and MSCI ESG Leaders index for the sample countries are provided in Table 2 in the Annex. There is one caveat that needs to be mentioned. For most of the countries, the Broad MSCI index is generally a superset, as they mostly include companies that are in MSCI ESG leaders’ index. Notwithstanding this shortcoming, we continue with this study, as it is difficult to get watertight compartmentalised indices with only ESG leaders or non-ESG-leaders, and as it does not alter any of our conclusions. MSCI provides both price and market capitalisation indices consisting of the companies which lead in terms of ESG considerations. These companies are also referred to as the ESG leaders within the countries4. Alongside the ESG indices, we have also used the MSCI broad market indices based on both market capitalisation and prices in this article. For all the countries in our sample, the growth in ESG market capitalisation indices were higher than the growth in ESG leaders’ price indices (Chart 1). These gaps suggest that all the countries (except Malaysia and Brazil) have experienced growth in the volume, or the number of shares issued by the ESG leaders in their countries. We would, however, focus on the ESG price indices in the remaining part of this article because of two reasons. First, ESG market capitalization and the ESG price indices moved quite closely among the sample countries (Chart 1), and second, price movement captures forward-looking investors’ expectations about the ESG leaders’ better than the number of issuances. 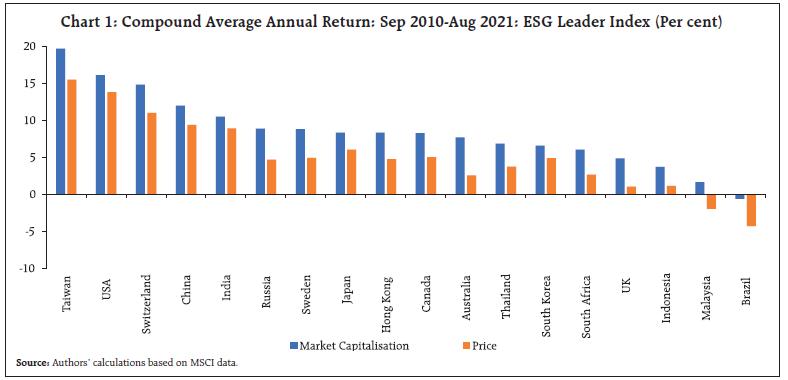 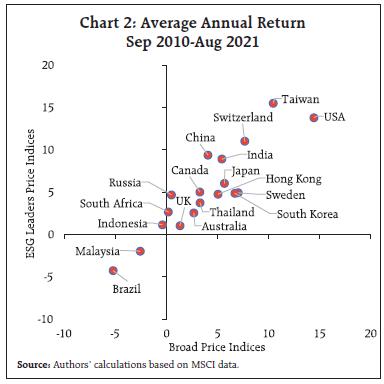 III. Exploratory Data Analysis Cross-Country Evidence The average annual returns in ESG price indices were consistent with the returns in broad price indices (Chart 2). The ESG leaders’ indices have outperformed the broad indices for most of the countries in our sample (Chart 3). In chart 3, we normalised each indicator with respect to 2010, and then took the ratio between ESG indices and the Broad market indices. A higher ratio indicates that the ESG leaders’ index has outperformed the broad index. This suggests that the companies which managed and disclosed their ESG related risks better were associated with higher prices for their equities, compared to a larger set of listed companies. India ranks ahead of all the countries except China and Taiwan in terms of the relative returns in ESG leaders’ index. The relative growth in India’s ESG index was also among the topers during this period within the set of 18 countries in our sample as shown in Chart 4, where the orange line indicates India’s ESG leaders’ index relative to India’s broad market index, both rebased to 20105. The lower end of the shaded boundaries indicates the minimum value of this measure among the sample countries and the upper end of the shaded boundaries indicates the maximum value. 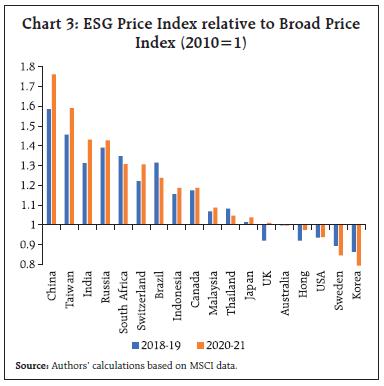 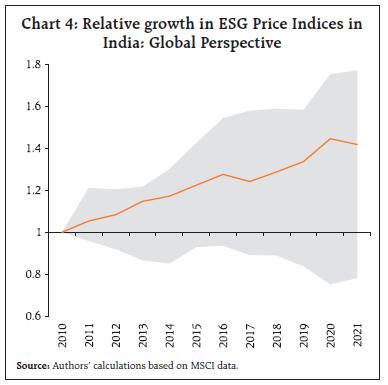 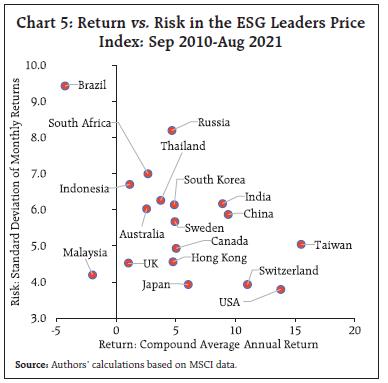 During the sample period, there is no clear association between the average annual returns and the average risks in the ESG leaders’ price indices among the set of countries (Chart 5). The risks in ESG indices, however, were broadly in line with the risks in the broad indices across countries (Chart 6). In general, the risk in both broad indices and ESG indices were higher in EMEs as compared with the AEs. India is not an exception, where risks in both ESG and the broad indices were higher than majority of the countries (Chart 6). A Kernel Density plot for the monthly ESG returns for India, and for all other countries in our sample (excluding India) suggests that India’s monthly ESG returns generally have a fat right tail, indicating larger probability of higher return (Chart 7). For India the return distribution was rather Platykurtic compared to the rest of the world, which explains why the standard deviation of the monthly ESG index return was more for India. We also analyse the volatility clustering of broad and ESG indices using a GARCH (1,1) equation. Our finding indicates that volatility, in general, was lower in the AEs as compared to EMEs both in the Broad and the ESG indices. For India, ESG index’s GARCH volatility was lower than the volatility in the Broad index returns (Chart 8), though the clustering patterns were similar in both the series. 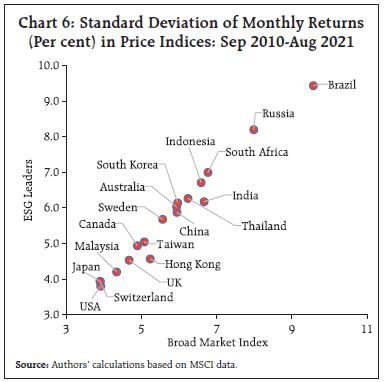 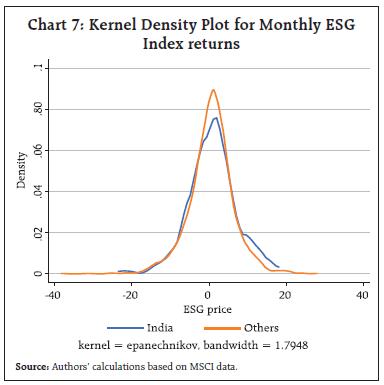 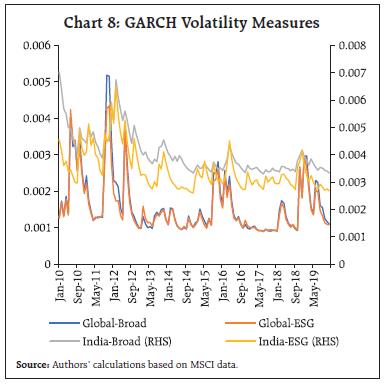 In line with the volatility clustering, we attempt to quantify the transmission of broad market risks to the price indices of ESG leaders. In Table 1, we first classify the broad market returns into two categories, “extreme” and “normal” as shown in the first column. To do this, first we observe the monthly returns in broad market index of a single country between September 2010 and August 2021 and observe both the average and standard deviation for the whole period for each country separately. We called a monthly return an “extreme” one if the return for a period is either above or below the one-standard deviation band around the average for that country. Similarly, we categorise the returns in ESG leaders’ index. Thereafter, we calculate in how many instances, an “extreme” event in broad market index has also coincided with “extreme” events in the ESG leaders’ index. For instance, for India, 78 per cent (i.e., 23 out of 30) of the “extreme” events in the broad index translated into “extreme” events in the ESG leader’s index. This serves as a measure of risk transmission from broad market index to ESG leaders’ index. Table 1 suggests that this measure of risk transmission was among the lowest in case of India within the selected countries. Percentage of ‘Extreme’ events in Broad Indices that got translated into ‘Extreme’ events in ESG Indices is around 86 per cent on average for our sample set of countries. This suggests that the companies included in the MSCI-ESG index were rather insulated from the broad market price fluctuations to some extent. In case of India, this proportion 78 percent, less than the average of other countries, indicating that the stocks in ESG-index were to some extent shielded from the extreme price movements in the broad markets. The major takeaways from this section are that companies with ESG disclosures have generally performed better, in terms of their returns and volatilities, relative to a broader set of companies across countries. The stylised facts presented so far suggest that stock price indices’ return for ESG leaders have generally exceeded the broad market in the long-term. Empirically, a robust validation of this fact requires us to see the returns around a purely exogenous shock like the COVID-19 pandemic. We do this through two different approaches; first, estimating a difference-in-difference or ‘double difference’ model and second, by estimating the cumulative average returns (CAR) from a ‘Market Model’ on country-wise returns in ESG leaders’ and broad market indices between September 2010 and October 2020. (a) Difference-in-difference Model The double differencing would suggest the difference in returns in ESG leaders post- COVID-19 vis-a-vis the non-ESG leaders, after accounting for the shocks that might have impacted both sets of firms. In this vein, we used a pooled dataset consisting of monthly returns on country-ESG leaders’ (our treatment group that follows and discloses ESG related information) with the broad market indices (control group) between September 2010 and October 2020. The sample countries remained same as discussed in the data section. We created a dummy variable called “ESG” that took value 1 corresponding to the observation on ESG leaders index returns, and 0, corresponding to the broad market returns. We chose the post-COVID outbreak period for this impact analysis as January-October 2020 for the following reasons: after the initial outbreak of COVID-19 and associated lockdowns in almost all the major countries worldwide between January-May 2020, the second major spike took place around the end of October 2020 in most of Europe and USA. Although the actual dates of the surge may slightly vary between the countries in Western Europe and USA, pre-November 2020 broadly serves as a reasonable timeline for the impact of first wave across the globe. Post-October 2020, several waves of infections have taken place in most of the countries, but at different points in time, making it difficult to estimate a pure pandemic shock. We, on the other hand, use January 2020 as the starting point of the global outbreak of COVID-19 pandemic and create another dummy variable, “COVID” that assumed value 1 corresponding to all the months since January 2020, zero for the earlier months. This research design will help us to identify whether following ESG rules and disclosing them are associated with firms to withstand unanticipated shocks better than the others across countries. The empirical estimation of this effect is done by estimating the following regression model: 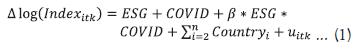 The coefficient β of the interaction term ESG*COVID would measure by how much the returns in ESG indices may have differed from the returns in broad indices during COVID-19 period, as compared to the pre-COVID period. The β term represents the causal impact of ESG disclosures in the difference-in-difference set-up. Subscripts i, t and k represent country, month and the indices (ESG or broad). The estimation results are presented in Table 2. It suggests that monthly returns in ESG indices generally exceeded that of the broad indices during an unanticipated shock (e.g., COVID), as the Esg*Covid coefficient is positive and significant at conventional statistical levels. This result could be interpreted as following ESG rules and disclosure could causing better stock performance. For brevity, we do not report the coefficient of country fixed dummies, which we introduced to control for estimates across different countries. The coefficient of the COVID dummy is negative and statistically significant which indicates that the monthly returns on both ESG leaders’ and in broad indices on average were lower during the COVID-19 pandemic as compared to the pre-pandemic periods. The ESG coefficient is positive and significant, which indicates that on average ESG indices perform better than the broad market index. (b) Market Model The abovementioned difference-in-difference estimates could have a few limitations. First, we do not have any explicit index that capture only the non-ESG leaders. Therefore, some of the companies that are present in the ESG leaders’ indices are also present in the broad market indices. Second, in some of the stylised facts presented earlier, we show that the ESG leaders’ indices have broadly outperformed the broad market indices and this gap significantly vary across countries, and therefore the assumption that the control group and the treatment group followed common trends before COVID-19 pandemic may not be strictly satisfied. We therefore follow a second methodology where we test how the ESG indices withstood the COVID-19 shock using the Market Model (for detailed discussion on Market models, see MacKinlay (1997)). The pandemic provided a time-test for the ESG indices on their resilience to adverse shocks. To test this, in this sub-section, we estimate the cumulative returns in ESG price indices with respect to the returns in broad indices. Precisely, we regress the monthly returns in MSCI ESG leaders’ price indices on the monthly returns of MSCI broad market indices between September 2010 and December 2019. We use a panel data of monthly returns of both ESG leaders’ and the broad indices, for all the 18 countries. Our regression controls for the country fixed-effects and the year specific unobserved shocks through dummy variables. To account for country-heterogeneity, we also include interactions between the monthly returns in MSCI broad market index and the country-specific dummy variables. The estimation results are presented in Table 3 in the Annex. The estimated model takes the following form: 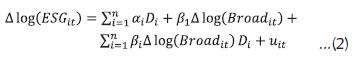 where ESGit and Broadit are the MSCI ESG leaders’ indices and the MSCI broad indices for country i in month t. Di represents the dummy variable for the ith country, n is the number ofcountries, and uit represent the error term of the regression. Hausman specification test following Hausman (1978) fails to reject the fact that the consistent estimators from random effect model is not systematically different from a fixed effect estimator provided by model (1) above. In our estimates, we use data up to December 2019, which is the last month before the outbreak of COVID-19 pandemic globally. Using the model estimates, and the observed valued of MSCI broad indices, we obtain the fitted values of the monthly returns in MSCI ESG leaders’ indices for each country between January and October, 2020. Using the fitted values, we construct the predicted ESG leaders’ index. The Cumulative Average Return (CAR) is the percentage difference between the values for observed/actual ESG leaders’ index and the predicted ESG leaders’ index. Our estimates suggest that the CAR by India’s ESG leaders was more than 4 percentage points higher than what is predicted by the market model (Chart 9). This figure stands next only to China, Hong Kong and UK. This suggests, in the aftermath of the initial COVID-19 shock, the ESG leaders have significantly outperformed the rest of the market in several economies, and India is among the top performing countries on the basis of this criterion. ESG disclosures require companies to go extra miles, beyond their traditional assessment of financial risks. This requires disclosing additional information on risks to the companies, and how the companies are managing them. However, empirical evidences, both from difference-in-difference and ‘market model’ suggest that despite disclosing additional risks to the investors, the gains to the ESG leaders for a large number of countries (Chart 9) are significant. In fact, the cross-country evidences suggest that undertaking ESG considerations and its proper disclosure may indeed be associated with better financial performances and reduced information asymmetries. 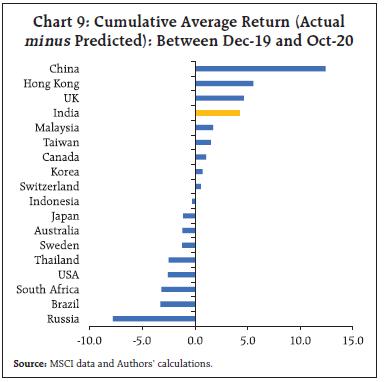 Public authorities around the world are placing increasing emphasis on ESG risks, indicating their importance in ensuring long-term economic growth. Incorporating these principles into investment practices and policy is the best way to make this practice more enduring. Several major economies, including India, have already made sustainability disclosures for publicly traded companies a requirement, and developed ESG ratings for both the companies and the broader market. In this study, we find empirical evidence across countries indicating that ESG disclosures are associated with better stock returns and reduced volatility in stock prices. Using COVID-19 as an unanticipated shock, our findings from difference-and-difference research design indicate that ESG leaders’ index outperformed the broad index for a sample of 18 countries. Market model, as an alternative specification, also supports the superior performance of the ESG indices during an unanticipated shock for most countries. The market model framework gives a ranking of the countries in terms of the ESG indices performances, and India ranks high among the sample countries. These findings broadly underline the fact that ESG disclosures may be associated with improved corporate outlook both in the short and long-run. There could be a large number of policy implications from these findings. Availability of data is the most critical challenge for computing ESG metrics and impact assessments. Public policy could play an important role in streamlining and standardising ESG reporting for corporations. In the years to come, green bonds and green finances are going to play an important role in resources allocation. Evidence of higher yields (or even lower green premium) for these bonds could be due to lack of data, information, and liquidity. It is possible to reduce this gap by developing a credible ESG database, rating, and communication mechanism. If such database is implemented properly, a credible ESG performer may find the cost of raising capital from the bond market at a lower rate than a less credible ESG performer. Therefore, ESG disclosures may be gradually streamlined across all industrial, service activities and in the large informal sector in emerging markets. In the EMEs, including India, banks play a major role in reducing asymmetric information and in financial intermediation. In the post-COVID era, ESG related risks could be integrated with the banks’ risk management framework, and authentic disclosure is the prerequisite for the same. As authentic data disclosure would play a major role in standardisation, interoperability and analysis, effective oversight of the board of directors and senior management on ESG risks could play an important role in establishing credibility. Such disclosures would eventually culminate into databases that will enable effective monitoring, stress testing and forward-looking analysis. We took an early shot to analyse the available data, found empirical evidence of resilience of ESG leaders, and noted policy suggestion that would facilitate data driven and state contingent decision making. References: BIS (2021), “Sustainable finance data for central banks”, Irving Fisher Committee (IFC) on Central Bank Statistics, Report No. 14, December. Bouye, E., Klingebiel, D., Ruiz, M. (2021), “Environmental, Social, and Governance Investing: A Primer for Central Banks’ Reserve Managers”, World Bank, Washington, DC. © World Bank Cai, Y., Pan, C.H., Statman, M., 2016. Why do countries matter so much in corporate social performance? J. Corp. Finan. 41, 591–609. Chava, S., 2014. Environmental externalities and cost of capital. Manag. Sci. 60 (9), 2223–2247. Dai, R., Liang, H., Ng, L., 2020. Socially responsible corporate customers. J. Finan. Econ. forthcoming. In press. Gillan, S. L., Koch, A. and Starks, L. T., (2021), “Firms and social responsibility: A review of ESG and CSR research in corporate finance”, Journal of Corporate Finance 66, 101889 Hausman, J. A. (1978), “Specification Tests in Econometrics”, Econometrica. 46 (6):, November, 1251–1271. Heinkel, R., Kraus, A., Zechner, J., 2001. The effect of green investment on corporate behavior. J. Financ. Quant. Anal. 36 (4), 431–449 Liang, H., Renneboog, L., 2017a. Corporate donations and shareholder value. Oxf. Rev. Econ. Policy 33 (2), 278–316. Liang, H., Renneboog, L., 2017b. On the foundations of corporate social responsibility. J. Financ. 72 (2), 853–910. MacKinlay, A. C. (1997), “Event Studies in Economics and Finance”, Journal of Economic Literature, 35(1), 13–39. MSCI (2022), “ESG Ratings Methodology”, April. Ng, A.C., Rezaee, Z., 2015. Business sustainability performance and cost of equity capital. J. Corp. Finan. 34, 128–149. Schiller, C., 2018. Global Supply-Chain Networks and Corporate Social Responsibility. Unpublished working paper ^ The authors are from the Department of Economic and Policy Research. * Views expressed in this article are solely of the authors’ and do not represent the views of the Reserve Bank of India. 1 See Gillan et. al., (2021) for a comprehensive review of literature. 2 For example, how water shortages in the near-future can pose threat to a mining company is captured by the ESG ratings, but it is not captured by the conventional financial indicators, or the stock prices. 3 ESG disclosures have been made compulsory for large manufacturing companies for major economics including EU, China, and India. In addition to their disclosures into their annual report/director’s reports, MSCI gathers information on the company’s exposures to risks from several independent sources such as news articles, reports on disputes, other business/academia reports etc. while building the ESG ratings. This is expected to minimise the chances of biases that may arise due to ‘moral hazard’ etc. 4 The market capitalisation, or the ESG Gross index measure the overall size of the market, i.e., each outstanding share being multiplied by their respective market prices for each period, and then aggregated across all the shares. ESG leaders’ price indices are the company-level market capitalisation weighted aggregate price indices for ESG leaders. The ESG market capitalization and ESG price indices represent the market capitalisation and price indices for the set of industries that are leaders in ESG considerations. 5 2010 is the year since when we could obtain ESG indices for all the countries in our sample. MSCI reported ESG indices only some of these countries prior to 2010. Hence, for better comparability, we have used 2010 as the starting point for all the countries. |

ഈ പേജ് ഷെയർ ചെയ്യുക:


റിസർവ് ബാങ്ക് ഓഫ് ഇന്ത്യ മൊബൈൽ ആപ്ലിക്കേഷൻ ഇൻസ്റ്റാൾ ചെയ്ത് ഏറ്റവും പുതിയ വാർത്തകളിലേക്ക് വേഗത്തിലുള്ള ആക്സസ് നേടുക!
ഞങ്ങളുടെ ആപ്പ് ഇൻസ്റ്റാൾ ചെയ്യാൻ QR കോഡ് സ്കാൻ ചെയ്യുക


പേജ് അവസാനം അപ്ഡേറ്റ് ചെയ്തത്:


