| Provisional data on India’s merchandise trade for April 2008-January 2009 and commodity-wise details for April-November 2008 have been recently released by the Directorate General of Commercial Intelligence and Statistics (DGCI&S). This article reviews India’s merchandise trade on the basis of these data. Highlights
-
India’s merchandise exports during January 2009 at US$ 12.4 billion recorded a decline of 15.9 per cent as against a growth of 34.9 per cent registered in January 2008. With exports recording a steady decline since October 2008, the overall exports during April 2008-January 2009 at US$ 143.0 billion showed a lower growth of 12.4 per cent than 24.1 per cent a year ago, due to sharp deceleration in the export of textiles and textile products, gems and jewellery, leather products and agriculture and allied products and iron ore and minerals.
-
Imports during January 2009 at US$ 18.5 billion also declined by 18.2 per cent for the first time during the current year 2008-09 so far, as against an increase of 64.0 per cent in January 2008, mainly due to sharp decline in oil imports. The overall imports during April 2008-January 2009 at US$ 241.5 billion, showed a growth of 24.4 per cent lower than that registered during the comparable period of previous year (31.0 per cent) on account of deceleration in both oil and non-oil imports.
* Prepared in the Division of International Trade, Department of Economic Analysis and Policy. The previous issue of the article was published in RBI Bulletin, March 2009.
-
Petroleum, oil and lubricants (POL) imports during April 2008-January 2009 at US$ 82.1 billion, maintained a growth of 30.6 per cent (32.0 per cent in April 2007-January 2008). However, the average price of Indian basket of crude oil during April 2008-January 2009 remained higher at US$ 90.8 per barrel than US$ 76.0 per barrel during April 2007-January 2008 due to the impact of higher international crude oil prices that prevailed during April-August 2008.
-
Non-oil imports during April 2008-January 2009 at US$ 159.4 billion decelerated to 21.5 per cent from 30.4 per cent a year ago, mainly due to decline in the imports of gold and silver, electronic goods and deceleration in transport equipments.
-
Trade deficit during April 2008-January 2009 widened to US$ 98.5 billion, an increase of US$ 31.7 billion (47.4 per cent) over the trade deficit of US$ 66.8billion during April 2007-January 2008.
India’s Merchandise Trade during 2008-09 (April 2008-January 2009) Exports India’s merchandise exports, after recording a steady growth of 35.3 per cent during April-August 2008, declined in all the subsequent months so far, during the current year, viz., (-12.1 per cent in October ), (-9.9 per cent in November), (-1.1 per cent in December) and (-15.9 per cent in January 2009) on account of global financial turmoil and economic slowdown ( Chart 1 ). With the result, the overall exports during April 2008-January 2009 at US$143 billion increased by 12.4 per cent as compared with 24.1 per cent during the corresponding period of the previous year (Table 1). Exports of labour intensive sectors such as, textiles, gems and jewellery, agricultural and allied products, ores and minerals, leather products have registered decelerated growth as these sectors have been adversely affected under the impact of demand recession, mainly in the developed regions, viz., the US and the EU.
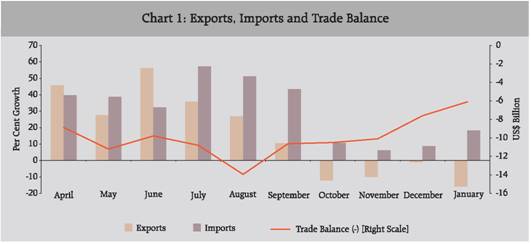
Table 1 : India’s Merchandise Trade: April 2008-January 2009 |
(US $ billion) |
Items |
2007-08 R |
2008-09 P |
1 |
2 |
3 |
Exports |
|
127.3 |
|
143.0 |
| |
|
(24.1) |
|
(12.4) |
Oil Exports |
21.9 |
|
21.6* |
|
| |
(39.1) |
|
(25.3) * |
|
Non-Oil Exports |
105.4 |
|
96.7* |
|
| |
(21.3) |
|
(16.0) * |
|
Imports |
|
194.1 |
|
241.5 |
| |
|
(30.9) |
|
(24.4) |
Oil Imports |
62.9 |
|
82.1 |
|
| |
(31.9) |
|
(30.6) |
|
Non-Oil Imports |
131.2 |
|
159.4 |
|
| |
(30.4) |
|
(21.5) |
|
Trade Balance |
|
-66.8 |
|
-98.5 |
Oil Trade Balance |
-40.9 |
|
-54.0* |
|
Non-Oil Trade Balance |
-25.9 |
|
-36.4* |
|
* : Figures pertain to April-November. R : Revised. P : Provisional.
Note : Figures in parentheses show percentage change over the corresponding period of the previous year.
Source : Compiled from DGCI&S data. |
The detailed commodity-wise exports data released by DGCI&S for the period April-November 2008 revealed that engineering goods and petroleum products maintained the largest share in exports, while ores and minerals, leather and manufactures, textile and textiles products and gems and jewellery reduced their shares (Table 2). Sector-wise, manufactured goods continued to maintain largest share at 64.7 per cent, followed by petroleum products (18.3 per cent) and primary products (14.9 per cent). Export of primary products during April-November 2008 at US$ 17.6 billion decelerated to 16.1 per cent from 31.8 per cent during the corresponding period of the previous year. Within primary products both agricultural and allied products (from 35.5 per cent to 23.4 per cent ) and ores and minerals (from 24.8 per cent to 1.2 per cent) sharply decelerated in growth. Among agricultural and allied products, while tea, coffee, oil meal, tobacco, and cashew maintained the growth momentum, exports of rice, spices, sugar and molasses and marine products continued to show deceleration /decline.
Table 2: India’s Exports of Principal Commodities |
(Percentage Shares) |
Commodity |
2006-07 |
2007-08 |
2007-08 |
2008-09 |
April-March |
April-November |
1 |
2 |
3 |
4 |
5 |
I. Primary products |
15.6 |
16.9 |
15.1 |
14.9 |
Agriculture and allied products |
10.0 |
11.3 |
10.1 |
10.6 |
Ores and minerals |
5.5 |
5.6 |
5.0 |
4.3 |
II. Manufactured goods |
67.2 |
63.2 |
65.1 |
64.7 |
Leather and manufactures |
2.4 |
2.2 |
2.3 |
2.1 |
Chemicals and Related products |
13.7 |
13.0 |
13.1 |
13.2 |
Engineering goods |
23.4 |
22.9 |
22.9 |
25.9 |
Textile and textile products |
13.7 |
11.9 |
12.4 |
10.9 |
Gems and jewellery |
12.6 |
12.1 |
13.2 |
11.6 |
III.Petroleum products |
14.8 |
17.4 |
17.1 |
18.3 |
IV. Others |
2.4 |
2.5 |
2.7 |
2.2 |
Total Exports |
100.0 |
100.0 |
100.0 |
100.0 |
Source : Compiled from DGCI&S data. |
Exports of manufactured goods during April-November 2008 at US$ 76.5 billion recorded a decelerated growth of 16.9 per cent than 20.5 per cent a year ago. Within manufactured products, barring engineering goods, other major items, viz., chemicals and related products exhibited higher growth, while textiles and textile products, leather and manufactures and gems and jewellery witnessed deceleration. Engineering goods exports during April-November 2008 at US$ 30.5 billion, which constituted more than one-fourth of total exports of India, registered 32.6 per cent growth, on top of 23.8 per cent growth reached a year ago, largely contributed by transport equipments, iron and steel and electronic goods. Exports of transport equipments to the major markets, such as Singapore, the US and the UK increased substantially on the back of strong export performance, particularly during the period April-September 2008.
Chemicals and related products exports during April- November 2008 at US$ 15.6 billion maintained almost a similar growth (18.5 per cent) as last year, with basic chemicals, pharmaceuticals contributing the major share, while exports of rubber, glass and paints showed deceleration.
Exports of textiles and textile products during April-November 2008 at US$ 12.9 billion sharply decelerated to 3.6 per cent (11.4 per cent a year ago). All major components including the readymade garments, which accounted for about 50 per cent share in textiles and textile products exports, showed deceleration in export growth.
Gems and jewellery exports at US$ 13.7 billion recorded a sharp deceleration to 3.0 per cent during April-November 2008 from 28.0 per cent a year ago, reflecting the recessionary conditions in the major export destinations for India’s gems and jewellery, viz., Hong Kong, the US and the UAE. In order to mitigate the difficulties faced by the diamond industry a Task Force was appointed recently (box).
Petroleum products at US$ 21.6 billion, which constituted the second largest components of India’s total exports, witnessed decelerated growth of 25.3 per cent during April- November 2008 as compared with 34.4 per cent a year ago. Destination-wise, during April-November 2008, developing countries constituted 39.9 per cent of India’s exports, followed by OECD countries (38.2 per cent) and OPEC (20.0 per cent). The US with a share of 11.9 per cent was the single largest importer of India’s exports, even while its share has declined over the previous year (13.6 per cent) [Table 3]. The other major market for India’s exports were the UAE (11.2 per cent), Singapore (5.1 per cent), China (4.4 per cent) and Hong Kong (3.8 per cent). Imports India’s merchandise imports witnessed a growth of 44.9 per cent during April-September 2008, and thereafter it showed a deceleration, reflecting the slowdown in industrial activities due to global economic crisis. The overall imports during April 2008-January 2009 at US$ 241.5 billion, recorded a lower growth of 24.4 per cent than 30.9 per cent recorded a year ago. POL imports during April 2008-January 2009 at US$ 82.1 billion, however, maintained broadly a similar growth of 30.6 per cent (31.9 per cent a year ago) reflecting the high pace of crude oil prices
Box: Report of the Task Force for Diamond Sector
Pursuant to the deliberations in the meeting held by the Governor of Reserve Bank with the Honourable Minister of Finance, Government of Gujarat and senior officials of Government and banks on February 11, 2009, a Task Force was constituted, comprising representatives of the State Government, the State Level Bankers Committee Convener, other banks and Small Industries Development Bank of India to look into the distress arising on account of problems faced by diamond industry in Gujarat and to make practicable recommendations for mitigating the difficulties.
The ‘Terms of Reference of the Task Force’ comprised of (a) to study the coverage of existing banking facilities for financial restructuring of borrowal accounts of registered diamond sector units and, to work out a suitable package to give credit support to new enterprises which can provide employment opportunities to the unemployed workers; (b) to examine the possibility of rehabilitation, re-training and re-skilling, with support from Government set-up, for gainful employment of unemployed diamond industry workers ; and (c) to consider provision of some relief to the unemployed workers by way of personal / consumption loans from the banking system within the existing norms, for mitigating their hardships.
The major recommendations of the Task Force are as set out below:
1. Expeditious restructuring of the existing borrowal accounts as per RBI guidelines
-
There is a need to disseminate the information to all borrowers across the industry so that maximum benefits can be availed of by all borrowers. As a first step in this direction, Reserve Bank, Ahmedabad Office requested the Government of Gujarat, to organize workshops, seminars etc, in association with bankers, to create awareness among borrowers / trade associations on the relaxations made available in the policy guidelines issued by the RBI for suitable restructuring of borrowal accounts.
-
The diamond traders requested the banks to lend against stocks of polished diamonds held in their inventory, to enable them to tide over the liquidity crisis, subject to appropriate valuation by an accredited valuer. Banks will examine this for enhancing the liquidity support to the industry.
-
The Task Force recommended the diamond traders’ request for interest rate subvention on export credit to be 4 per cent, instead of the current 2 per cent.
-
Banks to consider any proposal for credit support to new diamond sector enterprises which has potential to generate employment opportunities for the displaced workers, as per guidelines.
-
Banks may explore the possibility of financing procurement of rough diamonds, from reputed agencies, for cutting and polishing, on a labour- intensive scale, to maximize employment of workers.
2. Retraining, re-skilling and rehabilitation of displaced diamond sector workers
-
To take care of alternative employment opportunities of displaced diamond sector workers, the Task Force has suggested suitable training programmes be designed for them at the local district level. Necessary financial support for organizing the training will have to be provided by the Government.
-
District Authorities may quickly identify and sponsor all eligible workers for appropriate financial assistance / loans under various Government schemes, for alternative work, wherever necessary, with suitable relaxation in norms, as a one-time dispensation.
3. Financial relief measures for diamond workers
-
With a view to helping the diamond sector workers to tide over the distress caused to them on account of loss of jobs / work, soft loans with elongated repayment cycle, will have to be considered, based on their identification by their employers. The diamond sector units will need to sponsor such workers to the banking system.
-
Banks may consider rescheduling of existing housing, educational and personal loans of diamond workers on a case to case basis.
-
An education fund will have to be constituted at the initiative of District administration, with contributions from diamond industry, local industry associations and philanthropists, to help payment of school fees of children of displaced diamond sector workers.
-
A Group Savings-cum-Insurance Plan may have to be created with premium contribution from all stakeholders, to tide over any financial difficulties for the workers.
-
Issue of General Credit Cards (GCC) with small monetary limits may be considered by banks for the workers engaged in the sector, with relaxation in norms.
Source: Report of the Task Force for Diamond Sector, RBI, available at www.rbi.org.in
Table 3 : India’s Exports to Principal Regions |
(Percentage Shares) |
Region |
2006-07 |
2007-08 |
2007-08 |
2008-09 |
| |
April-March |
April-November |
1 |
2 |
3 |
4 |
5 |
I. OECD countries |
41.2 |
38.5 |
40.7 |
38.2 |
EU |
20.4 |
20.2 |
21.7 |
21.5 |
North America |
15.8 |
13.5 |
14.4 |
12.6 |
U.S. |
14.9 |
12.7 |
13.6 |
11.9 |
Asia and Oceania |
3.4 |
3.2 |
3.0 |
2.6 |
Other OECD countries |
1.6 |
1.6 |
1.6 |
1.5 |
II. OPEC |
16.4 |
16.4 |
17.1 |
20.0 |
III. Eastern Europe |
2.0 |
2.1 |
1.1 |
1.2 |
IV. Developing countries |
40.2 |
42.7 |
40.7 |
39.9 |
Asia |
29.8 |
31.6 |
29.8 |
29.0 |
SAARC |
5.1 |
5.9 |
5.3 |
5.1 |
Other Asian developing countries |
24.6 |
25.7 |
24.6 |
23.9 |
Africa |
7.0 |
7.7 |
7.7 |
7.1 |
Latin American countries |
3.4 |
3.4 |
3.2 |
3.8 |
V. Others / unspecified |
0.3 |
0.4 |
0.3 |
0.7 |
Total Exports |
100.0 |
100.0 |
100.0 |
100.0 |
Source : Compiled from DGCI&S data. |
which prevailed during the first half of the current fiscal year. The average price of Indian basket of crude oil during April 2008- January 2009 was at US$ 90.8 per barrel (ranged between US$ 41.2 – 132.2 per barrel) was higher by 19.5 per cent than US$ 76.0 per barrel (ranged between US$ 65.2 – 89.0 per barrel) during April 2007-January 2008 (Table 4). Non-oil imports during April 2008-January 2009 decelerated to 21.5 per cent from 30.4 per cent a year ago.
Commodity-wise imports data for the period April- November 2008 indicated 58.8 per cent growth in POL imports (20.8 per cent a year ago) under the impact of high crude oil prices, while the quantity of POL imports showed a decline. During April -November 2008, POL imports in terms of volume, declined by 10.2 per cent as against an increase of 20.0 per cent during the similar period of the previous year. Non-POL imports witnessed moderation in growth (from 32.2 per cent to 25.6 per cent), mainly due to deceleration in the imports of capital goods and the decline of gold and silver and electronic goods (Statement 5). In terms of percentage share, POL increased to 36.2 per cent from 31.0 per cent, while the share of capital goods, gold and silver showed decline (Table 5).
| Table 4 : Trends in Crude Oil Prices |
| (US $/barrel) |
Year |
Dubai |
Brent |
WTI* |
Indian Basket** |
1 |
2 |
3 |
4 |
5 |
2000-01 |
25.9 |
28.1 |
30.3 |
26.8 |
2001-02 |
21.8 |
23.2 |
24.1 |
22.4 |
2002-03 |
25.9 |
27.6 |
29.2 |
26.6 |
2003-04 |
26.9 |
29.0 |
31.4 |
27.8 |
2004-05 |
36.4 |
42.2 |
45.0 |
39.2 |
2005-06 |
53.4 |
58.0 |
59.9 |
55.7 |
2006-07 |
60.9 |
64.4 |
64.7 |
62.4 |
2007-08 |
77.3 |
82.4 |
82.3 |
79.5 |
April-January 2007 |
74.1 |
79.0 |
78.6 |
76.0 |
April-January 2008 |
89.6 |
92.7 |
94.2 |
90.8 |
January 2007 |
85.8 |
91.5 |
91.4 |
89.5 |
January 2008 |
44.9 |
44.9 |
41.7 |
43.9 |
* : West Texas Intermediate.
** : The composition of Indian basket of crude represents average of Oman and Dubai for sour grades and Brent (dated) for sweet grade in the ratio of 62.3:37.7 for 2008-09.
Sources: International Monetary Fund, International Financial Statistics, World Bank’s Commodity |
Source-wise, during April-November 2008, OPEC had the highest share in India’s imports ( 35.6 per cent), followed by developing countries (31.4 per cent) and OECD countries (30.2 per cent) [Table 6]. China was the single largest source of imports, with a share of 10.0 per cent in total imports, followed by Saudi Arabia (7.7 per cent), the UAE (6.5 per cent), the US (5.9 per cent), Iran (4.6 per cent) and Switzerland (4.2 per cent).
Table 5 : Imports of Principal Commodities |
(Percentage Shares) |
Commodity |
2006-07 |
2007-08 |
2007-08 |
2008-09 |
(April- March) |
(April-November) |
1 |
2 |
3 |
4 |
5 |
1. Petroleum, crude and products |
30.8 |
31.7 |
31.0 |
36.2 |
2. Capital goods |
25.3 |
28.2 |
23.8 |
19.5 |
3. Gold and silver |
7.9 |
7.1 |
8.9 |
6.2 |
4. Organic and inorganic chemicals |
4.2 |
3.9 |
4.3 |
4.5 |
5. Coal, coke and briquettes, etc. |
2.5 |
2.6 |
2.6 |
3.6 |
6. Fertilizers |
1.7 |
2.2 |
2.3 |
5.4 |
7. Metalliferrous ores, metal scrap, etc. |
4.5 |
3.1 |
3.4 |
2.8 |
8. Iron and steel |
3.5 |
3.5 |
3.8 |
3.3 |
| 9. Pearls, precious and semi precious stone |
4.0 |
3.2 |
4.0 |
5.1 |
10. Others |
19.6 |
18.7 |
21.3 |
18.4 |
Total Imports |
100.0 |
100.0 |
100.0 |
100.0 |
Source: Compiled from DGCI&S. |
Trade Deficit
The overall trade deficit during April 2008-January 2009 amounted to US$ 98.5 billion, showing an increase of US$ 31.7 billion (47.4 per cent) over the trade deficit of US$ 66.8 billion during April 2007-January 2008. Trade deficit on oil account during April- November 2008 at US$ 54.0 billion, was higher by US$ 23.6 billion (77.8 per cent) than US$ 30.4 billion a year ago. Trade deficit on non-oil account during this period amounted to US$ 36.4 billion, higher by US$ 13.8 billion (61.4 per cent) than US$ 22.5 billion a year back.
Table 6 : Shares of Groups/Countries in India’s Imports |
(Percentage Shares) |
Group/Country |
2006-07 |
2007-08 |
2007-08 |
2008-09 |
April-March |
April-November |
1 |
2 |
3 |
4 |
5 |
I. O E C D Countries |
34.5 |
34.8 |
33.8 |
30.2 |
E U |
15.3 |
14.6 |
14.7 |
12.7 |
France |
2.3 |
2.5 |
1.1 |
0.9 |
Germany |
4.1 |
3.9 |
3.9 |
3.4 |
U K |
2.2 |
2.0 |
2.2 |
1.9 |
North America |
7.3 |
9.1 |
6.8 |
6.6 |
U S A |
6.3 |
8.4 |
5.9 |
5.9 |
Asia and Oceania |
6.4 |
5.8 |
6.5 |
5.8 |
Other O E C D Countries |
5.5 |
5.2 |
5.9 |
5.1 |
II. O P E C |
30.2 |
30.3 |
30.6 |
35.6 |
III. Eastern Europe |
2.7 |
2.1 |
1.7 |
2.3 |
IV. Developing Countries |
32.2 |
32.1 |
33.6 |
31.4 |
Asia |
25.5 |
25.5 |
27.2 |
25.3 |
S A A R C |
0.8 |
0.8 |
0.8 |
0.6 |
Other Asian |
|
|
|
|
Developing Countries |
24.7 |
24.7 |
26.4 |
24.7 |
Of which: |
|
|
|
|
People’s Rep of China |
9.4 |
10.8 |
11.6 |
10.0 |
Africa |
3.7 |
4.1 |
4.0 |
4.3 |
Latin American Countries |
3.0 |
2.4 |
2.3 |
1.8 |
Total Imports |
100.0 |
100.0 |
100.0 |
100.0 |
Source: Compiled from DGCI&S data. |
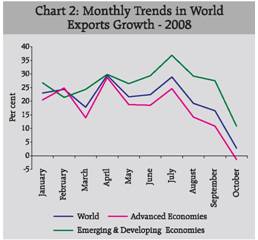
Global Trade According to the WTO’s latest report, the global trade in volume terms, will decline by as much as 9 per cent during 2009, the biggest ever contraction since the Second World War, as against the growth of 2 per cent in 2008 and 6 per cent in 2007. The developed economies exports are expected to fall by 10 per cent, on average, and the developing countries exports shrinking by 2-3 per cent in 2009. According to the IMF’s International Financial Statistics (IFS), world merchandise exports, in dollar terms, which grew on an average 22.6 per cent during January-September, decelerated to 2.7 per cent in October 2008. Exports from emerging and developing economies grew by 10.8 per cent, while that from advanced economies recorded a decline (-1.4 per cent) during October 2008 (Chart 2 ). The overall export during January-October 2008 still recorded a higher growth of 20.3 per cent than 14.8 cent a year ago, mainly because of the higher export growth recorded in the first half of 2008 (Table 7).
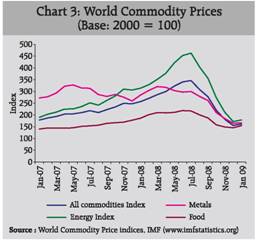
Commodity Prices The world commodity prices persisted to show downward trend. According to IFS, world commodity prices which decelerated since August 2008 declined substantially by 36.5 per cent in December 2008. The decline was seen in energy, metal and food prices. Energy prices declined by 42.7 per cent and metals prices declined by 36.4 per cent and food prices by 18.4 per cent during December 2008 (Chart 3).
Table 7 : Growth in Exports: Global Scenario |
(Per cent) |
Region/Country |
2006 |
2007 |
2007 |
2008 |
January-December |
January-November |
1 |
2 |
3 |
4 |
5 |
World |
16.1 |
14.0 |
15.3 |
16.9 |
Advanced Economies |
12.6 |
13.4 |
13.8 |
13.2 |
US |
14.5 |
12.0 |
11.9 |
14.1 |
France |
10.1 |
12.3 |
12.4 |
12.7 |
Germany |
14.7 |
18.4 |
19.2 |
12.6 |
Japan |
9.2 |
7.8 |
8.9 |
14.0 |
Emerging and Developing Economies |
22.8 |
15.1 |
17.4 @ |
26.2 @ |
Singapore |
18.4 |
10.1 |
9.8 |
16.3 |
China |
27.2 |
25.6 |
26.5 @ |
22.0 @ |
India |
21.4 |
21.5 |
21.6 |
23.0 |
Indonesia |
19.0 |
14.7 |
15.3 |
25.5 |
Korea |
14.4 |
14.1 |
14.1 |
20.1 |
Malaysia |
14.0 |
9.6 |
9.6 |
16.3 |
Thailand |
18.7 |
17.0 |
16.5 |
23.1 |
@ Relates to January - October 2008.
Sources : (1) IMF (www.imfstatistics.org).
(2) DGCI&S for India. |
Statement 1 : India’s Foreign Trade - January 2009 |
Year |
Exports |
Imports |
Trade Balance |
| |
Total |
Oil |
Non-Oil |
Total |
Oil |
Non-Oil |
Total |
Oil |
Non-Oil |
1 |
2 |
3 |
4 |
5 |
6 |
7 |
8 |
9 |
10 |
Rupees crore |
2006-07 |
48,357 |
6,334 |
42,022 |
60,992 |
16,659 |
44,333 |
-12,636 |
-10,325 |
-2,311 |
| |
(18.8) |
(14.3) |
(19.5) |
(6.5) |
(-10.0) |
(14.4) |
|
|
|
2007-08 R |
57,948 |
9,425 |
48,523 |
88,852 |
33,487 |
55,365 |
-30,904 |
-24,062 |
-6,842 |
| |
(19.8) |
(48.8) |
(15.5) |
(45.7) |
(101.0) |
(24.9) |
|
|
|
2008-09 P |
60,460 |
.. |
.. |
90,125 |
21,796 |
68,329 |
-29,665 |
|
|
| |
(4.3) |
|
|
(1.4) |
(-34.9) |
(23.4) |
|
|
|
US dollar million |
2006-07 |
10,908 |
1,429 |
9,479 |
13,758 |
3,758 |
10,000 |
-2,850 |
-2,329 |
-521 |
| |
(19.0) |
(14.4) |
(19.7) |
(6.7) |
(-9.8) |
(14.6) |
|
|
|
2007-08 R |
14,717 |
2,394 |
12,324 |
22,566 |
8,505 |
14,061 |
-7,849 |
-6,111 |
-1,738 |
| |
(34.9) |
(67.5) |
(30.0) |
(64.0) |
(126.3) |
(40.6) |
(175.4) |
|
|
2008-09 P |
12,381 |
.. |
.. |
18,455 |
4,463 |
13,992 |
-6,075 |
|
|
| |
(-15.9) |
|
|
(-18.2) |
(-47.5) |
(-0.5) |
(-22.6) |
|
|
SDR million |
2006-07 |
7,294 |
955 |
6,338 |
9,200 |
2,513 |
6,687 |
-1,906 |
-1,557 |
-349 |
| |
(15.1) |
(10.7) |
(15.8) |
(3.2) |
(-12.8) |
(10.8) |
|
|
|
2007-08 R |
9,292 |
1,511 |
7,781 |
14,247 |
5,370 |
8,878 |
-4,955 |
-3,858 |
-1,097 |
| |
(27.4) |
(58.2) |
(22.8) |
(54.9) |
(113.7) |
(32.8) |
|
|
|
2008-09 P |
8,200 |
.. |
.. |
12,223 |
2,956 |
9,267 |
-4,023 |
|
|
| |
(-11.8) |
|
|
(-14.2) |
(-44.9) |
(4.4) |
|
|
|
P : Provisional. R : Revised. .. : Not available.
Note : Figures in brackets relate to percentage variation over the corresponding previous period. Source : DGCI & S. |
Statement 2 : India’s Foreign Trade |
Year |
Exports |
Imports |
Trade Balance |
| |
Total |
Oil |
Non-Oil |
Total |
Oil |
Non-Oil |
Total |
Oil |
Non-Oil |
1 |
2 |
3 |
4 |
5 |
6 |
7 |
8 |
9 |
10 |
April-March |
Rupees crore |
2005-06 |
456,418 |
51,533 |
404,885 |
660,409 |
194,640 |
465,769 |
-203,991 |
-143,107 |
-60,884 |
| |
(21.6) |
(64.1) |
(17.7) |
(31.8) |
(45.2) |
(26.9) |
|
|
|
2006-07 R |
571,779 |
84,520 |
487,259 |
840,506 |
258,572 |
581,935 |
-268,727 |
-174,052 |
-94,675 |
| |
(253) |
(64.0) |
(20.3) |
(27.3) |
(32.8) |
(24.9) |
|
|
|
2007-08 P |
655,864 |
114,192 |
541,672 |
1,012,312 |
320,655 |
691,657 |
-356,448 |
-206,463 |
-149,985 |
| |
(14.7) |
(35.1) |
(11.2) |
(20.4) |
(24.0) |
(18.9) |
|
|
|
US dollar million |
2005-06 |
103,091 |
11,640 |
91,451 |
149,166 |
43,963 |
105,203 |
-46,075 |
-32,323 |
-13,752 |
| |
(23.4) |
(66.5) |
(19.5) |
(33.8) |
(47.3) |
(28.8) |
|
|
|
2006-07 R |
126,361 |
18,679 |
107,683 |
185,749 |
57,144 |
128,606 |
-59,388 |
-38,465 |
-20,923 |
| |
(22.6) |
(60.5) |
(17.7) |
(24.5) |
(30.0) |
(22.2) |
|
|
|
2007-08 P |
162,904 |
28,363 |
134,541 |
251,439 |
79,645 |
171,795 |
-88,535 |
-51,281 |
-37,254 |
| |
(28.9) |
(51.8) |
(24.9) |
(35.4) |
(39.4) |
(33.6) |
|
|
|
SDR million |
2005-06 |
70,774 |
7,991 |
62,783 |
102,405 |
30,182 |
72,224 |
-31,632 |
-22,191 |
-9,441 |
| |
(26.2) |
(70.3) |
(22.2) |
(36.8) |
(50.6) |
(31.7) |
|
|
|
2006-07 R |
85,018 |
12,567 |
72,451 |
124,975 |
38,447 |
86,528 |
-39,957 |
-25,880 |
-14,077 |
| |
(20.1) |
(57.3) |
(15.4) |
(22.0) |
(27.4) |
(19.8) |
|
|
|
2007-08 P |
104,686 |
18,227 |
86,459 |
161,581 |
51,181 |
110,399 |
-56,895 |
-32,955 |
-23,940 |
| |
(23.1) |
(45.0) |
(19.3) |
(29.3) |
(33.1) |
(27.6) |
|
|
|
April-January |
Rupees crore |
2006-07 |
466,580 |
71,663 |
394,918 |
674,516 |
216,749 |
457,766 |
-207,935 |
-145,087 |
-62,849 |
| |
(27.9) |
(71.3) |
(22.3) |
(25.0) |
(-86.3) |
(-144.1) |
|
|
|
2007-08 R |
512,945 |
88,344 |
424,601 |
782,297 |
253,385 |
528,912 |
-269,352 |
-165,040 |
-104,312 |
| |
(9.9) |
(23.3) |
(7.5) |
(16.0) |
(16.9) |
(15.5) |
|
|
|
2008-09 P |
645,572 |
.. |
.. |
1,090,182 |
370,664 |
719,518 |
-444,610 |
|
|
| |
(25.9) |
|
|
(39.4) |
(46.3) |
(36.0) |
|
|
|
US dollar million |
2006-07 |
102,588 |
15,757 |
86,831 |
148,307 |
47,657 |
100,650 |
-45,719 |
-31,901 |
-13,819 |
| |
(24.4) |
(66.7) |
(19.0) |
(21.6) |
(-86.6) |
(-142.9) |
|
|
|
2007-08 R |
127,269 |
21,920 |
105,350 |
194,099 |
62,868 |
131,231 |
-66,830 |
-40,949 |
-25,881 |
| |
(24.1) |
(39.1) |
(21.3) |
(30.9) |
(31.9) |
(30.4) |
(46.2) |
|
|
2008-09 P |
143,006 |
21600* |
96659* |
241,495 |
82,109 |
159,387 |
-98,489 |
|
|
| |
(12.4) |
(25.3) |
(16.0) |
(24.4) |
(30.6) |
(21.5) |
(47.4) |
|
|
SDR million |
2006-07 |
69,167 |
10,623 |
58,544 |
99,992 |
32,131 |
67,860 |
-30,825 |
-21,508 |
-9,317 |
| |
(22.5) |
(64.2) |
(17.1) |
(19.7) |
(-86.8) |
(-142.3) |
|
|
|
2007-08 R |
82,348 |
14,183 |
68,166 |
125,590 |
40,678 |
84,912 |
-43,242 |
-26,496 |
-16,746 |
| |
(19.1) |
(33.5) |
(16.4) |
(25.6) |
(26.6) |
(25.1) |
|
|
|
2008-09 P |
91,422 |
.. |
.. |
154,385 |
52,491 |
101,894 |
-62,963 |
|
|
| |
(11.0) |
|
|
(22.9) |
(29.0) |
(20.0) |
|
|
|
P : Provisional. R : Revised. .. : Not available. * : Figures pertain to the month of April-November.
Note : 1. Figures in brackets relate to percentage variation over the corresponding period of the previous year.
2. Data conversion has been done using period average exchange rates.
Source : DGCI & S. |
Statement 3 : India’s Exports of Principal Commodities |
(US$ million) |
Commodity/Group |
April-November |
Percentage |
Variation |
2006-07 |
2007-08 |
2008-09 P |
(3)/(2) |
(4)/(3) |
1 |
2 |
3 |
4 |
5 |
6 |
I. |
Primary Products |
11,521.3 |
15,184.7 |
17,630.5 |
31.8 |
16.1 |
| |
14.3 |
15.1 |
14.9 |
|
|
| |
A. |
Agricultural & Allied Products |
7,518.1 |
10,186.8 |
12,575.1 |
35.5 |
23.4 |
| |
|
of which : |
9.3 |
10.1 |
10.6 |
8.8 |
5.0 |
| |
|
1. |
Tea |
320.5 |
330.2 |
411.6 |
3.0 |
24.7 |
| |
|
2. |
Coffee |
289.6 |
271.9 |
355.9 |
-6.1 |
30.9 |
| |
|
3. |
Rice |
976.9 |
1,613.1 |
1,655.2 |
65.1 |
2.6 |
| |
|
4. |
Wheat |
7.4 |
0.1 |
0.1 |
–99.3 |
83.2 |
| |
|
5. |
Cotton Raw incl. Waste |
493.2 |
627.5 |
452.0 |
27.2 |
-28.0 |
| |
|
6. |
Tobacco |
242.5 |
321.8 |
496.1 |
32.7 |
54.2 |
| |
|
7. |
Cashew incl. CNSL |
366.7 |
352.0 |
477.9 |
-4.0 |
35.7 |
| |
|
8. |
Spices |
428.4 |
858.2 |
968.1 |
100.3 |
12.8 |
| |
|
9. |
Oil Meal |
561.2 |
793.5 |
1,535.0 |
41.4 |
93.5 |
| |
|
10. |
Marine Products |
1,116.3 |
1,273.3 |
1,121.5 |
14.1 |
-11.9 |
| |
|
11. |
Sugar & Mollases |
540.2 |
792.9 |
970.5 |
46.8 |
22.4 |
| |
B. |
Ores & Minerals |
4,003.1 |
4,997.9 |
5,055.5 |
24.8 |
1.2 |
| |
|
of which : |
5.0 |
5.0 |
4.3 |
|
|
| |
|
1. |
Iron Ore |
2,185.2 |
2,844.5 |
2,714.5 |
30.2 |
-4.6 |
| |
|
2. |
Processed Minerals |
848.9 |
817.9 |
1,013.2 |
-3.6 |
23.9 |
II. |
Manufactured Goods |
54,299.9 |
65,447.9 |
76,476.4 |
20.5 |
16.9 |
| |
of which : |
67.2 |
65.1 |
64.7 |
|
|
| |
A. |
Leather & Manufactures |
1,953.4 |
2,273.4 |
2,469.4 |
16.4 |
8.6 |
| |
B. |
Chemicals & Related Products |
11,116.7 |
13,132.5 |
15,557.7 |
18.1 |
18.5 |
| |
|
1. |
Basic Chemicals, Pharmaceuticals & Cosmetics |
6,940.5 |
8,548.2 |
10,455.9 |
23.2 |
22.3 |
| |
|
2. |
Plastic & Linoleum |
2,161.6 |
2,144.1 |
2,217.0 |
-0.8 |
3.4 |
| |
|
3. |
Rubber, Glass, Paints & Enamels etc., |
1,545.7 |
1,862.2 |
2,075.6 |
20.5 |
11.5 |
| |
|
4. |
Residual Chemicals & Allied Products |
468.9 |
578.0 |
809.2 |
23.3 |
40.0 |
| |
C. |
Engineering Goods |
18,638.3 |
23,066.5 |
30,582.7 |
23.8 |
32.6 |
| |
|
of which : |
|
|
|
|
|
| |
|
1. |
Manufactures of metals |
3,229.1 |
4,293.7 |
5,187.4 |
33.0 |
20.8 |
| |
|
2. |
Machinery & Instruments |
4,317.9 |
5,615.7 |
7,045.2 |
30.1 |
25.5 |
| |
|
3. |
Transport equipments |
2,972.4 |
4,133.4 |
6,987.7 |
39.1 |
69.1 |
| |
|
4. |
Iron & steel |
3,387.8 |
3,490.4 |
4,549.7 |
3.0 |
30.3 |
| |
|
5. |
Electronic goods |
1,863.7 |
2,103.7 |
2,969.8 |
12.9 |
41.2 |
| |
D. |
Textiles and Textile Products |
11,182.2 |
12,454.6 |
12,908.3 |
11.4 |
3.6 |
| |
|
1. |
Cotton Yarn, Fabrics, Made-ups, etc., |
2,770.6 |
2,967.8 |
2,952.3 |
7.1 |
-0.5 |
| |
|
2. |
Natural Silk Yarn, Fabrics Madeups etc. (incl.silk waste) |
294.2 |
250.0 |
254.2 |
-15.0 |
1.7 |
| |
|
3. |
Manmade Yarn, Fabrics, Made-ups, etc., |
1,411.0 |
1,896.8 |
2,152.4 |
34.4 |
13.5 |
| |
|
4. |
Manmade Staple Fibre |
111.8 |
162.2 |
195.7 |
45.1 |
20.7 |
| |
|
5. |
Woolen Yarn, Fabrics, Madeups etc. |
56.2 |
57.0 |
68.4 |
1.4 |
20.0 |
| |
|
6. |
Readymade Garments |
5,640.8 |
6,159.5 |
6,419.7 |
9.2 |
4.2 |
| |
|
7. |
Jute & Jute Manufactures |
198.3 |
217.4 |
228.5 |
9.7 |
5.1 |
| |
|
8. |
Coir & Coir Manufactures |
91.1 |
104.0 |
99.2 |
14.1 |
-4.6 |
| |
|
9. |
Carpets |
608.2 |
640.0 |
537.8 |
5.2 |
-16.0 |
| |
|
|
(a) Carpet Handmade |
592.5 |
628.6 |
531.8 |
6.1 |
-15.4 |
| |
|
|
(b) Carpet Millmade |
0.0 |
0.0 |
0.0 |
— |
— |
| |
|
|
(c) Silk Carpets |
15.7 |
11.4 |
5.9 |
-27.3 |
-48.0 |
| |
E. |
Gems & Jewellery |
10,358.9 |
13,263.2 |
13,659.3 |
28.0 |
3.0 |
| |
F. |
Handicrafts |
303.6 |
398.7 |
228.3 |
31.3 |
-42.7 |
III.. |
Petroleum Products |
12,827.8 |
17,244.3 |
21,600.2 |
34.4 |
25.3 |
| |
|
|
|
(15.9) |
(17.1) |
(18.3) |
(7.9) |
(6.5) |
| IV. |
Others |
2,110.9 |
2,709.4 |
2,552.6 |
28.4 |
-5.8 |
| |
|
|
|
2.6 |
2.7 |
2.2 |
|
|
Total Exports |
80,759.9 |
100,586.3 |
118,259.7 |
24.5 |
17.6 |
P : Provisional.
Note : Figures in brackets relate to percentage to total exports for the period.
Source : DGCI & S. |
Statement 4 : Direction of India’s Foreign Trade -Exports |
(US$ million) |
Group/Country |
April-November |
Percentage |
Variation |
2006-07 |
2007-08 |
2008-09 P |
(3)/(2) |
(4)/(3) |
1 |
2 |
3 |
4 |
5 |
6 |
I. |
O E C D Countries |
33,907.6 |
40,941.8 |
45,228.8 |
20.7 |
10.5 |
| |
A. |
E U |
16,827.7 |
21,784.3 |
25,429.3 |
29.5 |
16.7 |
of which: |
|
|
|
|
|
| |
|
1. |
Belgium |
2,138.6 |
2,714.8 |
3,227.8 |
26.9 |
18.9 |
| |
|
2. |
France |
1,350.0 |
1,598.8 |
1,870.3 |
18.4 |
17.0 |
| |
|
3. |
Germany |
2,495.0 |
3,227.7 |
3,870.6 |
29.4 |
19.9 |
| |
|
4. |
Italy |
2,241.6 |
2,491.8 |
2,542.9 |
11.2 |
2.0 |
| |
|
5. |
Netherland |
1,553.1 |
3,156.6 |
4,261.2 |
103.2 |
35.0 |
| |
|
6. |
U K |
3,581.6 |
4,389.0 |
4,276.0 |
22.5 |
-2.6 |
| |
B. |
North America |
13,154.5 |
14,494.0 |
14,939.6 |
10.2 |
3.1 |
| |
|
1. |
Canada |
733.5 |
809.4 |
892.8 |
10.3 |
10.3 |
| |
|
2. |
U S A |
12,421.05 |
13,684.61 |
14,046.83 |
10.2 |
2.6 |
| |
C. |
Asia and Oceania |
2,794.3 |
3,020.6 |
3,053.0 |
8.1 |
1.1 |
| |
|
of which: |
|
|
|
|
|
| |
|
1. |
Australia |
595.5 |
764.8 |
883.5 |
28.4 |
15.5 |
| |
|
2. |
Japan |
1,739.6 |
2,164.4 |
2,032.6 |
24.4 |
-6.1 |
| |
D. |
Other O E C D Countries |
1,131.2 |
1,643.0 |
1,806.9 |
45.2 |
10.0 |
| |
|
of which: |
|
|
|
|
|
| |
|
1. |
Switzerland |
275.1 |
386.3 |
461.9 |
40.4 |
19.6 |
II. |
O P E C |
13,782.0 |
17,221.7 |
23,630.4 |
25.0 |
37.2 |
| |
of which: |
|
|
|
|
|
| |
1. |
Indonesia |
1,187.3 |
1,159.6 |
1,742.7 |
-2.3 |
50.3 |
| |
2. |
Iran |
1,094.8 |
1,548.3 |
1,756.0 |
41.4 |
13.4 |
| |
3. |
Iraq |
124.8 |
144.0 |
251.7 |
15.3 |
74.8 |
| |
4. |
Kuwait |
415.5 |
418.2 |
555.0 |
0.6 |
32.7 |
| |
5. |
Saudi Arabia |
1,631.0 |
2,181.8 |
3,839.4 |
33.8 |
76.0 |
| |
6. |
U A E |
8,011.7 |
10,087.9 |
13,290.6 |
25.9 |
31.7 |
III. |
Eastern Europe |
984.7 |
1,119.2 |
1,425.8 |
13.7 |
27.4 |
| |
of which: |
|
|
|
|
|
| |
1 |
Russia |
563.3 |
580.0 |
733.9 |
3.0 |
26.5 |
IV. |
Developing Countries |
31,910.8 |
40,964.3 |
47,191.1 |
28.4 |
15.2 |
| |
of which: |
|
|
|
|
|
| |
A. |
Asia |
23,769.8 |
30,007.3 |
34,307.6 |
26.2 |
14.3 |
| |
|
a) |
S A A R C |
4,202.9 |
5,287.0 |
6,004.7 |
25.8 |
13.6 |
| |
|
|
1. |
Afghanistan |
108.5 |
161.4 |
250.3 |
48.8 |
55.1 |
| |
|
|
2. |
Bangladesh |
1,066.5 |
1,431.3 |
1,755.6 |
34.2 |
22.7 |
| |
|
|
3. |
Bhutan |
33.2 |
56.0 |
74.3 |
- |
32.6 |
| |
|
|
4. |
Maldives |
44.1 |
56.0 |
72.5 |
26.8 |
29.4 |
| |
|
|
5. |
Nepal |
638.8 |
868.9 |
1,045.7 |
36.0 |
20.3 |
| |
|
|
6. |
Pakistan |
871.0 |
1,014.6 |
977.8 |
16.5 |
-3.6 |
| |
|
|
7 |
Sri Lanka |
1,440.7 |
1,698.8 |
1,828.5 |
17.9 |
7.6 |
| |
|
b) |
Other Asian Developing Countries |
19,566.9 |
24,720.2 |
28,302.9 |
26.3 |
14.5 |
| |
|
|
of which: |
|
|
|
|
|
| |
|
|
1. |
People’s Rep of China |
4,754.2 |
5,916.6 |
5,210.8 |
24.4 |
-11.9 |
| |
|
|
2. |
Hong Kong |
2,929.2 |
3,949.7 |
4,489.0 |
34.8 |
13.7 |
| |
|
|
3. |
South Korea |
1,535.6 |
1,513.6 |
2,484.1 |
-1.4 |
64.1 |
| |
|
|
4. |
Malaysia |
848.7 |
1,415.9 |
1,867.6 |
66.8 |
31.9 |
| |
|
|
5. |
Singapore |
4,176.2 |
4,472.3 |
5,989.0 |
7.1 |
33.9 |
| |
|
|
6. |
Thailand |
890.0 |
1,141.7 |
1,333.8 |
28.3 |
16.8 |
| |
B. |
Africa |
5,561.5 |
7,788.5 |
8,369.1 |
40.0 |
7.5 |
| |
|
of which: |
|
|
|
|
|
| |
|
1. |
Benin |
99.6 |
147.6 |
137.0 |
48.1 |
-7.2 |
| |
|
2. |
Egypt Arab Republic |
436.9 |
841.6 |
1,220.6 |
92.6 |
45.0 |
| |
|
3. |
Kenya |
958.3 |
879.9 |
1,013.8 |
-8.2 |
15.2 |
| |
|
4. |
South Africa |
1,501.2 |
1,620.9 |
1,385.3 |
8.0 |
-14.5 |
| |
|
5. |
Sudan |
267.9 |
251.0 |
296.1 |
-6.3 |
17.9 |
| |
|
6. |
Tanzania |
191.9 |
360.9 |
750.7 |
88.1 |
108.0 |
| |
|
7. |
Zambia |
73.9 |
100.3 |
71.7 |
35.8 |
-28.5 |
| |
C. |
Latin American Countries |
2,579.5 |
3,168.6 |
4,514.4 |
22.8 |
42.5 |
V. |
Others |
79.2 |
200.3 |
357.9 |
152.8 |
78.7 |
VI. |
Unspecified |
95.6 |
139.0 |
425.7 |
45.4 |
206.3 |
| |
Total Exports |
80,759.9 |
100,586.3 |
118,259.7 |
24.5 |
17.6 |
P : Provisional.
Source : DGCI & S. |
Statement 5 : India’s Imports of Principal Commodities |
(US$ million) |
Commodity/Group |
April-November |
Percentage Variation |
2006-07 |
2007-08 |
2008-09 P |
(3)/(2) |
(4)/(3) |
1 |
2 |
3 |
4 |
5 |
6 |
I. |
Bulk Imports |
56,472.3 |
69,650.3 |
107,562.9 |
23.3 |
54.4 |
| |
|
(47.3) |
(45.4) |
(51.6) |
|
|
| |
A. |
Petroleum, Petroleum Products & Related Material |
39,418.55 |
47,617.23 |
75,612.67 |
20.8 |
58.8 |
| |
|
(33.0) |
(31.0) |
(36.2) |
|
|
| |
B. |
Bulk Consumption Goods |
2,336.1 |
3,021.7 |
2,924.1 |
29.3 |
-3.2 |
| |
|
1. |
Wheat |
265.3 |
269.1 |
0.0 |
1.4 |
-100.0 |
| |
|
2. |
Cereals & Cereal Preparations |
23.7 |
25.1 |
29.2 |
6.3 |
16.0 |
| |
|
3. |
Edible Oil |
1,522.5 |
1,863.7 |
2,051.2 |
22.4 |
10.1 |
| |
|
4. |
Pulses |
523.9 |
863.2 |
836.7 |
64.8 |
-3.1 |
| |
|
5. |
Sugar |
0.7 |
0.5 |
7.1 |
-29.9 |
1,373.7 |
| |
C. |
Other Bulk Items |
14,717.7 |
19,011.4 |
29,026.1 |
29.2 |
52.7 |
| |
|
1. |
Fertilisers |
2,338.6 |
3,603.0 |
11,370.4 |
54.1 |
215.6 |
| |
|
|
a) Crude |
237.3 |
280.4 |
726.4 |
18.2 |
159.0 |
| |
|
|
b) Sulphur & Unroasted Iron Pyrites |
69.2 |
160.1 |
622.2 |
131.5 |
288.6 |
| |
|
|
c) Manufactured |
2,032.2 |
3,162.4 |
10,021.8 |
55.6 |
216.9 |
| |
|
2. |
Non-Ferrous Metals |
1,696.4 |
2,286.8 |
2,288.2 |
34.8 |
0.1 |
| |
|
3. |
Paper, Paperboard & Mgfd. incl. Newsprint |
857.9 |
948.8 |
1,322.3 |
10.6 |
39.4 |
| |
|
4. |
Crude Rubber, incl. Synthetic & Reclaimed |
390.1 |
503.6 |
734.9 |
29.1 |
45.9 |
| |
|
5. |
Pulp & Waste Paper |
413.3 |
522.2 |
577.3 |
26.3 |
10.5 |
| |
|
6. |
Metalliferrous Ores & Metal Scrap |
4,969.0 |
5,239.2 |
5,937.5 |
5.4 |
13.3 |
| |
|
7. |
Iron & Steel |
4,052.5 |
5,907.7 |
6,795.5 |
45.8 |
15.0 |
II. |
Non-Bulk Imports |
63,014.3 |
83,845.7 |
101,082.5 |
33.1 |
20.6 |
| |
|
|
|
(52.7) |
(54.6) |
(48.4) |
|
|
| |
A. |
Capital Goods |
27,211.2 |
36,574.9 |
40,586.4 |
34.4 |
11.0 |
| |
|
1. |
Manufactures of Metals |
967.7 |
1,528.9 |
2,153.3 |
58.0 |
40.8 |
| |
|
2. |
Machine Tools |
946.0 |
1,380.6 |
1,629.8 |
45.9 |
18.0 |
| |
|
3. |
Machinery except Electrical & Electronics |
8,678.0 |
12,090.5 |
14,217.6 |
39.3 |
17.6 |
| |
|
4. |
Electrical Machinery except Electronics |
1,279.6 |
1,864.1 |
2,212.2 |
45.7 |
18.7 |
| |
|
5. |
Electronic Goods incl. Computer Software |
11,189.3 |
14,499.0 |
13,585.1 |
29.6 |
-6.3 |
| |
|
6. |
Transport Equipments |
2,922.6 |
4,370.4 |
4,755.0 |
49.5 |
8.8 |
| |
|
7. |
Project Goods |
1,228.1 |
841.3 |
2,033.5 |
-31.5 |
141.7 |
| |
B. |
Mainly Export Related Items |
12,025.3 |
14,639.9 |
22,188.4 |
21.7 |
51.6 |
| |
|
1. |
Pearls, Precious & Semi-Precious Stones |
5,007.0 |
6,133.9 |
10,635.1 |
22.5 |
73.4 |
| |
|
2. |
Chemicals, Organic & Inorganic |
5,229.9 |
6,566.0 |
9,464.4 |
25.5 |
44.1 |
| |
|
3. |
Textile Yarn, Fabric, etc. |
1,492.4 |
1,666.5 |
1,657.8 |
11.7 |
-0.5 |
| |
|
4. |
Cashew Nuts, raw |
296.1 |
273.6 |
431.2 |
-7.6 |
57.6 |
| |
C. |
Others |
23,777.8 |
32,630.9 |
38,307.6 |
37.2 |
17.4 |
| |
|
of which : |
|
|
|
|
|
| |
|
1. |
Gold & Silver |
9,644.3 |
13,605.9 |
12,956.5 |
41.1 |
-4.8 |
| |
|
2. |
Artificial Resins & Plastic Materials |
1,733.8 |
2,413.3 |
2,663.8 |
39.2 |
10.4 |
| |
|
3. |
Professional Instruments etc. except electrical |
1,509.1 |
1,990.1 |
2,513.4 |
31.9 |
26.3 |
| |
|
4. |
Coal, Coke & Briquittes etc. |
2,959.7 |
4,053.9 |
7,579.5 |
37.0 |
87.0 |
| |
|
5. |
Medicinal & Pharmaceutical Products |
783.4 |
1,119.1 |
1,189.8 |
42.8 |
6.3 |
| |
|
6. |
Chemical Materials & Products |
925.0 |
1,051.5 |
1,402.6 |
13.7 |
33.4 |
| |
|
7. |
Non-Metallic Mineral Manufactures |
512.5 |
670.2 |
824.0 |
30.8 |
22.9 |
Total Imports |
119,486.7 |
153,496.0 |
208,645.3 |
28.5 |
35.9 |
Memo Items |
|
|
|
|
|
| |
Non-Oil Imports |
80,068.1 |
105,878.8 |
133,032.7 |
32.2 |
25.6 |
| |
Non-Oil Imports excl. Gold & Silver |
70,423.8 |
92,273.0 |
120,076.1 |
31.0 |
30.1 |
| |
Mainly Industrial Inputs* |
64,546.4 |
84,098.8 |
104,616.9 |
30.3 |
24.4 |
P : Provisional.
* : Non oil imports net of gold and silver, bulk consumption goods, manufactured fertilizers and professional instruments.
Note : Figures in brackets relate to percentage to total imports for the period.
Source : DGCI & S. |
Statement 6 : Direction of India’s Foreign Trade-Imports |
(US$ million) |
Group / Country |
April-November |
Percentage Variation |
2006-07 |
2007-08 |
2008-09 P |
(3)/(2) |
(4)/(3) |
1 |
2 |
3 |
4 |
5 |
6 |
I. |
O E C D Countries |
39,481.2 |
51,952.2 |
63,014.8 |
31.6 |
21.3 |
| |
A. |
E U |
17,661.9 |
22,567.9 |
26,452.6 |
27.8 |
17.2 |
| |
|
of which: |
|
|
|
|
|
| |
|
1. |
Belgium |
2,709.0 |
3,429.1 |
4,532.5 |
26.6 |
32.2 |
| |
|
2. |
France |
1,445.3 |
1,704.3 |
1,849.6 |
17.9 |
8.5 |
| |
|
3. |
Germany |
4,860.5 |
6,060.6 |
7,036.2 |
24.7 |
16.1 |
| |
|
4. |
Italy |
1,672.1 |
2,473.3 |
3,029.5 |
47.9 |
22.5 |
| |
|
5. |
Netherland |
715.3 |
1,081.4 |
1,139.6 |
51.2 |
5.4 |
| |
|
6. |
U K |
2,683.1 |
3,418.0 |
3,872.2 |
27.4 |
13.3 |
| |
B. |
North America |
7,772.9 |
10,365.4 |
13,837.2 |
33.4 |
33.5 |
| |
|
1. |
Canada |
890.1 |
1,279.6 |
1,486.1 |
43.8 |
16.1 |
| |
|
2. |
U S A |
6,882.78 |
9,085.80 |
12,351.02 |
32.0 |
35.9 |
| |
C. |
Asia and Oceania |
7,684.3 |
9,906.5 |
12,049.3 |
28.9 |
21.6 |
| |
|
of which: |
|
|
|
|
|
| |
|
1. |
Australia |
4,630.3 |
5,540.3 |
6,637.2 |
19.7 |
19.8 |
| |
|
2. |
Japan |
2,868.4 |
4,149.8 |
5,098.0 |
44.7 |
22.8 |
| |
D. |
Other O E C D Countries |
6,362.1 |
9,112.4 |
10,675.8 |
43.2 |
17.2 |
| |
|
of which: |
|
|
|
|
|
| |
|
1. |
Switzerland |
5,798.0 |
7,434.6 |
8,736.6 |
28.2 |
17.5 |
II. |
O P E C |
37,820.9 |
46,979.8 |
74,379.8 |
24.2 |
58.3 |
| |
of which: |
|
|
|
|
|
| |
1. |
Indonesia |
2,355.2 |
3,119.7 |
4,412.1 |
32.5 |
41.4 |
| |
2. |
Iran |
5,011.4 |
6,694.8 |
9,551.5 |
33.6 |
42.7 |
| |
3. |
Iraq |
3,992.8 |
3,897.2 |
6,566.5 |
-2.4 |
68.5 |
| |
4. |
Kuwait |
3,960.2 |
4,047.0 |
7,392.8 |
2.2 |
82.7 |
| |
5. |
Saudi Arabia |
9,393.2 |
11,433.1 |
16,163.5 |
21.7 |
41.4 |
| |
6. |
U A E |
5,647.5 |
8,375.6 |
13,651.9 |
48.3 |
63.0 |
III. |
Eastern Europe |
2,390.5 |
2,568.6 |
4,875.7 |
7.4 |
89.8 |
| |
of which: |
|
|
|
|
|
| |
1 |
Russia |
1,343.0 |
1,636.1 |
3,237.5 |
21.8 |
97.9 |
IV. |
Developing Countries |
39,258.7 |
51,530.6 |
65,459.7 |
31.3 |
27.0 |
| |
of which: |
|
|
|
|
|
| |
A. |
Asia |
31,541.7 |
41,790.7 |
52,885.0 |
32.5 |
26.5 |
| |
|
a) |
S A A R C |
1,014.3 |
1,221.4 |
1,264.4 |
20.4 |
3.5 |
| |
|
|
1. |
Afghanistan |
30.2 |
60.3 |
82.0 |
99.9 |
36.0 |
| |
|
|
2. |
Bangladesh |
161.5 |
176.7 |
225.2 |
9.4 |
27.4 |
| |
|
|
3. |
Bhutan |
80.2 |
137.0 |
108.4 |
70.9 |
-20.9 |
| |
|
|
4. |
Maldives |
2.2 |
2.7 |
2.2 |
20.5 |
-18.1 |
| |
|
|
5. |
Nepal |
199.7 |
344.4 |
351.0 |
72.5 |
1.9 |
| |
|
|
6. |
Pakistan |
211.7 |
194.5 |
262.8 |
-8.1 |
35.2 |
| |
|
|
7 |
Sri Lanka |
328.8 |
305.8 |
232.8 |
-7.0 |
-23.9 |
| |
|
b) |
Other Asian Developing Countries |
30,527.4 |
40,569.3 |
51,620.6 |
32.9 |
27.2 |
| |
|
|
of which: |
|
|
|
|
|
| |
|
|
1. |
People’s Rep of China |
11,152.3 |
17,821.2 |
20,853.0 |
59.8 |
17.0 |
| |
|
|
2. |
Hong Kong |
1,617.5 |
1,887.0 |
3,937.8 |
16.7 |
108.7 |
| |
|
|
3. |
South Korea |
3,234.9 |
3,766.1 |
5,760.6 |
16.4 |
53.0 |
| |
|
|
4. |
Malaysia |
3,610.6 |
3,964.9 |
5,218.5 |
9.8 |
31.6 |
| |
|
|
5. |
Singapore |
3,722.8 |
5,107.3 |
5,103.5 |
37.2 |
-0.1 |
| |
|
|
6. |
Thailand |
1,111.2 |
1,571.2 |
1,859.5 |
41.4 |
18.3 |
| |
B. |
Africa |
4,569.5 |
6,176.7 |
8,887.6 |
35.2 |
43.9 |
| |
|
of which: |
|
|
|
|
|
| |
|
1. |
Benin |
68.4 |
61.2 |
103.6 |
-10.6 |
69.4 |
| |
|
2. |
Egypt Arab Republic |
1,210.2 |
1,308.4 |
1,390.5 |
8.1 |
6.3 |
| |
|
3. |
Kenya |
37.8 |
57.6 |
55.3 |
52.4 |
-4.0 |
| |
|
4. |
South Africa |
1,784.9 |
2,489.2 |
3,551.3 |
39.5 |
42.7 |
| |
|
5. |
Sudan |
51.4 |
198.6 |
330.5 |
286.4 |
66.4 |
| |
|
6. |
Tanzania |
38.9 |
58.2 |
70.0 |
49.6 |
20.2 |
| |
|
7. |
Zambia |
73.4 |
65.6 |
59.7 |
-10.7 |
-9.0 |
| |
C. |
Latin American Countries |
3,147.5 |
3,563.1 |
3,687.0 |
13.2 |
3.5 |
V. |
Others |
38.0 |
50.1 |
36.1 |
32.1 |
-28.0 |
VI. |
Unspecified |
497.5 |
414.7 |
879.3 |
-16.6 |
112.0 |
Total Imports |
119,486.7 |
153,496.0 |
208,645.3 |
28.5 |
35.9 |
P : Provisional.
Note : The figures for 2006-07, which include country-wise distribution of petroleum imports, are not strictly comparable with the data for previous years.
Source : DGCI & S. |
|