 IST,
IST,


Measuring Uncertainty: An Indian Perspective
|
by Michael Debabrata Patra, Renjith Mohan, Joice John and Indranil Bhattacharyya^ Drawing on responses from the survey of professional forecasters (SPF), a measure of uncertainty is constructed, incorporating both common and idiosyncratic sources of risk. Uncertainty was high during 2008 till 2013-14 but it started to decline thereafter and remained subdued till 2019-20. It increased in the wake of the COVID-19 pandemic but ebbed from 2022. Common temporal uncertainty is the major contributor to macroeconomic uncertainty. Introduction In the tradition of forward-looking central banks making informed monetary policy decisions by gauging expectations embedded in projections made by professional forecasters, the Federal Reserve Bank of Philadelphia’s survey1 has been a pioneer, with a long history spanning more than 50 years (Croushore and Stark, 2019). Like central banks in many jurisdictions that have incorporated such gauges into their decision-making processes, the Reserve Bank of India (RBI) launched its Survey of Professional Forecasters (SPF) on a quarterly basis in Q2:2007-08 as a pilot initiative. The survey was subsequently transformed into a bimonthly survey from 2014-15 (the 28th round of the survey) to align it with the monetary policy cycle of the RBI. The panellists include economists and experts in banking entities, financial consultancies, credit agencies, asset management companies, brokerage firms and non-financial private corporate firms who generate regular macroeconomic forecasts. The 84th round of the survey was conducted in September 2023. The survey has come a long way and in the past 16 years, it has established itself as a reliable barometer of expectations relating to macroeconomic variables relevant for the formulation of monetary policy. The survey’s questionnaire has remained largely unchanged, presently seeking forecasts for twenty four annual and nineteen quarterly indicators of national accounts, wholesale and retail inflation, banking and policy rates, fiscal and external sector indicators (Annex). The survey itself elicits voluntary participation; the 84th round received responses from 41 panellists. Anonymity of individual forecasts is preserved. A rich history of forecasts has accordingly formed across time and space of quantitative point and interval forecasts of macroeconomic indicators. Within this data set, probability forecasts for annual gross domestic product (GDP) growth and consumer price index (CPI) headline inflation are sought for pre-defined class intervals. The survey’s results are mainly disseminated in terms of medians for the point forecasts, and the diversity or disagreement in forecasts among the participating panellists is reflected in ranges and quartiles2 in a web-based article disseminated in the Reserve Bank’s website3. Measures of dispersion across individual forecasts and estimated probability distributions serve as informative tools to evaluate the uncertainty perceived by the forecasters (RBI, 2014; Bordoloi et al., 2019; 2021). Forecast errors collected from each round of the survey provide insight into understanding the inherent uncertainty surrounding them. This paper is dedicated to the participants of the RBI’s SPF. Uncertainty makes policy making vulnerable to costly errors; yet it is a fact of life for policy makers. Accordingly, this amorphous concept of uncertainty needs to be factored into analytical frameworks underlying decision-making. In this article, we use the SPF data to construct a measure of uncertainty. We argue that it is superior to other measures as it incorporates information on both common4 and idiosyncratic5 uncertainty. We also analyse the causal impact of uncertainty on macroeconomic aggregates, based on this measure. The rest of the article is structured in the following manner. Section II briefly discusses different approaches to measuring uncertainty. The methodology used for measuring uncertainty based on SPF data is set out in Section III. The validation of the measure and empirical results relating to the impact of uncertainty on macroeconomic aggregates are reported in Section IV. Concluding observations are set out in Section V. Uncertainty pervades every aspect of human behaviour. For instance, it can cause spikes in precautionary savings by households which, in turn, can dampen their consumption expenditure and economic activity (Kimball, 1990; Eberly, 1994). Investment decisions and hiring of labour by firms can get postponed during uncertain times due to lack of animal spirits (Bernanke, 1983; Pindyck, 1993; Bertola and Caballero, 1994). Uncertainty also raises risk premia and increases the cost of borrowing (Arellano et al., 2010; Christiano et al., 2014). Paradoxically, increased uncertainty can also have a positive impact if economic agents are nimble enough to adjust to it (Oi, 1961; Hartman, 1976; Abel, 1983). One suite of approaches measures uncertainty from i) financial markets data; ii) data on news articles and internet searches; and iii) forecasts. The financial markets approach assumes that asset prices encapsulate all types of risks and factors affecting the economy at any point of time. In this regard, a ubiquitous proxy is the implied or realised volatility in stock markets such as the CBOE Volatility Index (VIX) (Bloom, 2009; Gilchrist et al., 2014). The limitation of this approach is that the changes in asset prices or the VIX might be due to leverage or financial stress and not necessarily because of macroeconomic uncertainty (Bekaert et al., 2013). Measuring uncertainty by leveraging news text uses the frequency of certain keywords appearing in news articles to create an index of economic policy uncertainty (EPU) (Baker et al., 2016; Ghirelli et al., 2019). In this strand, automated computation of EPU index has been attempted by using the Wasserstein Index Generation (WIG)6 model (Xie, 2020). The important limitation of this measure is that it assumes that news reporters and editors are fully aware of all uncertainty events and report them diligently. Internet searches on economic and financial events of importance are also employed for measuring uncertainty. Errors due to human intervention are sought to be obviated through natural language processing (NLP) and machine learning (ML) methods as well as data on internet-based search intensity available through Google Trends (Dzielinski, 2012; Azqueta-Gavaldon, 2017; Castelnuovo and Tran, 2017; Saltzman and Yung, 2018; Tobback et al., 2018; Bontempi et al., 2021). These measures have also been developed in the Indian context, based on 70 keywords pertaining to fiscal, monetary and trade-related policies that figure prominently in policy discussions and financial news coverage (Pratap and Priyaranjan, 2023). As in the case of news articles-based approaches, this measure may not comprehensively cover all the sections/agents in the economy. Yet another approach is to measure the common uncertainty that is observed in many economic and financial variables based on predictability (Jurado et al., 2015). This measure reflects uncertainty that is based on a set of objective statistical forecasts of various macro and financial variables. As they focus only on common and not idiosyncratic uncertainty, the role of private information and heterogeneous agents is absent in this approach. An alternative measure relies on extracting uncertainty from the cross-sectional disagreement among economic agents, calculated as the dispersion in point forecasts. This approach models the disagreement among professional forecasters (Bachman et al., 2013; Scotti, 2016). The underlying assumption is that inter-personal dispersion is an acceptable proxy for inter-temporal uncertainty. The inherent belief is that professional forecasters consider all possible information about the expected future path of the economy in generating their forecasts. When forecasters disagree with each other about the future economic outlook, the divergence in their forecasts can be used to measure uncertainty; however, this measure is partial as it misses the volatility of aggregate (common) shocks, which is an important component of uncertainty (Lahiri and Sheng, 2010). We address some of these limitations by developing a comprehensive measure of economic uncertainty for India by incorporating information gleaned from the RBI’s SPF. Our measure is based on two components: (i) common uncertainty (Jurado et al., 2015; Jo and Sekkel, 2019); and (ii) idiosyncratic uncertainty (Bachman et al., 2013; Scotti, 2016; Jo and Sekkel, 2019). While the common component is estimated as the perceived variability of future aggregate shocks, the idiosyncratic component is estimated as the disagreement among professional forecasters across two different layers viz., among forecasters and among different variables. Our index of macroeconomic uncertainty for India draws on the rich information on various forecasts embedded in the SPF characterised by (i) the conditional time-varying variance of the forecast errors for various macroeconomic indicators; and (ii) the cross-sectional disagreement of professional forecasters calculated as the deviation in individual point forecasts. Guided by the related literature (Rossi and Sekhposyan, 2015; Scotti, 2016; Ozturk and Sheng, 2018; Jo and Sekkel, 2019), the first component of our measure is derived from the stochastic variances in errors of the professional forecasters that are aggregated by using a dynamic factor model (DFM). The second component is the within-sample variations in forecasts for different macroeconomic and financial variables that are aggregated by using a DFM to capture idiosyncratic uncertainty (Lahiri and Sheng, 2008; 2010; Ozturk and Sheng, 2018; Jo and Sekkel, 2019). Our economy-wide measure of uncertainty is an unweighted sum of these two components. We use one-year ahead median forecasts and their ranges relating to 9 macroeconomic variables i.e., output growth; inflation; credit growth; fiscal deficit; the policy repo rate; the yield on 10-year central government securities (G-sec), the 91-day treasury bill (t-bill) rate; the current account deficit (CAD); and the exchange rate over the period 2008 to 2023. For estimating common temporal uncertainty, we first identify the one-year ahead forecast errors relating to each of the 9 macro variables. For inflation, the policy rate and the exchange rate, quarterly forecasts up to 3 quarters ahead are available for the entire sample period. Hence, for these variables, the 3-quarter ahead forecast errors are calculated and linearly extrapolated to estimate the one-year ahead forecast errors. The fixed-period forecast errors are converted to fixed-horizon forecast errors by employing the following transformation (Dovern et.al, 2012) 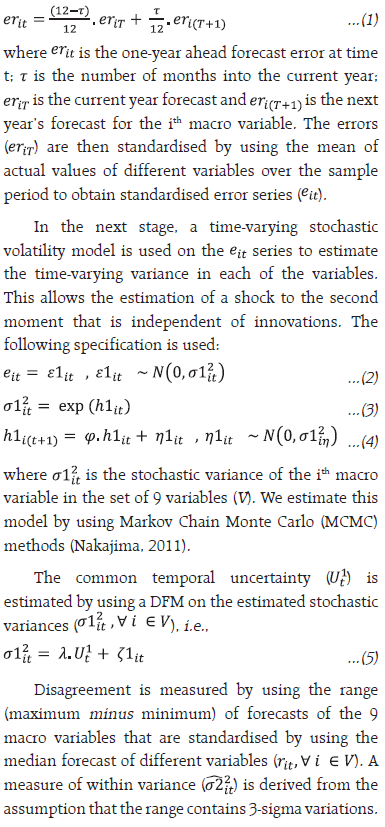 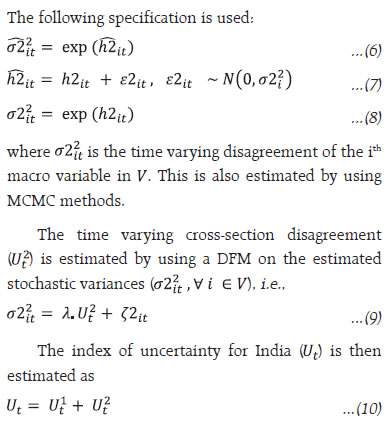 Variable-specific uncertainties originating from the common temporal and disagreement (idiosyncratic) components for the 9 variables provide interesting insights (Chart 1). First, the common temporal uncertainties are much more pronounced than disagreements. Second, inflation uncertainties, which were elevated during the post- global financial crisis (GFC) period, have ebbed since September 2015. Third, growth-related uncertainties, which remained moderate during the pre-COVID period, became accentuated after the outbreak of the pandemic. Fourth, external uncertainties (represented by variations in the CAD) increased after the GFC and peaked around 2013-14, moderating thereafter only to reappear during the pandemic. Fifth, macro policy related uncertainties remained low throughout the sample period except during 2020-21 when they increased due to the pandemic-induced fiscal expansion and monetary accommodation. Sixth, credit growth related uncertainties seem to have emerged since 2022. 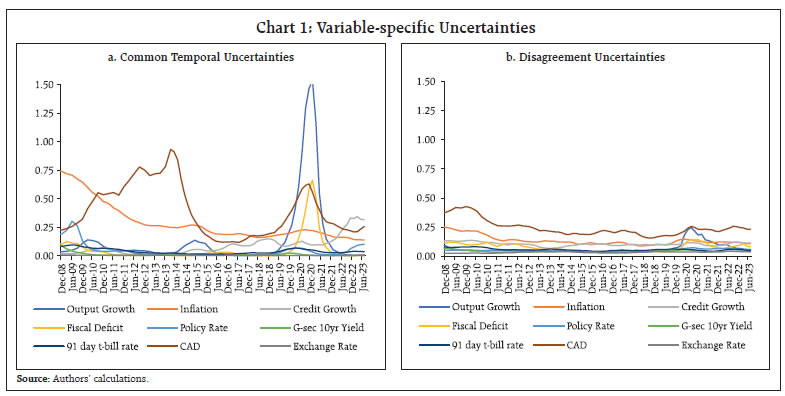 Variable-specific uncertainties are found to be correlated. Output growth uncertainty is highly correlated with fiscal policy related uncertainty (0.93), reflecting the role of fiscal policy as an automatic stabiliser. Inflation uncertainty is highly correlated with monetary policy uncertainty (0.73) with spillovers. Monetary policy uncertainty is highly correlated with the uncertainties related to the 91-day t-bill rate (0.83) and 10-year G-sec yield (0.73), indicative of spillovers from monetary policy to bond markets. Uncertainty in the CAD is correlated with that of output growth (0.25), inflation (0.40), the fiscal deficit (0.30) and 91-day t-bill rate (0.38). Monetary and fiscal policy uncertainties are also found to be correlated (0.36), indicating the role of common shocks. Significant correlations among variable-specific uncertainties indicate the presence of an unobserved common component. This justifies the use of a DFM for extracting a common macroeconomic measure latent in variable-specific uncertainties. Macroeconomic uncertainty was high in the post-GFC period till 2013-14 (Chart 2). It started to decline from early 2014-15 and remained subdued till 2019-20. The period of low uncertainty coincided with the adoption of the flexible inflation targeting (FIT) framework in India. By 2020, we observe a rise in uncertainty induced by the COVID-19 pandemic. It subsided by 2022 but to a level higher than what was witnessed during the pre-COVID period. The common temporal uncertainty is the major contributor to macroeconomic uncertainty throughout the sample period. Thus, unforeseeable shocks have driven macroeconomic uncertainty in the past one and a half decades. Next, we assess the role of uncertainty on macroeconomic variables by using a 3-variable vector autoregression (VAR) model with inflation (seasonally adjusted quarter-on-quarter changes in the consumer price index), the output gap7 and the policy repo rate as endogenous variables, and uncertainty as an exogenous variable.8 The dynamic multiplier effects show that higher uncertainty leads to depressed demand conditions and higher inflation (Chart 3). 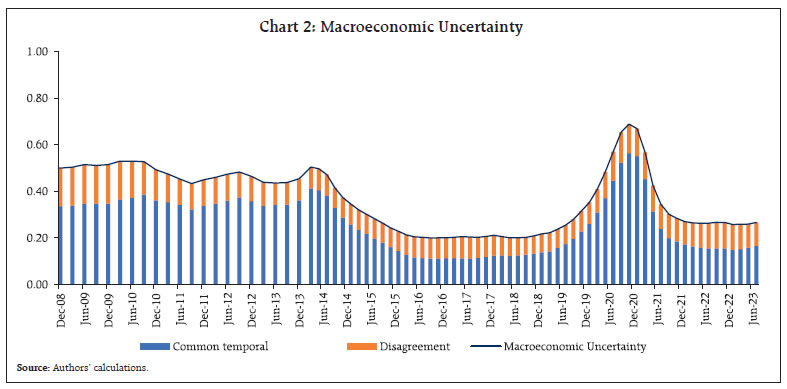 The empirical evidence suggests that high uncertainty is equivalent to a stagflation shock under which output falls and inflation rises. This aggravates the policy dilemma for the monetary authority. On the one hand, it cannot afford to allow the further weakening of demand by responding to the inflationary impact of an uncertainty shock through aggressive policy tightening. On the other hand, a tepid policy response to rising inflation runs the risk of de-anchoring inflation expectations and jeopardising price stability, eventually undermining aggregate demand. 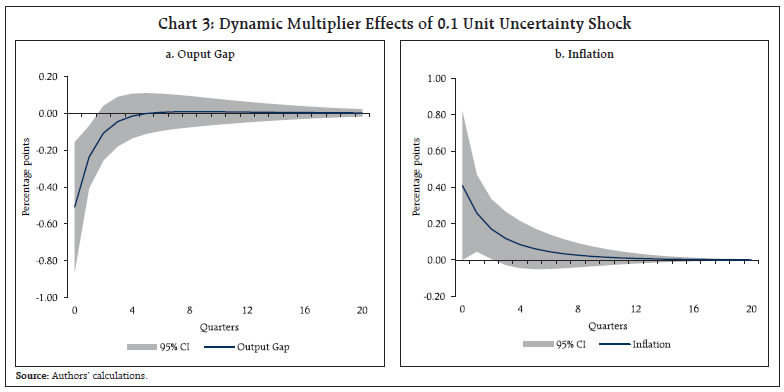 We live in an age of high uncertainty; it permeates us like adrenaline coursing through our veins. This uncertainty makes policy making vulnerable to costly errors; yet it is a fact of life that needs to be factored into analytical frameworks underlying decision-making. In fact, uncertainty is the only certainty there is and knowing how to live with it is the only security. Hence, measuring uncertainty is the pragmatic approach we adopted in this paper so as to comprehend it and factor in its implications. By doing so, we hope we will achieve more lucid communication of policy challenges and the associated trade-offs. Measuring it through the lens of professional forecasters is, in our view, superior to all other measures available in the literature as it combines both common and idiosyncratic uncertainty. Based on this measure, it is found that uncertainty was high during the post-GFC period till 2013-14 but started to decline thereafter and remained subdued till 2020, coinciding with the adoption of FIT in India. Thereafter, uncertainty increased in the wake of the COVID-19 pandemic before ebbing from 2022. Common temporal uncertainty has been the major contributor to macroeconomic uncertainty throughout the sample period, suggesting the incidence of unanticipated shocks that affects us all. During periods of heightened uncertainty our measure turns out to be a very valuable lead indicator – higher uncertainty causes a decline in output while stoking inflation pressures. This, in turn, poses a policy dilemma – boost output by easing monetary policy but risk aggravating inflation or contain inflation by conducting restrictive monetary policy but at the cost of depressing already weak demand? This trade-off is timeless but our view is that in the absence of a measure of uncertainty that is explicitly incorporated into analytical frameworks, policy actions and stances can turn out to be inefficient and oscillating in space and time – either too restrictive, throttling growth or too lax unhinging inflation expectations. In the final analysis, measuring uncertainty warrants close attention and its non-linear and time-varying effects on macroeconomic variables should be accounted for in the most pragmatic way so as to imbue precision into policy making. Forewarned is forearmed. References Abel, A.B. (1983). Optimal investment under uncertainty. American Economic Review,73(1):228. Arellano, C., Bai, Y., and P.Kehoe (2010), Financial markets and fluctuations in uncertainty. Federal Reserve Bank of Minneapolis Working Paper. Azqueta-Gavoldon, A. (2017), Developing news-based Economic Policy Uncertainty Index with unsupervised machine learning, Economic Letters, September, 47-50. Bachmann, R., Elstner, S., & Sims, E. R. (2013). Uncertainty and economic activity: Evidence from business survey data. American Economic Journal: Macroeconomics, 5(2), 217-249. Baker, S. R., Bloom, N., & Davis, S. J. (2016). Measuring economic policy uncertainty. The quarterly journal of economics, 131(4), 1593-1636. Bekaert, G., Hoerova, M., & Duca, M. L. (2013). Risk, uncertainty and monetary policy. Journal of Monetary Economics, 60(7), 771-788. Bernanke, B.S. (1983). Irreversibility, uncertainty, and cyclical investment. Quarterly Journal of Economics, 98(1):85–106. Bertola, G., and R.J. Caballero (1994). Irreversibility and aggregate investment. Review of Economic Studies, 61(2):223–246. Bloom, N. (2009). The impact of uncertainty shocks. Econometrica, 77(3), 623-685. Bontempi, M.E., Frigeri, M., Golinelli, R., and M. Squadrani (2021). EURQ: A new web search-based uncertainty index. Economica, 88(352):969–1015. Bordoloi, S., Kavediya, R., Roy, S. and Goyal, A. (2019). Changes in Macroeconomic Perceptions: Evidence from the Survey of Professional Forecasters, Reserve Bank of India Bulletin, November 2019, LXXIII (11), 15-26. Bordoloi, S., Kavediya, R., Roy, S. and Dutta, A.K. (2021). Uncertainty and Disagreement among Professional Macroeconomic Forecasters, Reserve Bank of India Bulletin, November 2021. Castelnuovo, E. and T.D. Tran (2017). Google it Up! a Google trends-based uncertainty index for the United States and Australia. Economic Letters, 161:149–153. Christiano, L.J., Motto, R., and M. Rostagno (2014), Risk shocks. American Economic Review,104(1):27–65. Croushore, D., and Stark, T., (2019), Fifty Years of the Survey of Professional Forecasters, Economic Insights (Fourth Quarter 2019), Federal Reserve Bank of Philadelphia. Dovern, J., Fritsche, U., & Slacalek, J.. (2012). Disagreement Among Forecasters in G7 Countries, The Review of Economics and Statistics, vol. 94(4), pages 1081-1096, November. Dzielinski, M. (2012). Measuring economic uncertainty and its impact on the stock market. Financial Research Letters, 9(3):167–175. Eberly, J.C. (1994). Adjustment of consumers’ durables stocks: evidence from automobile purchases. Journal of Political Economy, 102(3):403–436. Ghirelli, C., Pérez, J.J., and A. Urtasun (2019). A new economic policy uncertainty index for Spain. Economic Letters, 182:64–67. Gilchrist, S., Sim, J. W., & Zakrajšek, E. (2014). Uncertainty, financial frictions, and investment dynamics (No. w20038). National Bureau of Economic Research. Hartman, R. (1976). Factor demand with output price uncertainty. American Economic Review, 66(4):675–681. Jo, S., & Sekkel, R. (2019). Macroeconomic uncertainty through the lens of professional forecasters. Journal of Business & Economic Statistics, 37(3), 436-446. Jurado, K., Ludvigson, S. C., & Ng, S. (2015). Measuring uncertainty. American Economic Review, 105(3), 1177-1216. Kimball, M.S. (1990). Precautionary saving in the small and in the large. Econometrica, 58(1):53–73. Lahiri, K., & Sheng, X. (2008). Evolution of forecast disagreement in a Bayesian learning model. Journal of Econometrics, 144(2), 325-340. Lahiri, K., & Sheng, X. (2010). Measuring forecast uncertainty by disagreement: The missing link. Journal of Applied Econometrics, 25(4), 514-538. Nakajima, J. (2011). Time-varying parameter VAR model with stochastic volatility: An overview of methodology and empirical applications. Monetary and Economic Studies, 29, 107–142. Oi, W.Y. (1961). The desirability of price instability under perfect competition. Econometrica, 29:58. Ozturk, E. O., & Sheng, X. S. (2018). Measuring global and country-specific uncertainty. Journal of international money and finance, 88, 276-295. Patra, M. D., Behera, H., & John, J. (2021). ‘Is the Phillips Curve in India Dead, Inert and Stirring to Life or Alive and Well?. RBI Bulletin, November. Pindyck, R.S. (1993). A note on competitive investment under uncertainty. American Economic Review, 83(1):273–277. Pratap, B., and Priyaranjan, N. (2023). Macroeconomic effects of uncertainty: a Google trends-based analysis for India. Empirical Economics, 65, 1599–1625. https://doi.org/10.1007/s00181-023-02392-z Rossi, B., & Sekhposyan, T. (2015). Macroeconomic uncertainty indices based on nowcast and forecast error distributions. American Economic Review, 105(5), 650-655. Reserve Bank of India (2014), Survey of Professional Forecasters 2014-15, RBI Bulletin, December. Scotti, C. (2016). Surprise and uncertainty indexes: Real-time aggregation of real-activity macro-surprises. Journal of Monetary Economics, 82, 1-19. Saltzman, B. and J. Yung (2018). A machine learning approach to identifying different types of uncertainty. Economic Letters, 171:58–62. Tobback, E., Naudts, H., Daelemans, W., de Fortuny, E.J. and D.Martens (2018), Belgian economic policy uncertainty index: improvement through text mining. International Journal of Forecasing, 34(2):355–365. Xie, F. (2020). Wasserstein index generation model: automatic generation of time-series index with application to economic policy uncertainty. Economic Letters, 186:108874. ^ The authors are from the Reserve Bank of India. The views expressed in this article are those of the authors and do not represent the views of the Reserve Bank of India. 1 National Bureau of Economic Research (NBER) and American Statistical Association (ASA) had instigated the survey in 1968 and then Philadelphia Fed. assumed control from 1990 onwards. 2 First and third quartiles are only published for annual horizon forecasts and not for quarterly forecasts. 3 Available at https://www.rbi.org.in/scripts/BimonthlyPublications.aspx?head=Survey%20of%20Professional%20Forecasters%20-%20Bi-monthly. 4 Common uncertainty is the variation in uncertainty across different economic variables and different forecasters that are common to all. 5 Idiosyncratic component is the degree of disagreement among professional forecasters on their views about the future economic state. 6 It is an unsupervised machine learning technique requiring a small data set and incorporates deeper methods from machine learning research, including word embedding, Wasserstein Dictionary Learning, and Adam algorithm. 7 Estimated based on Patra et al. (2021) 8 The VAR is found to be stable. The residual autocorrelations are absent. The lag-length is identified using Schwarz Bayesian criterion. |

ഈ പേജ് ഷെയർ ചെയ്യുക:


റിസർവ് ബാങ്ക് ഓഫ് ഇന്ത്യ മൊബൈൽ ആപ്ലിക്കേഷൻ ഇൻസ്റ്റാൾ ചെയ്ത് ഏറ്റവും പുതിയ വാർത്തകളിലേക്ക് വേഗത്തിലുള്ള ആക്സസ് നേടുക!
ഞങ്ങളുടെ ആപ്പ് ഇൻസ്റ്റാൾ ചെയ്യാൻ QR കോഡ് സ്കാൻ ചെയ്യുക


പേജ് അവസാനം അപ്ഡേറ്റ് ചെയ്തത്:


