
South-West Monsoon 2010: A Review (June 1 to September 30, 2010) - ആർബിഐ - Reserve Bank of India


South-West Monsoon 2010: A Review (June 1 to September 30, 2010)
South-West Monsoon 2010: A Review* (June 1 to September 30, 2010) The South-West Monsoon during June- September 2010 had crossed the India Meteorological Department’s (IMD) long period average (LPA) (average rainfall of 89 cm during 1941-1990) by 2 per cent, the second highest level attained in the last one decade, as against a deficient rainfall of 22 per cent during June-September 2009. This augurs well for the growth of agriculture and allied activities which has become increasingly resilient and diversified in recent years, though still dependent on rainfall. Consequently, barring some oilseeds, area sown during kharif 2010-11 has surpassed area sown during 2009-10 as well as 2008-09. Improved sowing, in turn, has been reflected in better prospects of kharif harvest as per the First Advance Estimates, which estimated increased production across all crops, namely, foodgrains and its subcategories of coarse cereals and pulses with growth rates of 10.4 per cent, 19.5 per cent and 39.5 per cent, respectively. Kharif oilseeds are estimated to grow by 10.3 per cent over the production in the previous year. These favourable developments are, therefore, expected to ease pressure on food prices, even with respect to kharif pulses, the production of which is expected to increase by around 2 million tonnes during 2010-11 over 2009-10. Introduction Typical of its geographical location, the Indian subcontinent with its predominantly agrarian economy continues to revolve around the vagaries of rainfall, called the Monsoon. Rainfall directly affects sowing, which, in turn, affects crop production. As per the latest data available (2007-08), only 42.6 per cent of the gross cropped area was irrigated. Consequently, years of deficient and iniquitously distributed rainfall have invariably been associated with decline in crop/agricultural production (Table 1). Broadly, the pattern of rainfall/Monsoon in India can be classified into two seasons, viz., South-West or the summer Monsoon covering the period from June-September and North-East or the winter Monsoon from October to December. The summer Monsoon accounts for about 70-80 per cent of the annual rainfall in the country. The spatial and temporal distribution of rainfall during South-West Monsoon is crucial for the success or failure of the Kharif crops that are essentially sown in July-August. With the exception of 2009, precipitations during South-West Monsoon remained close to normal during the four years from 2005 to 2010. Precipitation during the current year, being above LPA, is likely to contribute positively to the overall foodgrains production. In the backdrop of these developments, this article provides a detailed review of the performance of South-West Monsoon during June-September 2010.
South-West Monsoon 2010: Highlights • For the country as a whole, the rainfall for the season (June-September) was 102 per cent of its long period average (LPA) of 89 cm. • Seasonal rainfall was 112 per cent of its LPA over North-West India, 104 per cent of its LPA over Central India, 118 per cent of its LPA over south Peninsula and 82 per cent of its LPA over North-East India. • Monthly rainfall over the country as a whole was 84 per cent of LPA in June, 103 per cent of LPA in July, 106 per cent of LPA in August and 113 per cent of LPA in September. • Out of 597 meteorological districts for which data are available, 173 districts (29 per cent) received excess, 240 districts (40 per cent) received normal, 173 districts (29 per cent) received deficient and the remaining 11 districts (2 per cent) received scanty rainfall during the season. • Southwest monsoon current advanced over the Andaman Sea on May 17. The monsoon set in over Kerala on May 31, one day earlier than its normal date of June 1 and covered the entire country by July 6, 9 days earlier than its normal date of July 15. The withdrawal of monsoon was delayed and it commenced from west Rajasthan only on September 27, compared to its normal date of September 1. • Though there were two intense systems viz., the Severe Cyclonic Storm (Laila, May 16-21) over the Bay of Bengal and the Very Severe Cyclonic Storm (Phet, May 31-June 2) over the Arabian Sea during the advance phase, the entire monsoon season was devoid of any monsoon depressions. Thus, 2010 has been the only year in the recorded history after 2002, to have no depressions during the entire season. • The forecast for monsoon onset over Kerala has been correct for the sixth consecutive year since its first issuance in 2005. • Most of the operational long-range forecasts issued for the 2010 South-West monsoon rainfall have been correct. The rainfall forecast for the country as a whole for the entire season, second half of the season and for the months of July, August and September have been accurate. Forecast: South-West Monsoon 2010-11 India Meteorological Department (IMD) has been adopting a two-stage forecast strategy for the South-West monsoon rainfall since 2003. The first forecast for South-West monsoon rainfall comes out in the month of April using the data up to March. It also issues updated forecasts using the data up to May in the month of June. Based on indigenously developed statistical model, it was predicted on May 14, 2010 that monsoon will set in over Kerala on May 30, 2010 with a model error of ±4 days. The forecast came correct as the actual monsoon onset over Kerala took place on May 31, 2010 one day later than the forecasted date. Thus, this is the sixth consecutively correct operational forecast for the monsoon onset over Kerala since it was issued in 2005. The IMD’s forecast for rainfall during the South-West monsoon at different periods of time are illustrated in Table 2. All the monthly forecasts turned out to be correct as the actual rainfall were 103 per cent, 106 per cent and 113 per cent of LPA, respectively. The actual seasonal rainfall over Central India was within the forecast limit and that over North-West India was slightly above the forecast limit. However, the forecast for seasonal rainfall over North-East India and South Peninsula were not accurate as North-East India experienced deficient rainfall and South Peninsula experienced excess rainfall against the normal rainfall predicted for both the regions.
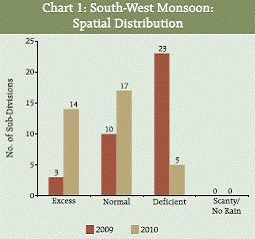
Distribution of Rainfall: South-West Monsoon 2010 The season ended with the areaweighted rainfall for the country as a whole at 102 per cent of the LPA. This is the second highest level of precipitation received in the past decade. Spatial Distribution During June 2010, large rainfall deficiency was observed over many subdivisions of central, northern and eastern parts of the country due to delayed monsoon advance over these regions. However, the rainfall situation over the country improved significantly during July 2010, especially during second half of the month. Normal or excess rainfall was received over most of the subdivisions except a few subdivisions from eastern and north-eastern parts of the country where the rainfall was deficient. The number of subdivisions with excess and deficient rainfall during August (excess 18 and deficient 9) was more than that during July (excess 13 and deficient 5). During August, most of the subdivisions from North-West and Peninsular India received excess rainfall and most of the subdivisions from eastern part of the country were deficient. However, subdivisions from north-eastern part Of the 36 meteorological sub-divisions, cumulative rainfall was excess/normal in 31 sub-divisions and deficient/scanty/no rain in 5 sub-divisions. The positions of spatial distribution during the corresponding period last year were 13 and 23 sub-divisions, respectively. The cumulative seasonal rainfall from June 1 to September 30, 2010 was excess in 14 meteorological subdivisions (43 per cent of the total area of the country) and normal in 17 meteorological subdivisions (42 per cent of the total area of the country). Five subdivisions (East Uttar Pradesh, Bihar, Jharkhand, Gangetic West Bengal and Assam and Meghalaya) constituting 15 per cent of the total area of the country received deficient rainfall (Chart 1, Table 3 and Statement I). District-wise, out of 597 meteorological districts for which data were available, 69 per cent of the meteorological districts received excess/normal rainfall and the remaining 31 per cent received deficient/ scanty rainfall during the season (Statement II). The corresponding figures for the previous year were 41 per cent and 59 per cent, respectively.
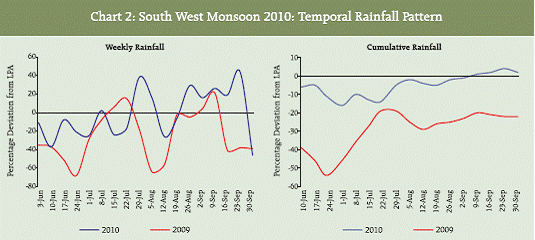
Temporal Distribution The weekly rainfall was below LPA during all the weeks of June. In July, the weekly rainfall was above LPA during the first and last week and below LPA during the two weeks between them. During second and third weeks of August and last week of September the rainfall was deficient. Except for these three weeks, the weekly rainfall during the second half of the season (August-September) was above LPA. The cumulative rainfall distribution shows large deficiency in rainfall during early part of the season. As a result, the cumulative weekly rainfall remained below LPA till end of August. It was only by the first week of September that cumulative weekly rainfall rose above LPA and remained so till the end of the season (Chart 2). Disorganised convective activity during the weak phase of the monsoon and interaction of monsoon current with the mid-latitude troughs in westerlies caused flood situation in some States, viz., Rajasthan, Arunachal Pradesh, Uttar Pradesh, Uttarakhand, Haryana, Punjab and Himachal Pradesh. The low pressure areas induced flood situations over some parts of Gujarat, Maharashtra, Chhattisgarh, Madhya Pradesh, Karnataka and Orissa.
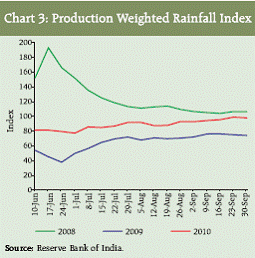
Production Weighted Rainfall Index The foodgrains production weighted index (PRN) is constructed by the Reserve Bank based on the weighted average of actual rainfall received by the States where weights are taken as the average share of foodgrains production by a particular State in the overall foodgrains production 1 . As per this index, the rainfall during South-West monsoon 2010 was 2 per cent below normal as against 26 per cent in the previous year, though within the limit of normal rainfall prediction by IMD which predicted rainfall of 102 per cent LPA for the country as a whole (Chart 3). Normal rainfall in most districts of major foodgrains producing States and better sowing positions had been reflected in an estimated increase in foodgrains production during the kharif 2010-11 by 10.4 per cent over the previous year as per the First Advance Estimate. Reservoir Status In India, the Central Water Commission monitors the total live water storage in the 81 major reservoirs having full reservoir level (FRL) of 151.77 billion cubic metres (BCM), which accounts for around 67 per cent of the total reservoir capacity of the country. As on September 30, 2010 water stock (storage to live capacity) in these 81 major reservoirs was 75 per cent of the FRL as against 60 per cent during the corresponding period last year. The average storage to live capacity during the last ten years was 66 per cent (Table 4).
Progress of Sowing Good monsoon during June-September 2010 was reflected in better kharif sowing. Latest sowing position indicated that sowing of all crops during the current kharif season as on October 22, 2010 was 99.0 per cent of the normal level against 92.6 per cent last year. Kharif sowing under foodgrains was 95.5 per cent of normal area against 88.8 per cent during the corresponding period last year. Consequently, production of kharif foodgrains in 2010-11, as per the First Advance Estimates, is estimated at 114.6 mn tonnes, 10.4 per cent higher than kharif foodgrains production of 103.8 mn tonnes during 2009-10. Increased production has been estimated across all sub-categories of foodgrains, total oilseeds, cotton and sugarcane (Table 5).
* Prepared in the Structural Issues Division, Department of Economic and Policy Research, Reserve Bank of India. The previous article on ‘South-West Monsoon 2009: A Review (June 1 to September 30, 2009)’ was published in November 2009 issue of the RBI Bulletin. 1 A PRN of 100 indicates normal rainfall, where normal represents average of last 10 years’ weighted rainfall. |
||||||||||||||||||||||||||||||||||||||||||||||||||||||||||||||||||||||||||||||||||||||||||||||||||||||||||||||||||||||||||||||||||||||||||||||||||||||||||||||||||||||||||||||||||||||||||||||||||||||||||||||||||||||||||||||||||||||||||||||||||||||||||||||||||||||||||||||||||||||||||||||||||||||||||||||||||||||||||||||||||||||||||||||||||||||||||||||||||||||||||||||||||||||||||||||||||||||||||||||||||||||||||||||||||||||||||||||||||||||||||||||||||||||||||||||||||||||||||||||||||||||||||||||||||||||||||||||||||||||||||||||||||||||||||||||||||||||||||||||||||||||||||||||||||||||||||||||||||||||||||||||||||||||||||||||||||||||||||||||||||||||||||||||||||||||||||||||||||||||||||||||||||||||||||||||||||||||||||||||||||||||||||||||||||||||||||||||||||||||||||||||||||||||||||||||||||||||||||||||||||||||||||||||||||||||||||||||||||||||||||||||||||||||||||||||||||||||||||||||||||||||||||||||||

ഈ പേജ് ഷെയർ ചെയ്യുക:


റിസർവ് ബാങ്ക് ഓഫ് ഇന്ത്യ മൊബൈൽ ആപ്ലിക്കേഷൻ ഇൻസ്റ്റാൾ ചെയ്ത് ഏറ്റവും പുതിയ വാർത്തകളിലേക്ക് വേഗത്തിലുള്ള ആക്സസ് നേടുക!


