 IST,
IST,
State of the Economy
The balance of risks is increasingly tilted towards a darkening global outlook and emerging market economies (EMEs) appear to be more vulnerable, even though incoming data suggest that global inflation may have peaked. The near-term growth outlook for the Indian economy is supported by domestic drivers as reflected in trends in high frequency indicators. Equity markets touched a string of new highs during November buoyed by strong portfolio flows to India. Headline inflation moderated by 90 basis points to 5.9 per cent in November driven by a fall in vegetables prices even as core inflation remained steady at 6 per cent. Waning input cost pressures, still buoyant corporate sales and turn-up in investments in fixed assets are heralding the beginning of an upturn in the capex cycle in India which will contribute to a speeding up of growth momentum in the Indian economy. Introduction A burst of volatility - most recently sparked by tough talk from central banks - is igniting global financial markets into front-running underlying economic activity. In several parts of the world, inflation is recoiling, although it is still hooded and ready to strike. Energy prices have plummeted to pre-Ukraine war lows (but energy stocks are rising!); supply chains are disentangling; ports are decongesting; and there is a glut of chips and semi-conductors. Several economies have recorded expansion in the July-September quarter, shrugging off contractions in preceding quarters, and dispelling doomsday predictions of imminent recessions. High frequency indicators reflect strong labour markets and consumer spending in October-November. These developments have led to the resurgence of the ‘short and shallow’ view1 regarding global recession and the fear that the complacency associated with ‘team transitory’ may be returning. Inflation may be slightly down, but it is certainly not out. If anything, it has broadened and become stubborn, especially at its core. An unease hangs over energy prices: for now, OPEC plus stayed its hand in cutting production, but an oil price cap threatens to unleash disruptive financial forces, with hedge funds already cutting net long positions in crude contracts. Despite moderation in global commodity markets, climate change and the war in Ukraine are set to keep food prices at higher than pre-pandemic levels. Central banks may have moderated the pace of monetary policy tightening or hinted at it, but they are in no mood to ease off in their fight against inflation. Disinflation is about to become painful. Financial conditions, and especially borrowing costs, are biting into discretionary consumer spending and housing demand, and stalling investment in new capacity creation. With every passing day, the balance of risks gets increasingly tilted towards a darkening global outlook for 2023, the year that will bear the brunt of monetary policy actions of this year. Emerging market economies (EMEs) appear even more vulnerable, having battled currency depreciations and capital outflows in addition to slowing growth and high inflation. Debt distress is rising, with a surge in default rates and an appreciating US dollar – the principal currency in which debt is denominated – although more recently it has tumbled down from 20-year highs. Looking beyond, a mild recovery is projected to get underway in most countries in 2024. Emerging Asia will likely become the world’s engine of growth, collectively accounting for close to three-quarters of global growth in 2023 and around three-fifths in 2024. Among other important global developments, the world’s population crossed 8 billion in the middle of November and would reach 9 billion by 2037, but driven by older people – the number of people aged 65 and over is expected to rise from 783 million in 2022 to 1.4 billion by 2043. In contrast, the share of people aged 15 to 64 – the working age population – is falling. The global fertility rate has halved since the 1950s to 2.3 births per woman. Ageing is the most important demographic change of this century. Fossil fuel disruptions have provided a boost for renewables. According to the International Energy Agency, renewables are seen to be growing by almost 2,400 gigawatts (GW) over the next five years, accounting for over 90 per cent of global electricity capacity expansion. This is being mainly driven by the United States, the European Union, China and India, which are all implementing supportive policies and regulatory and market reforms. Solar photovoltaic (PV) manufacturing investment in India and the United States is expected to reach almost US$ 25 billion over 2022-2027, a sevenfold increase compared with the last five years. India’s production linked Incentives (PLI) initiative closes nearly 80 per cent of manufacturers’ investment cost gap with the lowest-cost manufacturers in China. The United States, Canada, Brazil, Indonesia and India make up 80 per cent of global expansion in biofuel use, as all five countries have comprehensive policy packages that support growth. With the addition of 145 GW, India is forecast to almost double its renewable power capacity over 2022-2027. Solar PV accounts for three-quarters of this growth, followed by onshore wind with 15 per cent and hydropower providing almost all the rest. The overarching drivers of renewable energy growth are India’s targets of 500 GW of non-fossil installed capacity by 2030 and net zero emissions by 2070, ensuring long-term viability for renewable energy developers. On this note, we turn to developments in India during the month gone by. On December 7, 2022 the monetary policy committee (MPC) delivered a ‘policy pivot’. After three consecutive policy rate increases of 50 basis points each, the pace of increase was moderated to 35 basis points in response to a modest downward shift in the projected trajectory of inflation, a dip in inflation expectations and indications that the economy’s resilience and growth foundations are improving. Seeing pressure points in some categories of food, and persistence and generalisation across the core constituent, however, the MPC decided that further withdrawal of accommodation is warranted “to keep inflation expectations anchored, break the core inflation persistence and contain second round effects, so as to strengthen medium-term growth prospects.”2 The stance of monetary policy has been summarised pithily in Governor Shri Shaktikanta Das’s statement: “While being watchful of the impact of our earlier monetary policy actions, we will keep Arjuna’s eye on the evolving inflation dynamics and be ready to act as may be necessary. Our actions will be nimble and in the best interest of the economy.” If the projections set out in the resolution hold, then perhaps India is poised to achieve the first milestone in its price stability objective – bringing headline inflation enduringly into the tolerance band during 2023-24. Yet, with inflation projected to turn up in the second quarter of next year, there can be no letting down of the guard. The moderation in the size of the policy rate change also provides the space to assess the cumulative impact of tightening undertaken so far on macroeconomic and financial conditions and outlook. The Reserve Bank’s projections of real GDP growth turned out to be spot-on with regard to the quarterly estimates for July-September 2022 released by the National Statistical Office, with one unpleasant surprise. Input cost pass-through caused corporate expenditures to outpace revenues, resulting in a contraction in net profits and, hence, in industry’s contribution to gross value added. With international and domestic input cost pressures showing signs of easing and with corporate sales growth still buoyant, it is expected that earnings will improve in subsequent quarters and contribute to a speeding up in the momentum of growth in the Indian economy. Furthermore, corporate balance sheets also reflected a turn-up in investments in fixed assets, heralding the modest beginning of an upturn in the capex cycle. Sensing these potential tailwinds, domestic financial markets have rallied and it is the capacity of Indian companies to turn the pick-up in economic activity into earnings growth that is offsetting investor caution on high valuations. High frequency indicators suggest that domestic economic activity remained resilient in November and early December. The outlook for private consumption and investment is looking up, although relatively higher inflation in rural areas is muting spending in those regions. Net exports are restrained by the global slowdown. Agricultural and allied activities and contact-intensive services are leading the supply response, with industry on an uneven recovery. In response, capital flows to India are strengthening. Business and consumer confidence is turning up, and expectations of a better second half of 2022-23 relative to the first half are being reflected in forward-looking surveys. India’s resilience in the face of deteriorating external environment has been acknowledged elsewhere too3. The near-term outlook for the economy has been upgraded (see Section III), supported by domestic drivers. Overall domestic conditions are becoming conducive for a turnaround in private investment, and if inflation ebbs, private consumption will continue to firm up. In the World Bank’s view, “India’s exports are susceptible to a global growth slowdown and…the confluence of multiple challenges on the external front poses a challenge to India’s growth trajectory, but balanced policymaking, which factors in these trade-offs, will help India navigate global headwinds.” There is a growing sense that the coming decade will mark India’s ascent on to the world stage. It is in this context that India’s priorities and deliverables under its G20 presidency assume relevance. Reinvigoration of global policy cooperation to meet emerging challenges, and repairing the multiple fractures can position the global economy on a trajectory that fulfils the G20’s mandate of strong, sustainable, balanced and inclusive growth. Set against this backdrop, the remainder of the article is structured into four sections. Section II covers the rapidly evolving developments in the global economy. An assessment of domestic macroeconomic conditions is set out in Section III. Section IV encapsulates the financial conditions in India, while the last Section sets out concluding remarks. As we near the end of a tumultuous 2022, the outlook is overcast for 2023 with indications of weaker global growth, fraught with downside risks. Inflation is likely to moderate in 2023 from current levels, but it would remain well above targets in most economies. In its latest Economic Outlook released on November 22, 2022 the Organisation for Economic Co-operation and Development (OECD) has pegged global growth for 2023 at 90 basis points below the forecast for 2022. (Table 1). Incoming data suggest that global inflation may have peaked. Both producer price index (PPI) and consumer price index (CPI) based measures of inflation are cooling down in various economies, with a narrowing of the wedge between the two (Chart 1). The OECD has projected that CPI inflation in the G20 economies is set to ease to 6.0 per cent from 8.1 per cent in 2022. Geopolitical risks as well as tight supply demand balance in key commodities impart considerable uncertainty to the outlook. 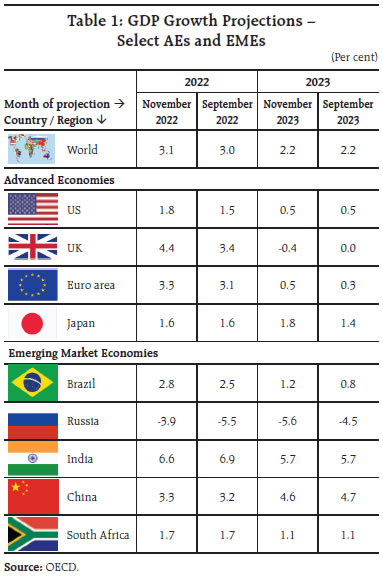 Nonetheless, expectations of a slower pace of monetary tightening have gained ground, lifting global stock and bond prices while restraining the US dollar’s rally. Against this backdrop, our model-based nowcast using all available GDP releases indicates that global GDP growth gathered some momentum in Q3:2022 after sequential contractions in preceding quarters (Chart 2). Among high frequency indicators, the global composite purchasing managers’ index (PMI) signalled a downturn for the fourth consecutive month in November, hitting a 29-month low. Both manufacturing output and service sector business activity fell at the fastest rate since June 2020. The global manufacturing PMI touched a 29-month low of 48.8 in November, remaining in contraction for the third successive month as the output of intermediate goods declined sharply (Chart 3).  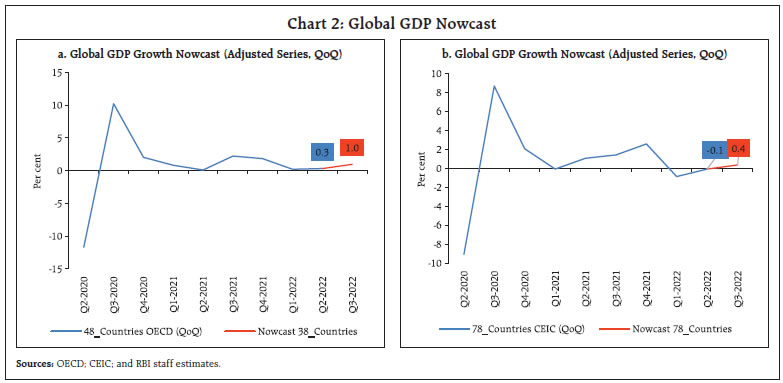 On a year-on-year (y-o-y) basis, world merchandise trade volume growth improved in September 2022 due to a favourable base effect (Chart 4a). Waning demand for vessels caused the Baltic Dry Index, a measure of shipping charges for dry bulk commodities, to slide down for the second successive month in November, but an uptick has occurred in the last week of November through early December (Chart 4b). The World Trade Organisation (WTO)’s, goods trade barometer fell in spite of an acceleration of merchandise trade volume, signifying weaker export orders, air freight and electronic components. PMI subindices corroborate the contraction in new export orders for the ninth successive month. 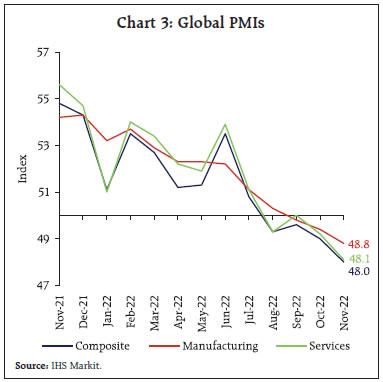 Global commodity prices remained range-bound in November and early December (Chart 5a). Crude oil prices traded at an average of US$ 91.1 per barrel in November and at around US$ 80 in early December over demand concerns. Brent crude prices reversed a large part of the price gain during the initial months of Ukraine war, falling by 40 per cent till December 13, 2022 from the peak of USD 133.89 per barrel recorded on March 8, 2022 (Chart 5b). The implementation of the European Union (EU)’s ban on Russian sea-borne oil starting December 5, the application of a price cap on Russian oil and the OPEC+ decision not to cut its oil production in the meeting held on December 4, 2022 has imparted uncertainty to the oil price outlook. Gold prices inched up in November and early December, driven by investment demand (Chart 5c). The Food and Agricultural Organisation (FAO) food price index4 registered its eighth consecutive monthly decline in November 2022 on account of a fall in prices of cereals, dairy and meat, offset by increase in prices of vegetable oils and sugar (Chart 5d).  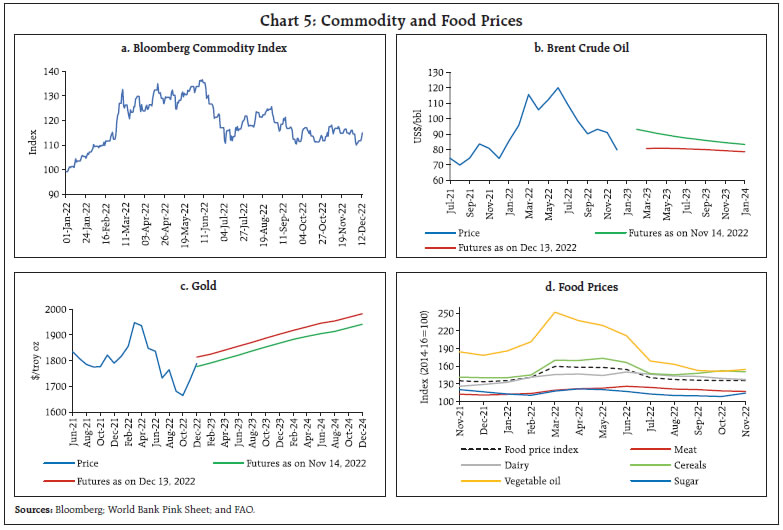  There are signs of inflation easing, especially amongst emerging market economies (EMEs). The US CPI inflation eased markedly to 7.1 per cent in November 2022 from 7.7 per cent in October. Inflaion based on the US personal consumption expenditure (PCE) index eased to 6.0 per cent (y-o-y) in October 2022 from 6.3 per cent in September (Chart 6a). In the Euro area, annual inflation slowed to 10.0 per cent in November 2022 from 10.6 per cent in October due to negative momentum in the cost of energy and services. In the UK, inflation edged down to 10.7 per cent in November 2022 from 11.1 per cent in October, led by transport subindex. Among the BRICS5 economies, inflation in Brazil eased to 5.9 per cent in November from 6.5 per cent in October. In Russia it eased to 12.0 per cent in November from 12.6 per cent in October. In China, inflation fell to 1.6 per cent in November vis-à-vis 2.1 per cent in October. In South Africa too inflation softened marginally to 7.4 per cent in November from 7.6 per cent in October (Chart 6b). Global equity markets continued to rally in November on expectations of less aggressive rate actions by the US Fed. The rebound was driven by the EMEs sub-index, which grew by 14.6 per cent, while the AEs sub-index ended 6.8 per cent higher than their levels in October (Chart 7a). In the bond market, 10-year G-sec yields softened across major AEs on signs of easing inflationary pressures. The 10-year US treasury yield fell by 44 basis points in November while the 2-year G-sec yield eased by 17 bps, thus intensifying the magnitude of yield curve inversion and suggesting looming signs of recession (Chart 7b). The US dollar, which reversed its rally in October, continued to lose strength in November and early December. Concomitantly, the MSCI currency index for EMEs gained momentum in November, rising 3.6 per cent as capital inflows resumed (Chart 7c & 7d). Central banks of most AEs and EMEs continued with monetary tightening, although the pace of tightening slowed. In December, the US Federal Open Markets Committee (FOMC) increased its target range for the federal funds rate by 50 bps, with projections showing that the benchmark rate would peak at 5.1 per cent in 2023 (Chart 8a). The Euro area and UK also raised their key rates in December by 50 bps each vis-à-vis 75 bps in their previous policies as central banks on both sides of the Atlantic saw the beginning of moderating inflation. Canada and Australia raised their policy rates by 50 bps and 25 bps, respectively, in December. New Zealand increased its policy rate by 75 bps in November. South Korea increased its policy rate by 50 bps in October, followed by a 25 bps hike in November. Israel went for 50 bps hike as compared with 75 bps hikes earlier. Japan has continued to diverge by maintaining an accommodative stance.   Most EME central banks have continued with policy tightening while a few others have paused (Chart 8b). South Africa, Philippines and Mexico announced rate hikes of 75 bps in their November meetings. Indonesia increased its policy rate by 50 bps in November. Peru and Thailand tightened by 25 bps in December and November, respectively. Chile held its rate unchanged for the first time in its December policy. Brazil and Russia in December and Hungary in November also kept their key rates unchanged. Turkey cut its rate by 150 bps in November while China continued with monetary accommodation.  OECD’s economic outlook released in November 2022 has noted that India is the only major economy that is likely to grow in excess of 5.5 per cent during 2023 and 2024.6 Our Activity Index, constructed by extracting the common trend underlying from a set of 15 high frequency indicators in a Dynamic Factor Model (DFM), remained above pre-pandemic levels despite some sequential moderation (Chart 9). Accordingly, our latest nowcast places real GDP growth at 4.3 per cent for Q3:2022-23 (Chart 10). Despite a marginal dip in momentum, high frequency indicators suggest that underlying economic activity remains strong. PMI manufacturing and PMI services recorded strong expansion in November, aided by domestic demand and increase in new orders. Business expectations in both manufacturing and services sectors remained at record levels, boosted by favourable underlying demand, and softening inflation. Our index of supply chain pressures remained below its historical average (Chart 11). 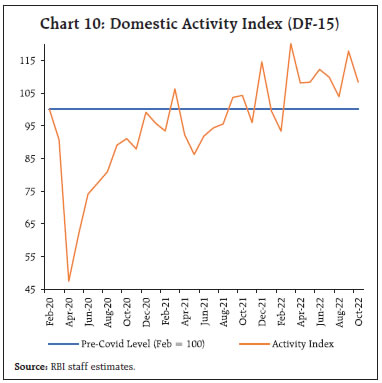 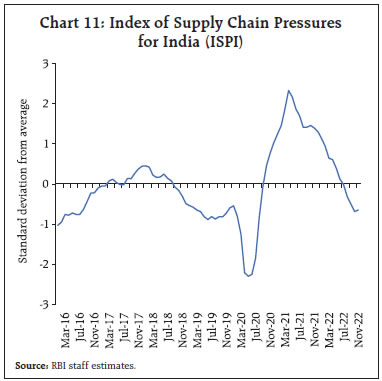 Aggregate Demand As per the quarterly estimates released by the National Statistical Office (NSO) on November 30, 2022 the Indian economy clocked a growth of 6.3 per cent in Q2:2022-23 in line with the Reserve Bank’s projection in the September 2022 policy resolution (Chart 12). Consequently, GDP surpassed its pre-pandemic level by 7.6 per cent. Private consumption registered an impressive growth of 9.7 per cent in Q2:2022-23. This was due to faster resumption of contact-intensive services, restoration of consumer confidence and high festival season spending after two consecutive years of muted growth. Furthermore, double digit growth in wages and salaries of firms provided an upward thrust to urban consumption. Government final consumption expenditure (GFCE) recorded a contraction of 4.4 per cent in Q2:2022-23. Buoyed by the government’s thrust on infrastructure, gross fixed capital formation (GFCF) registered a growth of 10.4 per cent in Q2:2022-23. This was also reflected in a sharp acceleration in proximate coincident indicators – steel consumption; and production and imports of capital goods. With the growth of imports outpacing that of exports, net exports contributed negatively to aggregate demand in Q2:2022-23 – the highest drag on aggregate demand from the external side since Q4:2012-13. 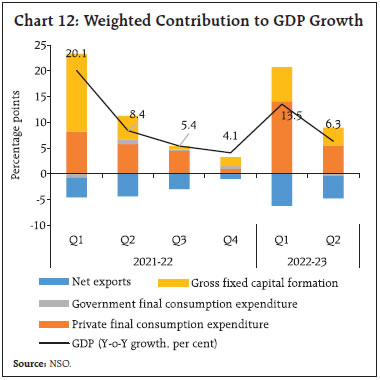 E-way bills generation breached the 80 million mark in November, led by an increase in movement of goods within states (Chart 13a). Toll collections strengthened both in volume and value terms, recording a series high of ₹4645.6 crore in November 2022 (Chart 13b). Fuel consumption accelerated in November on a low base of contraction a year ago. The eight-month peak in fuel consumption was led by increase in consumption of diesel as demand from the agriculture sector resumed post monsoon along with a pick-up in demand for transport (Chart 14a). Sales of automobiles registered growth in November on a low base of contraction a year ago. The momentum of sales eased, particularly for entry level segments, even as total sales volumes breached levels recorded in pre-pandemic February 2020 (Chart 14b). Retail sales of automobiles picked up further in November, rising above the 20 lakh units mark. Registrations of non-transport vehicles remained above the pre-pandemic level, and for transport vehicles it inched nearer to normalisation (Chart 14c). 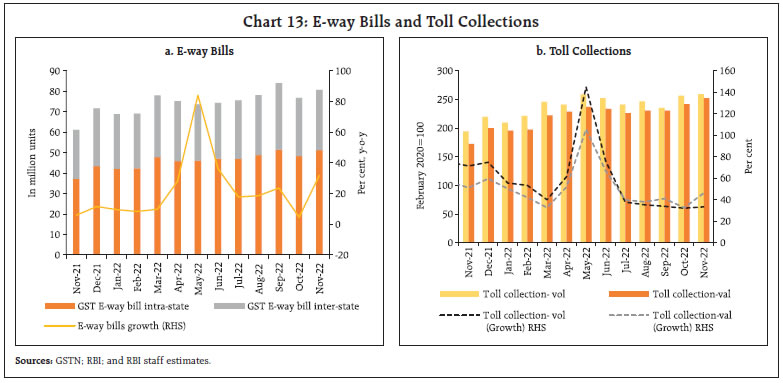  Rural demand reflected festive fatigue, with sales of tractors, two wheelers, motor cycles and three wheelers moderating from the previous month. The farm sector however, remained expansionary, with domestic sales of tractors recording growth, even as units sold slipped to a three-month low in November. Sales of two wheelers and motorcycles dipped below pre-pandemic levels, while three wheeler sales remained above the benchmark (Chart 14d). In the trade, hotels and transport sector, hotel occupancy rates declined to an eight month low of 57.2 per cent in October as the end of the festival season reduced corporate demand even as the revenue per available room and average room rates remained above 2019 levels for the seventh straight month (Chart 15). Sales of fast-moving consumer goods (FMCG) products declined in November over the previous month by 16.3 per cent as festival fatigue reduced demand. On a y-o-y basis too, demand contracted by 2.7 per cent.7 The decline in rural sales was steeper at (-) 17 per cent, while urban sales contracted by (-) 10.1 per cent over October 2022. As per the household survey of the Centre for Monitoring Indian Economy (CMIE), the all-India unemployment rate increased marginally to 8.0 per cent in November from 7.8 per cent in October 2022, led by an increase in urban areas (Chart 16). The rise in the unemployment rate was driven by an increase in the labour force participation rate (LFPR) to 39.6 per cent in November from 39.0 per cent in the previous month as the absolute number of employed workers was higher in both rural and urban areas. In terms of the organised sector employment outlook, the purchasing managers’ index (PMI) employment sub-index for both manufacturing and services remained in the expansion zone in November 2022, albeit with a sequential moderation (Chart 17). 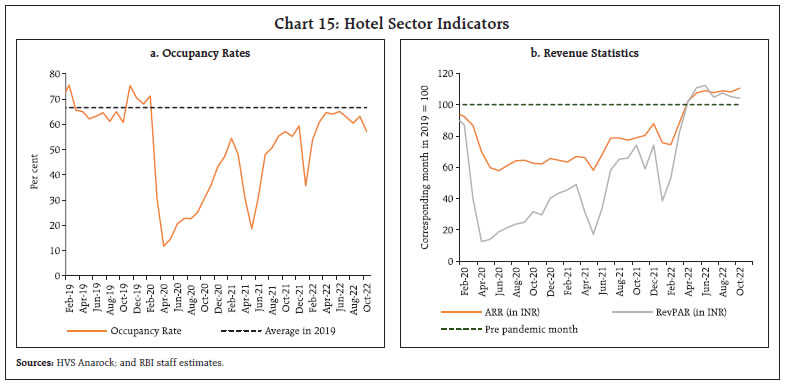  Demand for Mahatma Gandhi National Rural Employment Guarantee Act (MGNREGA) work in the rural sector increased sequentially, reflecting seasonal factors (Chart 18). However, on a y-o-y basis, it remained in contraction, indicating better job opportunities elsewhere as compared to a year ago.  India’s merchandise exports at US$ 32.0 billion, registered growth of 0.6 per cent (y-o-y) in November 2022, following a contraction of 12.1 per cent in October 2022. On a m-o-m basis, growth occurred in November 2022 after four successive months of contraction (Chart 19). 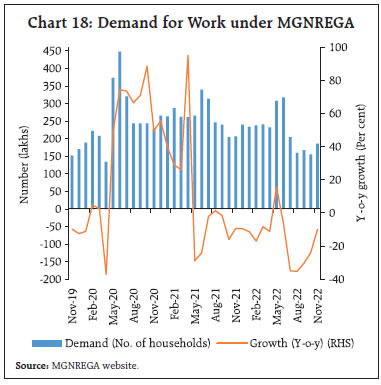 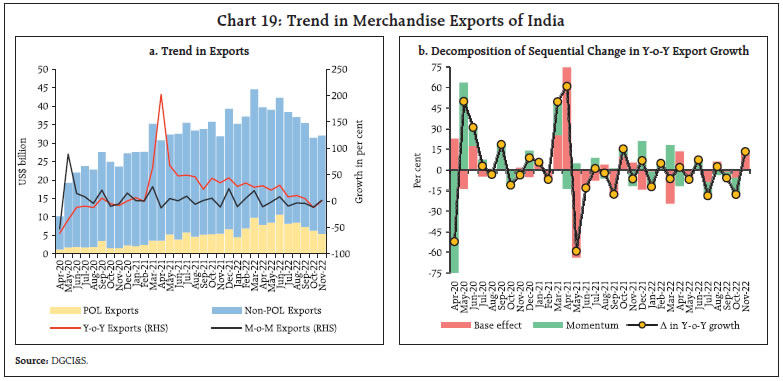 Among the 30 major principal export items, 15 items accounting for 33.1 per cent of total exports registered growth (y-o-y) in November 2022. Electronics and drugs and pharmaceuticals supported growth in November 2022 while cotton yarn fabrics, petroleum products, and man-made yarn pulled exports down (Chart 20). Non-oil exports at US$ 26.6 billion grew by 1.1 per cent (y-o-y) in November 2022 after three consecutive months of contraction. After twenty successive months of growth, exports of petroleum and its products at US$ 5.4 billion contracted by 1.8 per cent (y-o-y) in November 2022 (Chart 21). Among other factors, maintenance shutdown in some export-oriented refineries may have limited the petroleum exports. Engineering exports at US$ 8.1 billion declined for the fifth consecutive month in November 2022 (-0.3 per cent y-o-y), however, the pace of decline has slowed down significantly. As per component-wise details for which data is available up to October 2022, iron and steel exports fell by 40.2 per cent y-o-y in April-October 2022. On the other hand, overall engineering exports registered a contraction of 2.2 per cent during the same period, partially reflecting the impact of export duty levied on certain items of iron and steel in May 2022 (Chart 22). The withdrawal of export duties in November 2022 is expected to improve competitiveness in this category and provide a fillip to exports8, although global demand conditions have weakened. Global steel demand is expected to fall by 2.3 per cent in 2022 and grow at a moderate rate of 1.0 per cent in 2023, as per the World Steel Association.9 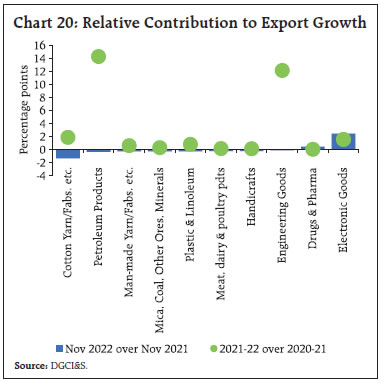 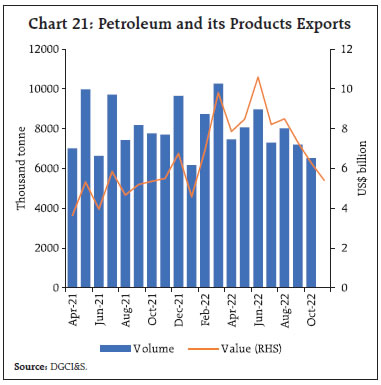 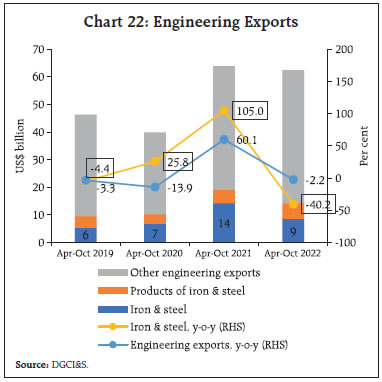 Electronics goods exports at US$ 1.9 billion grew for the twentieth successive month in October 2022, driven primarily by telecom instruments (Chart 23a). Exports to major destinations such as the UAE, US, Netherlands and UK have been rising over the years (Chart 23b). The UAE accounts for more than one-fourth of India’s telecom instruments exports. The National Policy on Electronics, 2019 and the Production Linked Incentive (PLI) scheme for electronics and IT hardware have given a boost to India’s electronics exports. 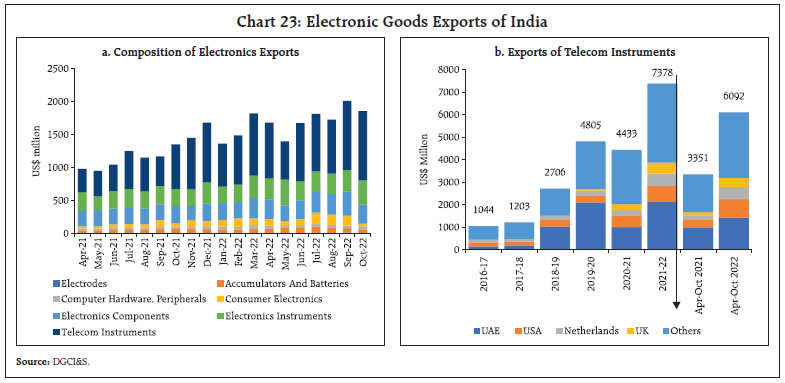 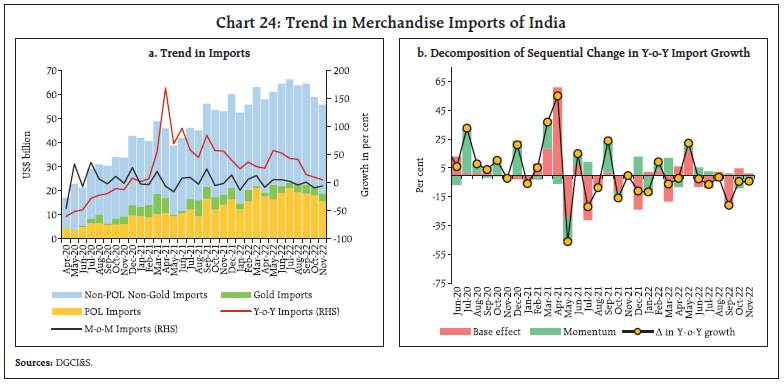 India’s imports at US$ 55.9 billion, at a ten-month low level, continued to decelerate and registered a growth of 5.4 per cent in November 2022 (Chart 24). Commodity-wise, items accounting for 84.0 per cent of total imports recorded y-o-y growth in November. Petroleum products, iron and steel and machinery contributed the most to import growth whereas gold, metalliferous ores and other minerals and vegetable oil pulled imports down (Chart 25). Petroleum imports, however, declined on a sequential basis for the fourth successive month to US$ 15.7 billion in November 2022 from US$ 21.1 billion in July. As per disaggregated data which is available up to October 2022, imports of select petroleum products (primarily motor spirit and naptha) increased by 14.6 per cent in October 2022 in volume terms due to domestic shortfall of refined petroleum products caused by refinery turnarounds (Chart 26). On a sequential basis, Russia’s share in India’s crude imports in volume terms remained at around 25 per cent while in value terms, it increased from 22.6 per cent in September to 23.1 per cent in October 2022. 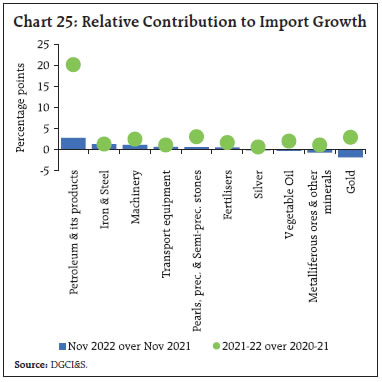  Gold imports at US$ 3.2 billion continued to decline for the fifth successive month in November 2022. As per the World Gold Council, higher inflation in rural India is expected to have dampened gold demand in Q3:2022-23 compared with a year ago. India’s fertiliser imports at US$ 1.7 billion grew in value terms for the thirteenth successive month in November 2022. As per disaggregated data, an increase in volume terms was registered after five months of contraction, driven by manufactured fertilisers, primarily driven by imports from Morocco and Russia (Chart 27). The merchandise trade deficit moderated to US$ 23.9 billion in November, a five-month low. Commodity-wise, petroleum products continued to drive the trade deficit (Chart 28). Apart from crude oil, rising prices of vegetable oil, coal and fertilisers contributed to ballooning of the trade deficit. The latest ‘below trend’ reading on the Goods Trade Barometer of the World Trade Organisation (WTO) for September 2022 projects a worsening of the global trade outlook. A silver lining is the India-Australia Economic Cooperation and Trade Agreement which will come into effect from end-December 2022. 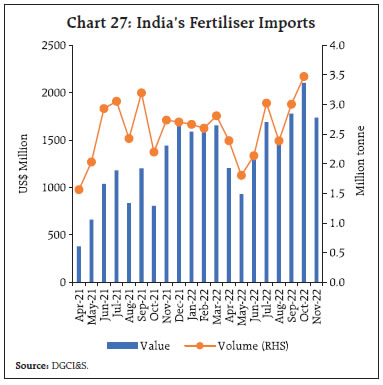 During April–October 2022, the gross fiscal deficit of the central government stood at 45.6 per cent of budget estimates (BE), higher than in the corresponding period of the previous year. The thrust on capital spending continued with a year-on-year (y-o-y) growth in capital outlay of 56.7 per cent, Revenue expenditure recorded muted growth of 10.2 per cent, leading to a marked improvement in the quality of spending during the period (Chart 29).  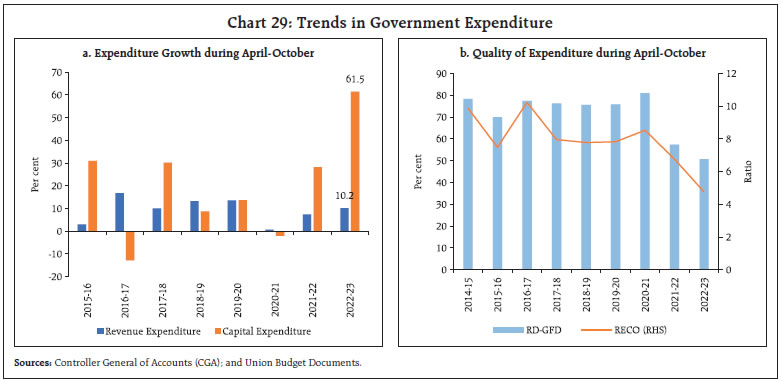 On the receipts side, gross tax revenue recorded a growth of 18.0 per cent, driven by an increase in collections under all major tax heads except excise duty. This is attributable to the cut in excise duty on petrol and diesel in May 2022. Direct and indirect taxes registered a y-o-y growth of 25.5 per cent and 11.1 per cent, respectively (Chart 30). On the other hand, non-tax revenues contracted by 13.6 per cent during April-October. Non-debt capital receipts recorded an increase of 81.0 per cent, led by the successful initial public offer (IPO) of the Life Insurance Corporation (LIC). GST collections (Centre plus states) in November 2022 stood at ₹1.46 lakh crore, recording a growth rate of 11 per cent over the corresponding month of the previous year. Thus, GST revenues have surpassed ₹1.4 lakh crore for the ninth consecutive month (Chart 31). Aggregate Supply Aggregate supply, as measured by the gross value added (GVA) at basic prices, expanded by 5.6 per cent in Q2:2022-23 (Chart 32). While agriculture and services sectors exhibited robust growth, the industrial sector recorded a sharp contraction owing to intensification of input cost pressures. 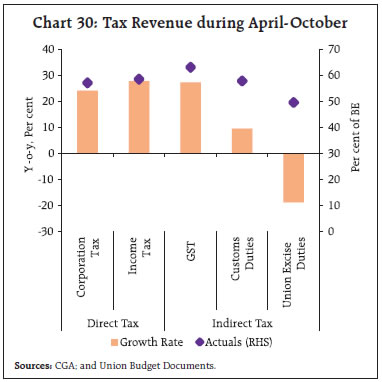 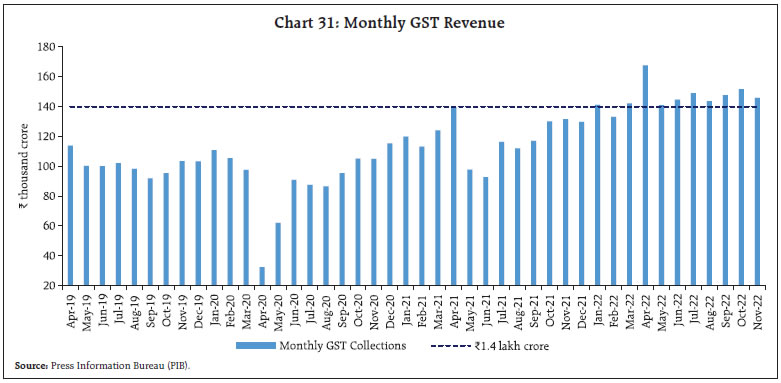 Within industry, manufacturing registered a contraction of 4.3 per cent in Q2:2022-23. Higher expenditure outpaced sales growth, thereby exerting pressure on operating profit margins. The services sector, the mainstay of overall GVA growth, registered a broad-based growth of 9.0 per cent during Q2:2022-23. An uptick was recorded in activity in trade, hotels, transport, communication and services related to broadcasting; and financial, real estate and professional services. 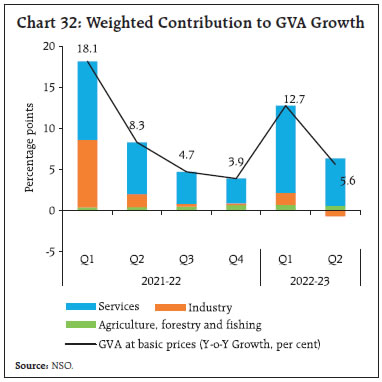 The agriculture and allied sector is poised to perform well in the ensuing Rabi season. Despite a slow start, Rabi sowing has picked up pace, supported by congenial soil moisture, sufficient fertiliser availability and elevated open market prices. Rabi acreage, at 526.27 lakh hectares as on December 9, 2022 was 15.0 per cent higher than a year ago, driven by higher acreage under wheat (25.4 per cent) and oilseeds (8.6 per cent) (Chart 33a), and supported by a hike in minimum support prices (MSPs) for these crops in the range of 5.5 to 7.9 per cent. Furthermore, as on December 8, 2022 the total live storage in 143 major reservoirs was higher at 81 per cent of the full reservoir level (FRL) as compared to that of last year (78 per cent of FRL) and the 10-year average (68 per cent of FRL) (Chart 33b). 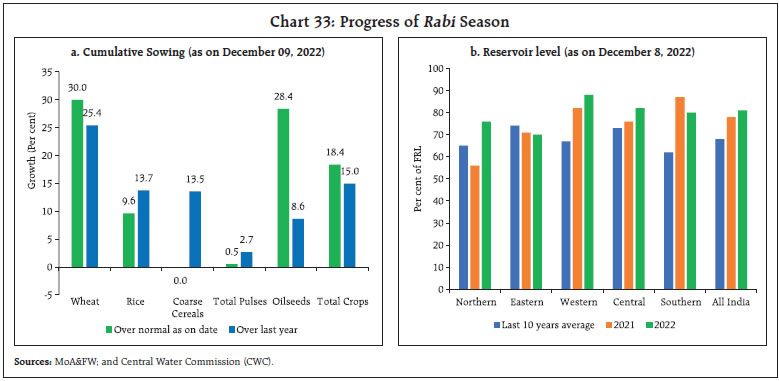 Robust Rabi sowing was supported by easy availability of fertilisers compared to the requirement up to November 16, 2022 (Chart 34).10 The supply of fertilisers at affordable prices to farmers was ensured through higher fertiliser subsidies, notwithstanding the rise in international prices. Moreover, open market prices of major Rabi crops like wheat, masur, rapeseed and mustard ruling above the announced MSPs helped in increased acreage response from farmers. 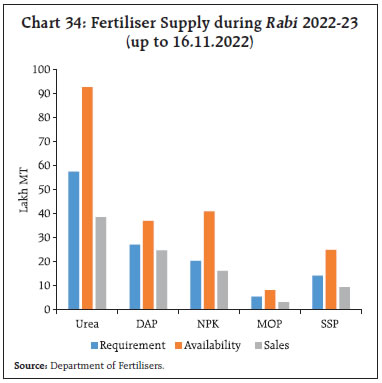 The manufacturing purchasing managers’ index (PMI) accelerated to 55.7 in November from 55.3 a month ago, supported by a strong increase in production and new orders. This was accompanied by an increase in hiring and upbeat future sentiments. Business confidence in terms of expectations of future output touched an eight-year high at 67.2 in November (Chart 35a). The services PMI recorded further expansion, with the business expectations index surpassing its long run average and increasing to its highest mark since January 2015. This upturn reflected domestic demand and sustained increase in new business output (Chart 35b). A cross-country comparison shows India had the highest PMI readings among major economies in November (Chart 35c & d). 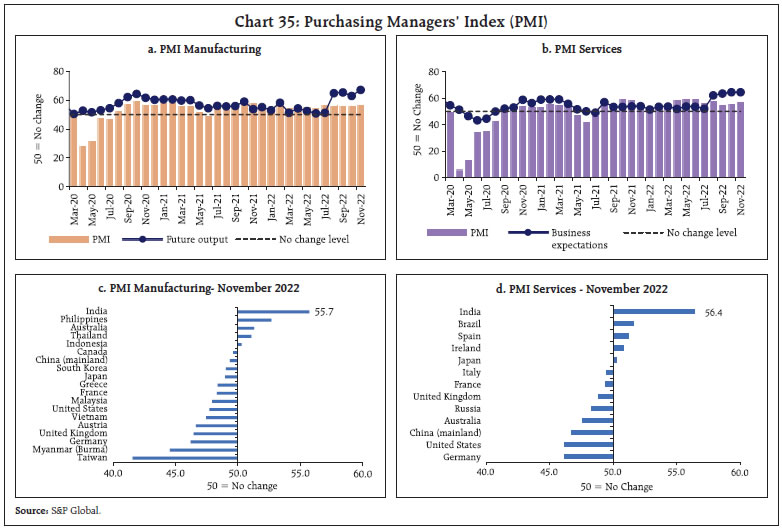 In the services sector, transport indicators recorded moderation with railway freight traffic earnings registered expansion at 5.2 per cent in November as compared to 6.2 per cent a year ago (Chart 36a). Cargo traffic at major ports remained subdued in November due to high freight cost and volatility in international trade (Chart 36b). 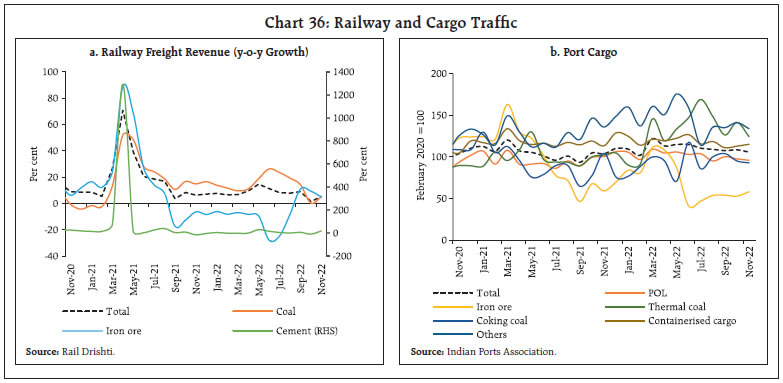 In the construction sector, cement production and steel consumption reflected a mixed picture, as steel consumption showed double digit y-o-y growth for the fifth consecutive month in November 2022 (Chart 37). Cement production declined y-o-y over a high base in October 2022 owing to the festivals and prolongation of monsoon season. Passenger footfalls picked up in November over the previous month for both domestic and international passengers. Air cargo continued to record a m-o-m contraction, both domestic and international (Table 2). In December (up to December 11, 2022), activity in both passenger and cargo segments increased on a m-o-m basis.  A number of key initiatives and developments at the regional level which contribute to building up the growth potential of the economy is worth noting. As a part of Atmanirbhar Bharat in the agricultural sector, the Government of Assam has launched the Assam Millet Mission for raising nutrition quotient and doubling farmers’ income. With a view to promoting crop diversification and increasing the production of non-paddy crops and high value crops, the Government of Odisha has launched a new Crop Diversification Programme in 2022-23. Kerala is moving towards meeting its target of setting up one lakh MSMEs in the current financial year, with more than 80,000 MSMEs getting registered in the first seven months of 2022-23. The Asian Development Bank (ADB) approved a US$350 million loan to improve the connectivity of key economic areas in Maharashtra. The Telangana state government opened 8 medical colleges. The Uttar Pradesh Government launched its Industrial Investment and Employment Promotion Policy 2022 to actualise the state’s goal of becoming a one trillion dollar economy.  Inflation The provisional data released by the National Statistical Office (NSO) on December 12, 2022, showed that inflation, as measured by y-o-y changes in the all-India consumer price index (CPI), moderated to 5.9 per cent in November from 6.8 per cent in October. The easing was primarily driven by the sharp moderation in food inflation (Chart 38a and 38b). The index declined by 11 bps month-on-month (m-o-m), which along with a favourable base effect (month-on-month change in prices a year ago) of 73 bps, resulted in a fall in headline inflation by around 90 bps between October and November. The m-o-m decline in prices was of the order of 72 bps within the food and beverages group, which more than offset the positive price momentum of 44 bps in the fuel group and 42 bps in the core (excluding food and fuel) category. Among major sub-groups, vegetables prices declined by 8.3 per cent m-o-m whereas egg prices increased 6.1 per cent (Chart 39). The sharp softening in CPI food inflation to 5.1 per cent in November from 7.1 per cent in October came from a favourable base effect of 119 bps along with a decline in price momentum of 72 bps. In terms of sub-groups, inflation softened the most in respect of vegetables (largest decline in inflation since December 2020), followed by fruits. On the other hand, inflation edged up for cereals, prepared meals, protein-based goods (pulses, eggs, meat and fish, and milk) and spices. Edible oils registered a lower rate of deflation, despite a sequential pick-up in prices (Chart 40). 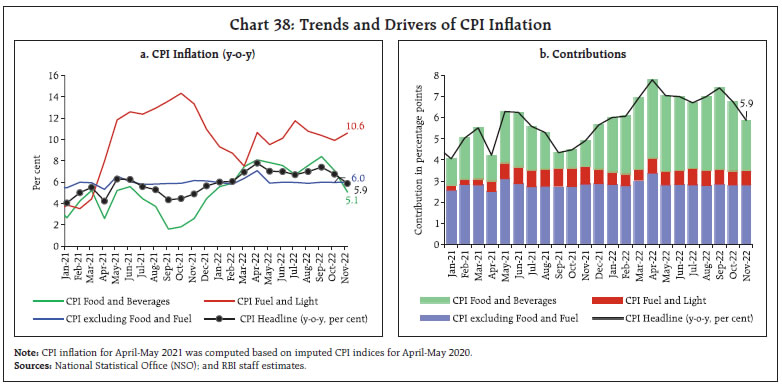 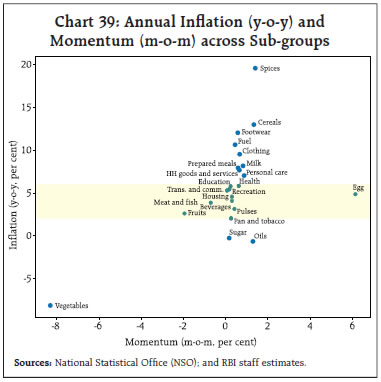 Inflation in the fuel and light group edged up to 10.6 per cent in November from 9.9 per cent in October. The increase was mainly led by electricity prices (on a year-on-year basis) emerging out of deflationary zone after a year. While inflation for liquified petroleum gas (LPG) remained steady, kerosene (Public Distribution System) inflation continued to soften for the fourth consecutive month. The fuel group with a weight of 6.8 per cent in the CPI basket contributed 12.1 per cent of headline inflation in November. CPI core inflation continued to remain steady at 6.0 per cent for the third consecutive month. While inflation in sub-groups such as in pan, tobacco and intoxicants, household goods and services, health, and transport and communication registered an increase, recreation and amusement, clothing and footwear sub-groups witnessed some moderation. Inflation in key services such as education, housing and personal care and effects remained steady. In terms of regional distribution, rural inflation at 6.09 per cent was higher than urban inflation (5.68 per cent) in November 2022. Among the states, only Mizoram experienced inflation in excess of 8 per cent whereas Chhattisgarh, Delhi, Goa, Himachal Pradesh, Manipur and Meghalaya recorded inflation below 4 per cent (Chart 41).  High frequency food price data for December so far (December 1-12) from the Department of Consumer Affairs (DCA) point to an increase in wheat and atta, and rice prices. Among key vegetables, prices of onions, potatoes and tomatoes softened. Pulses prices registered a broad-based decline except for moong (Chart 42). Retail selling prices of petrol and diesel in the four major metros remained steady in December so far. While LPG prices were kept unchanged, kerosene prices marginally decreased in December (Table 3). 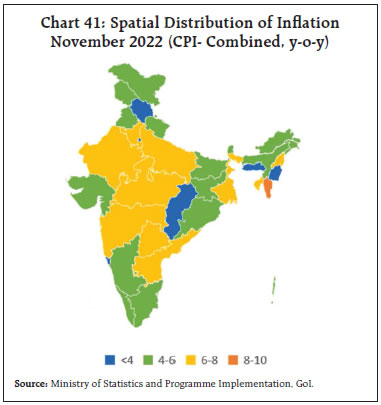  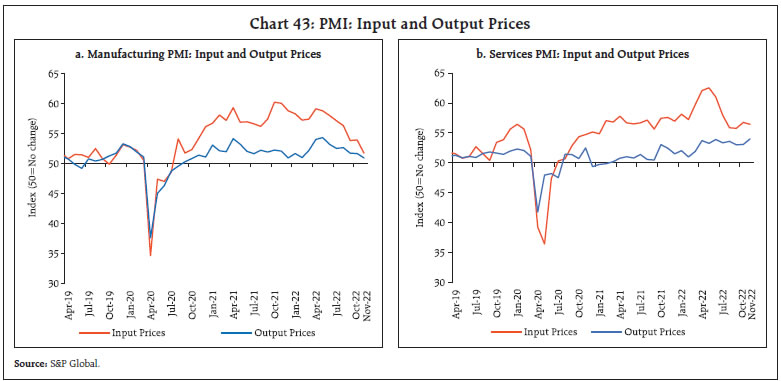 Input cost pressures, as reflected in the PMIs, increased across manufacturing and services in November 2022, with cost conditions turning more adverse in services. Selling prices also edged up across manufacturing and services, with the services sector registering price increases higher than the long-run average. Manufacturing firms, on the other hand, registered muted output price increases (Chart 43). The all India house price index (HPI) recorded a moderate increase of 0.4 per cent in Q2:2022-23 on a sequential (q-o-q) basis and 4.5 per cent rise on an annual (y-o-y) basis during Q2:2022-23 (Chart 44). 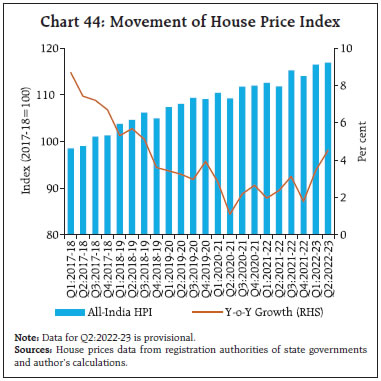 The MPC delivered a widely anticipated rate hike of 35 bps in the December 2022 monetary policy meeting while retaining the stance of withdrawal of accommodation. At the same time, the Reserve Bank remains watchful of evolving liquidity conditions and stands ready to inject liquidity, if required, to meet the productive requirements of the economy. This, however, would be contingent upon a durable turn in the liquidity cycle when banks would move away from holding large balances under the SDF and variable rate reverse repos. Looking ahead, liquidity conditions are likely to draw comfort from higher government spending, moderation in currency leakage and renewed portfolio flows. As part of the graduated move towards normal liquidity operations, market hours were restored - from 9.00 am to 5.00 pm - in respect of call/notice/term money, commercial paper, certificates of deposit and repo in corporate bond segments of the money market as well as for rupee interest rate derivatives. Higher government spending and the return of foreign portfolio investor (FPI) inflows eased liquidity conditions in the banking system in the second half of November through December 11, 2022. Consequently, average daily absorption under the liquidity adjustment facility (LAF) increased to ₹1.9 lakh crore during November 15 through December 11, 2022 from ₹1.3 lakh crore during mid-October to November 14 (Chart 45). Of the daily average surplus liquidity during November 15 to December 9 2022, ₹1.5 lakh crore has been absorbed through the overnight standing deposit facility (SDF), while the remaining was mopped up through variable rate reverse repo (VRRR) auctions. On a net basis (adjusted for repo and marginal standing facility (MSF)), liquidity absorption averaged ₹1.0 lakh crore during the period under review, increasing from ₹0.25 lakh crore in the preceding period. As liquidity conditions improved, banks’ recourse to the MSF moderated to an average of ₹0.03 lakh crore during the second half of November through December 11, 2022 from ₹0.18 lakh crore during mid-October to November 14. The two fortnightly VRRR auctions of ₹1.5 lakh crore each on November 18 and December 2 received a lukewarm response of ₹52,065 and ₹31,234 crore, respectively. Banks tended to avoid locking in large amounts before the policy announcement in anticipation of rate hikes. 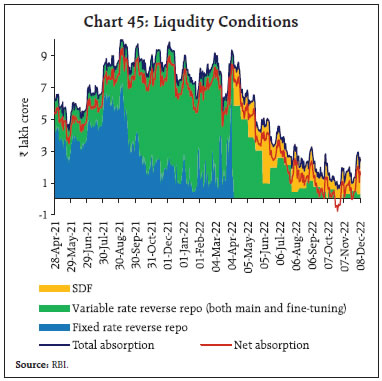 Reflecting the improvement in systemic liquidity, the weighted average call rate (WACR) eased to 5.96 per cent (on an average) during mid-November to December 11 as compared to 6.03 per cent during late October to mid-November 2022 (Chart 46a). In tandem, rates in the collateralised segment also softened, with triparty and market repo rates trading on average 10 bps each, respectively, below the policy repo rate. Across the term money segment, rate on 3-month treasury bill (T-bill), 3-month certificates of deposit (CDs) and 3-month commercial paper (CPs) traded 17 bps, 64 bps and 102 bps, respectively, above the MSF rate (Chart 46b). The average risk premia in the money market (measured as the spread of 3-month CP rate minus 91-day treasury bill rate) at 84 bps during November 15-December 9 was similar to 88 bps during the period October 15-November 14, 2022 reflecting stable funding conditions in the money market. In the primary market, fund mobilisation through CD issuances has been robust at ₹3.96 lakh crore during the year so far (up to December 2), higher than ₹0.78 lakh crore for the corresponding period a year ago. This reflects banks’ additional demand for funds to meet the funding gap between buoyant credit offtake and relatively modest deposit growth. On the other hand, CP issuances have declined to ₹9.3 lakh crore during the year so far (up to November 30) from ₹14.1 lakh crore for the corresponding period a year ago, as the appetite for bank credit improved. 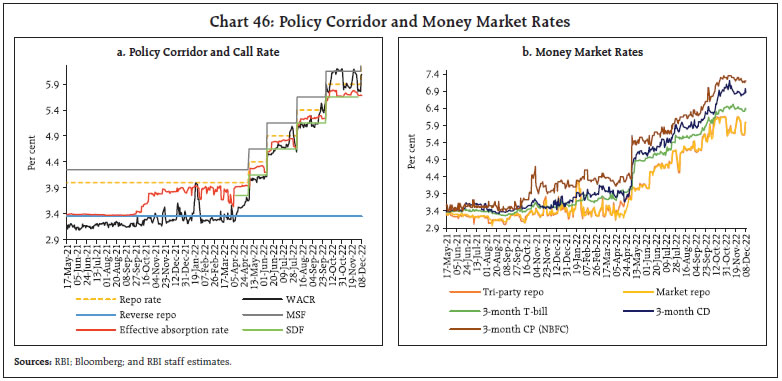 In the fixed income market, bond yields extended a softening bias in tandem with the easing of US treasury yields and the decline in international crude oil prices. The rally in the bond market was fuelled by the moderation of inflation in India and the US, coupled with a growing consensus over a slower pace of rate hikes. The Indian benchmark yield on the 10-year G-sec softened from a high of 7.51 per cent at the close on October 21 to 7.30 per cent on December 9, 2022 (Chart 47a). In response to the monetary policy announcement on December 7, the yield on the 10-year G-sec hardened intermittently before closing only 2 bps higher than the previous day’s close at 7.27 per cent. The muted reaction in the bond market suggests that the action was largely priced in by market participants. Across the curve, G-sec yields declined sharply, particulary for the short and long-end segment, even as the mid-segment registered a more modest decline (Chart 47b). While long-term yields have been influenced by global factors during the current policy tightening cycle, domestic policy measures seem to have a larger bearing on short-term rates. Following G-sec yields, corporate bond yields too generally softened, while risk spreads exhibited mixed movements across the rating spectrum (Table 4). Fund raising through corporate bond issuances jumped to ₹76,563 crore during November 2022 from ₹36,751 crore in October 2022. Softening rates on corporate bond papers bode well for issuances as the demand for funds is expected to stay robust as growth gathers momentum.  Reserve money (RM) excluding the first-round impact of change in cash reserve ratio (CRR) rose by 7.7 per cent on a y-o-y basis as on December 2, 2022 (7.9 per cent a year ago) (Chart 48). Currency in circulation (CiC) – the largest component of RM – recorded a growth of 8.0 per cent (7.6 per cent a year ago). Money supply (M3) grew by 8.9 per cent as on November 18, 2022 (9.5 per cent a year ago), primarily driven by its largest component – aggregate deposits with banks, which grew by 9.1 per cent (9.8 per cent a year ago). Scheduled commercial banks’ (SCBs’) credit has registered double digit growth since April 2022 and stood at 17.2 per cent as on November 18, 2022 (7.0 per cent a year ago).  In response to the policy rate hike of 190 bps, SCBs have increased their 1-year median marginal cost of funds-based lending rate (MCLR) by 95 bps during the period May to November 2022. The magnitude of transmission to weighted average lending rates (WALR) on fresh and outstanding rupee loans has further improved to 117 bps and 63 bps, respectively, during May-October 2022. The weighted average term deposit rate (WADTDR) on outstanding rupee deposits has recorded an increase of 46 bps during the same period (Table 5). With the ongoing growth in credit demand surpassing SCBs’ deposit growth since February 2022, major banks have hiked their deposit rates. Banks have come up with various special deposit schemes for different tenors with comparably higher rates than the regular schemes to attract more retail deposits. The median term deposit rates on fresh retail deposits (card rates) of SCBs increased by 67 bps between May and November 2022. The extent of pass-through to deposit rates has been higher for longer tenor maturities, with the highest being for 1-3 years tenors (Chart 49).  Amidst bouts of volatility, domestic equity markets touched a string of new highs during November, supported by rising expectations that domestic inflation may have peaked. Higher foreign portfolio investor (FPI) flows amidst improved risk sentiments and a less hawkish US Fed also helped the markets. During the first half of December, markets have moderated amid increased uncertainty regarding future Fed policy path following stronger-than-expected US payrolls data. Overall, the BSE Sensex increased by 2.4 per cent since the start of November to close at 62,182 on December 09, 2022. Prior to the fresh peak of 63,284 reached on December 1, 2022, the Sensex had achieved another all-time high of 61,766 last year on October 18, 2021 which was aided by the gradual reopening of the world economy after the tapering of the delta wave of the COVID-19 pandemic and rising vaccination rates. Since then, inflationary concerns, aggressive monetary tightening, and the raging geopolitical conflict in Ukraine have halted the rally in the Sensex. A closer comparison of the two peaks shows that the current peak is distinguished by lower expected volatility (VIX) and relatively moderate valuation multiples (Chart 50). Furthermore, the current peak has been accompanied by underperformance of the broader indices (Chart 51a). Similarly, institutional investor activity highlights the increasing prominence of net domestic institutional investor (DII) flows over those of FPIs (Chart 51b). The trajectory of rising retail participation in equity markets has remained resilient, gauged by the rising number of demat accounts which reached 10.6 crore in November 2022. On a sectoral basis, the capital goods sector yielded the highest returns during the six-month period preceding the current peak, highlighting the improvement in investment sentiments. Furthermore, Bankex index returns have surged on encouraging earnings, higher credit growth and sound regulatory parameters (Chart 52). One of the key differences between the two peaks has been the contrast in the monetary policy outlook in advanced economies. During the previous peak, the implied fed funds rate indicated a tighter monetary policy going forward (Chart 53a). This prognosis materialised, with the federal funds rate rising 375 bps cumulatively to 3.75-4.0 per cent on November 1, 2022 and impacting equity returns globally. During the current period, however, the implied federal funds rate is expected to peak in mid-2023, indicating a potential end to the rate hike cycle (Chart 53b).  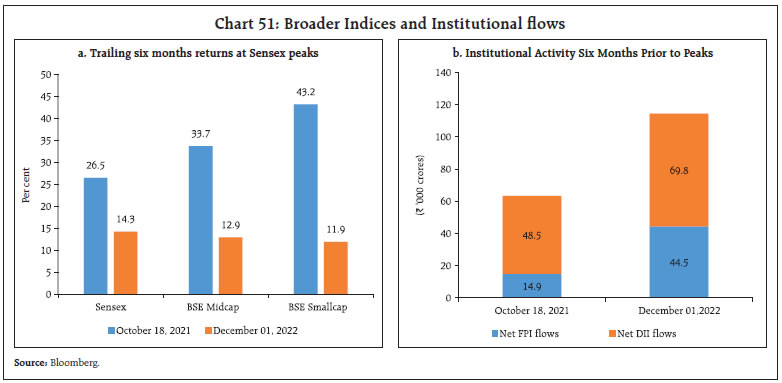 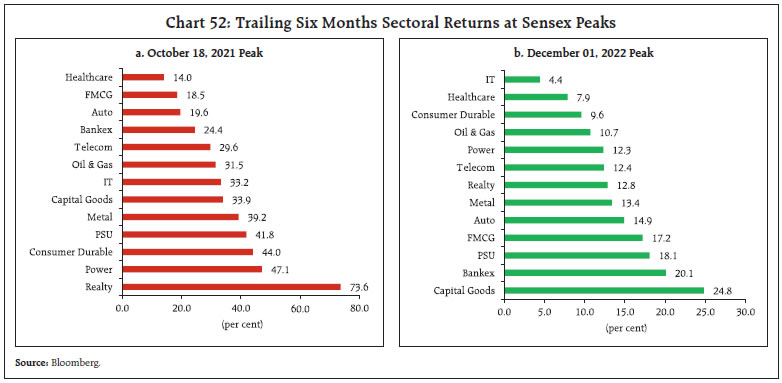 Gross inward foreign direct investment (FDI) moderated to US$ 44.2 billion during April-October 2022 from US$ 48.6 billion a year ago (Chart 54). Net FDI, however, increased to US$ 22.7 billion during this period from US$ 21.3 billion a year ago, mainly due to a decline in outward FDI by India. The majority of FDI equity inflows was received by manufacturing, retail and wholesale trade, financial services, computer services and communication services during April-October 2022. Singapore, Mauritius, and the US were major source countries of FDI during this period. FPIs remained net purchasers in the Indian markets for the second month in succession amidst expectations of slowdown in the pace of rate hikes by the US Fed, softening crude oil prices, and steady macroeconomic performance of the domestic economy. Net FPI flows to India were to the tune of US$ 4.7 billion in November 2022, mainly in the equity market (Chart 55). However, in December 2022 (up to 13th), Indian markets witnessed FPI outflow of US$ 0.3 billion. During November 2022, financial services, oil, gas and consumable fuels, and information technology sectors attracted the bulk of FPI investment in equity market. According to Institute of International Finance (IIF), Indian markets received more FPI investment than other emerging market economies (EMEs), except China and Taiwan, in November 2022. 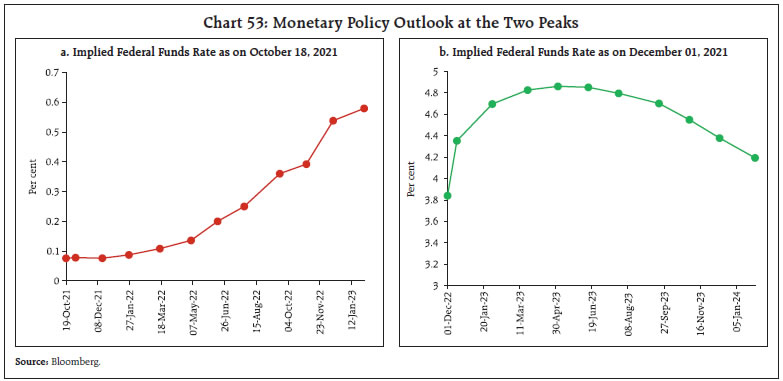 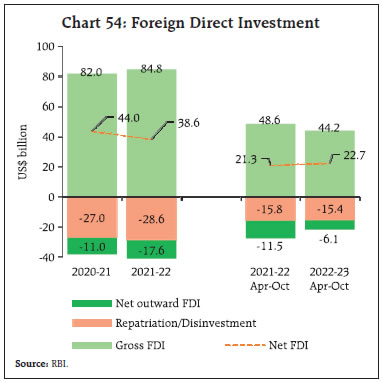 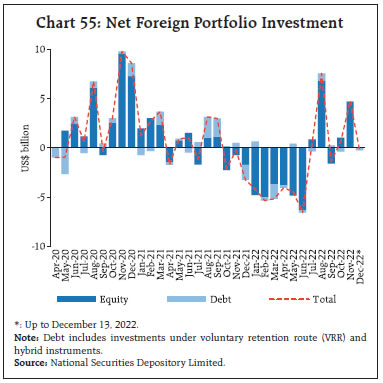 External commercial borrowing (ECBs) registrations during April-October 2022 stood at US$ 12.4 billion. Net ECB inflows, however, were negative as principal repayments (US$ 14.3 billion) exceeded gross disbursements (US$ 12.3 billion) (Chart 56). The end use pattern of the ECBs revealed more funds intended for on-lending/sub-lending, followed by funds raised for refinancing of earlier ECBs and for new projects (Chart 57). Major global benchmark rates, viz., the London interbank offer rate (LIBOR) and the secured overnight financing rate (SOFR) have increased by 301 bps and 277 basis points (bps), respectively, during April-October 2022. The rise in overall cost of ECB loans, however, was relatively less as the weighted average interest rate spread of ECBs over the benchmark interest rate was limited to 170 bps during April-October 2022 (193 bps during Apr-October 2021) (Chart 58). 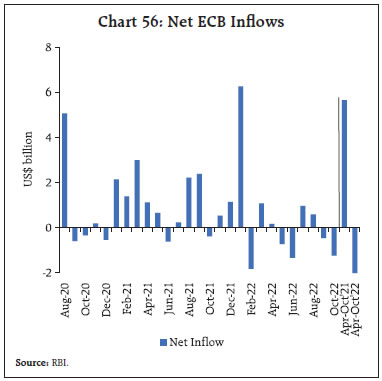  India’s foreign exchange reserves stood at US$ 564.1 billion as on December 9, 2022 and covered 9.2 months of imports projected for 2022-23 (Chart 59). The reserves have increased by US$ 31.4 billion since end September 2022. 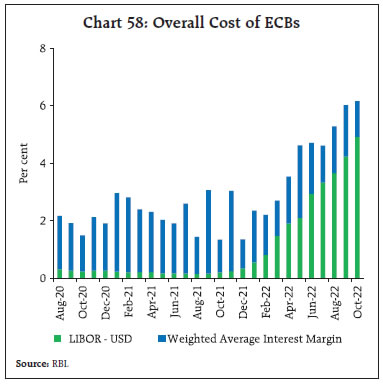 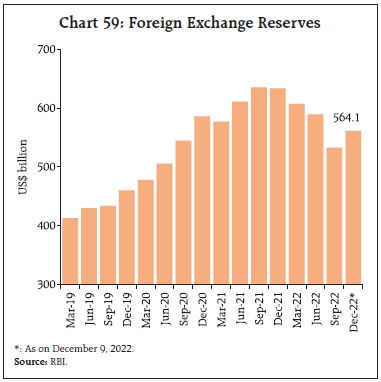 In the foreign exchange market, the Indian rupee (INR) appreciated by 0.6 per cent in November 2022, amidst weakening of the US dollar, softening crude oil prices and net FPI inflows. The INR appreciation was modest compared to most of the other EME currencies (Chart 60). 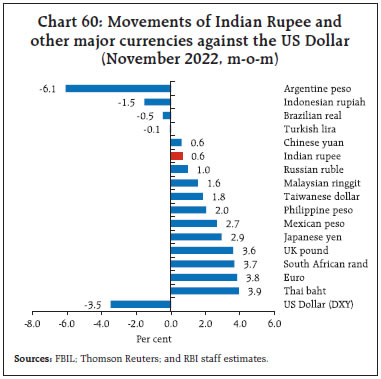  In terms of the 40-currency real effective exchange rate (REER), the INR depreciated by 0.6 per cent in November 2022 (m-o-m) (Chart 61). Payment Systems In November, digital transactions across payment modes built upon their robust performance during the festival season in October (Table 6). Retail transactions grew impressively owing to positive consumer sentiments11 and a high-spirited wedding season.12 Bharat Bill Payment System (BBPS) transactions grew steadily on the back of loan repayments and FasTag segments. Transactions in loan repayments doubled, which is indicative of reviving household finances. This is corroborated by the strong growth observed in the National Automated Clearing House (NACH) debit transactions related to inter alia loan repayments, insurance premia and investment in mutual funds. The growth (y-o-y) in the Unified Payments Interface (UPI) was spearheaded by a rise in Person-to-Merchant (P2M) transactions in October and November. This growth in P2M transactions with a high transaction volume under merchant categories like groceries and supermarkets, restaurants, departmental stores, drug stores and pharmacies signals increasing usage of the UPI for day-to-day purchases. In order to enhance the ease of making payments concerning e-commerce and investments in securities, the Statement on Developmental and Regulatory Policies on December 7, 2022 announced that the capabilities in UPI will be further augmented by introducing a single-block and multiple-debits functionality. Also, the scope of Bharat Bill Payment System (BBPS) is being expanded to include additional categories of payments and collections, both recurring and non-recurring, and for all category of billers (businesses and individuals).  The Reserve Bank launched the first pilot of the retail digital rupee (e₹-R) on December 1, 2022 covering select locations in a closed user group.13 The e₹-R will provide cash-like trust, safety and settlement finality while allowing users to transact digitally. The Payments Council of India14 launched ‘Project Pratima’, an initiative aimed at standardising icons across payment apps and platforms to enhance ease of use for consumers.15 V. Conclusion As we turn the page on a turbulent year with 2022 drawing to a close, it is worthwhile dialling back to various monthly editions of the State of the Economy (SoE) during the year and the milestones they were sentinel to. It was an eventful journey – the world and India confronted daunting challenges in succession, with resilience and hope. In January 2022, Omicron’s tsunami threatened to derail the path of recovery, but we assessed that Omicron may turn out to be more of a flash flood, reposing our faith on brightened near-term prospects. In February, we observed with cautious optimism that economic activity in India was recouping from a brief spell of moderation. The Union Budget for 2022-23 set the tone for a durable and broad-based revival with renewed emphasis on public investment through infrastructure development. By March, however, we had to completely alter our assessment as war clouds broke over Ukraine and fundamentally altered the global macroeconomic and financial landscape. We remained rooted in our conviction that India’s macroeconomic fundamentals are strong amidst the ominous tides of global spillovers. In April, it became clear that the global economy is in the throes of a geo-political cataclysm. Choked supplies and mounting commodity prices, especially of food and energy, stoked inflationary pressures, exacerbating policy trade-offs for central banks. India too experienced tremors from these developments which were evident in inflation prints and balance of payments conditions. Nonetheless, domestic conditions provided comfort as the removal of mobility restrictions alongside a broadening of vaccination coverage helped economic activity to return to speed. In May, the global growth outlook turned grimmer as geopolitical tensions lingered, commodity prices remained elevated and withdrawal of monetary accommodation gathered pace. We recognised that inflation risks had become more accentuated for India, but that the recovery remains resilient in spite of global spillovers. In June, our SoE noted that domestic macroeconomic conditions were weathering global headwinds. We also dwelt upon expectations from monetary policy actions undertaken till then to fight inflation so as to offer clarity on what the RBI seeks to achieve with policy actions. Our view was that the rate and liquidity actions demonstrate that the RBI cares about people’s perceptions, thereby anchoring their faith in RBI’s commitment to price stability and strengthening the foundations of growth. Hence we held the firm belief that second-round effects of the inflation surge would be prevented from getting entrenched. In July, we reiterated our optimism that the Indian economy showed resilience and dynamism in spite of the geopolitical situation and high risk aversion in financial markets. As if in sympathy, inflation in India came off its April peak, international commodity prices eased along with abatement of supply chain pressures, but central banks across the world remained engaged in the most aggressive monetary policy tightening in decades. We assigned high risk to global spillovers. Heightened uncertainty, commodity prices, geopolitical conditions and monetary policy normalisation were identified as the main factors depressing the outlook. In August, we hypothesised that there would be a grudging and uneven easing of the momentum of price changes. We also communicated that India deals with multiple challenges from a position of strength imparted by the resilience of its macro-fundamentals and buffers. We recognised a structural change in the policy environment brought about by a monetary policy framework that explicitly accords primacy to the goal of price stability. In September our assessment showed that loss of momentum in global economic activity may be taking the edge off inflation and that the Indian economy is poised to shrug off the modest tapering of growth momentum in the first quarter of 2022-23 as aggregate demand firmed up. We reiterated that at this critical juncture, monetary policy has to perform the role of a nominal anchor for the economy as it charts a new growth trajectory. The focus should be on being time consistent in aligning inflation with the target. In October, broader economic activity was assessed to expand further. We cautioned though that only time will tell whether India is decoupling from the global growth slowdown. In November, we saw formidable global headwinds confronting the domestic macroeconomic outlook as India geared up to a leadership role in the world stage by assuming the mantle of the G20 Presidency for 2023. We concluded that as the winds shift, the worst seems to be losing pace as we forge ahead. In December, as India engages in setting out its priorities and deliverables under its G20 Presidency, there is a sense that perhaps her time in the centre of the world’s stage has arrived. As the third largest economy in PPP terms, and the fifth largest in terms of market exchange rates, India accounts for 3.6 per cent of G20 GDP while its share in real (PPP) terms is much higher at 8.2 per cent. In 2023, India is projected to be among the fastest growing economies within G20. Our priorities under the G20 Presidency encapsulate a vision of unity and interconnectedness. They will also reflect the priorities of the global South: One Earth, One Family, One Future. * This article has been prepared by G. V. Nadhanael, Shahbaaz Khan, Madhuresh Kumar, Kunal Priyadarshi, Garima Wahi, Jessica Maria Anthony, Pankaj Kumar, Gautam, Monika Sethi, Anoop K Suresh, D. Suganthi, Rohan Bansal, Kovuri Akash Yadav, Priyanka Sachdeva, Pratibha Kedia, Avnish Kumar, Amit Pawar, Jitendra Sokal, Ashish Santosh Khobragade, Sasanka Sekhar Maiti, Vineet Kumar Srivastava, Samir Ranjan Behera, Deba Prasad Rath and Michael Debabrata Patra. Views expressed in this article are those of the authors and do not represent the views of the Reserve Bank of India. 1 Mohamed El-Erian, The Consensus Forecast on Recession Risks Complacency, Financial Times, November 22, 2022. 2 Monetary Policy Statement, 2022-23, Resolution of the Monetary Policy Committee (MPC) December 5-7, 2022. 3 World Bank, India Development Update; December 06, 2022. 4 Sub-indices of this index include Cereal, Vegetable oil, Dairy, Meat and Sugar Price Indices. 5 BRICS stands for Brazil, Russia, India, China and South Africa. 6 https://www.oecd.org/economic-outlook/november-2022#gdp 7 As per Bizom - a retail intelligence platform that collates FMCG data at the store level take-off. 8 https://pib.gov.in/PressReleasePage.aspx?PRID=1877232#:~:text=The%20Central%20Government%20has%20restored,steel%20products%20 including%20pig%20iron. 9 https://worldsteel.org/steel-topics/statistics/short-range-outlook/ 10 https://www.pib.gov.in/PressReleasePage.aspx?PRID=1876929 11 “Consumer Sentiments to sustain elevated levels”, CMIE Economic Outlook, November 14, 2022. 12 “Estimated 32 lakh weddings till Dec 14 with a trade of Rs 3.75 lakh cr”, The Economic Times, November 7, 2022. 13 /en/web/rbi/-/press-releases/operationalisation-of-central-bank-digital-currency-retail-e%E2%82%B9-r-pilot-54773 14 It is a body of payments and settlement system participants in India. 15 “PCI introduces Project Pratima to standardise payments across platforms”, The Hindu Business Line, December 2, 2022. |
പേജ് അവസാനം അപ്ഡേറ്റ് ചെയ്തത്:


