 IST,
IST,


RBI WPS (DEPR): 04/2015: Is Exchange Rate The Dominant Factor Influencing Corporate Profitability in India?
| RBI Working Paper Series No. 04 @Shaoni Nandi, Debasish Majumder and Anujit Mitra Abstract 1 Profitability of the non-financial private corporates is one of the key indicators of the macroeconomic activities and financial health of a nation. In India, list of major factors influencing profitability has altered over time. In particular, the gradual opening up of the economy and greater reliance on market forces after 2000-01 reinforced the importance of macroeconomic factors like exchange rates and interest rates to determine corporate performance. In a panel framework, the firm profitability is regressed on firm specific and macro-economic indicators to examine the nature of impact of various factors, including exchange rate, on profitability. While it is established that the global financial crisis has had a significant impact on the Indian corporates, in this study the pre and post crises performances have been separately analysed to assess the significance of the firm specific and the macroeconomic factors on corporate profitability under the two distinct regimes. Additionally, since our economy has become increasingly sensitive towards the external shocks, relevant scenarios with large exchange rate depreciations have been identified to analyse the effect of the exchange rate on corporate profitability under stress. Apprehension has been raised in various forums that uncoordinated monetary policy actions by the developed economies can result into volatility in exchange rate in EMEs. The exchange rate volatility may have amplified impact on the profitability of the private non-financial corporates in India. JEL classification: G30; G32; C33 Keywords: Corporate profitability, Panel data analysis, Exchange rate appreciation 1. Introduction Indian corporate sector before the reforms in 1990s was playing a passive role constrained by strict regulations on maintaining debt equity ratio in different industries, managing working capital or availability of credit at administered rates with almost no relation to the creditworthiness of the corporates. However, the considerable growth of the corporate sector after the reform in 1990s and its increasing strategic importance for achieving higher growth in GDP drew the policymaker’s attention to monitor the financial health and performance of corporates. It also necessitated examining the link between the corporate sector, financial sector and the economy, in general. Consequent to the shift in the policy regime, factors influencing corporate performance also metamorphosed over time. For an example, the paradigm shift to a more open economy after 2000-01 with greater reliance on market forces may have reinforced the importance of macroeconomic factors like exchange rates and interest rates to determine corporate performance. Furthermore, in the aftermath of the global financial crisis 2007-09, since the domestic economy became more integrated with the global economy and also more sensitive to external shocks, the correlation between the exchange rate and corporate performance was expected to be amplified further. The common channel for establishing this relationship is via import and export. The depreciation of the domestic currency makes the export cheaper and the import costlier which may have a positive impact on the performance of firms exporting their products simultaneously making a negative impact on the performance of the firms importing raw materials, though the long-run impacts would be influenced by the import and export elasticities. Therefore, if the firm’s earnings from the export-sales are more compared to its expenditure on import of raw materials, a depreciation of domestic exchange rate would be expected to have positive effect on firm’s performance. Conversely, when the import is more compared to the export, an appreciation of the domestic currency would lead to boost corporate profitability. This outcome is expected for Indian corporates. For a sample of 2,214 non-government non-financial (NGNF) listed Indian companies in 2013-14, total import is 3.5 per cent more compared to total export revealing the import-oriented nature of Indian corporates. Among all importing items, the crude oil import, however, is dominating which comprises 23.8 per cent of the total. If oil importing companies are forgone from the above set, total import would be 3.5 per cent lower compared to total export. Therefore, the impact of appreciation (or depreciation) of the domestic currency on profitability, which would likely be positive (negative) for Indian companies, might be opposite for non-oil sector. We would separately study the non-oil segment to understand this impact. The appreciation (or depreciation) might have an indirect impact also. An appreciation gives foreign firms a cost advantage in terms of domestic currency units. This intensifies the competition faced by domestic firms in both domestic and export markets, reducing the price they can charge. A reduction in mark-up by domestic firms may adversely impact the firm’s profitability. Furthermore, an appreciation (or depreciation) of domestic currency would result in a decrease (increase) of net external non-trading dues of a company in terms of domestic currency. These items include net interest payment on external debt, net dividend in FOREX, net capital repayment in FOREX, and fees, commission, royalties to be paid in FOREX etc. Shin & Zhao (2013) and Nagaraj (2014) documented evidence that many large non-financial corporations in India behave like intermediaries rather than orthodox non-financial firms. These firms utilise their access to creditors by recycling their borrowings to on-lend to other firms - usually smaller ones with limited access to bank lending. They also observed that Indian companies having subsidiaries in other countries often transmit their financial conditions across borders. In this case, when global credit conditions are easy, the firm borrows in US dollars through its subsidiaries in other countries and then accumulates rupees at its headquarters. The rupees are then held as time deposits in a local bank in India. An appreciation (or depreciation) provides a cost advantage (or disadvantage) to the company when its net expenditure is expressed in terms of domestic currency which in turn boost (or reduce) company’s profitability. Similar to exchange rates, interest rates may also have a direct effect on corporate performance. A rise in interest rate would jack-up the interest outgo thereby increasing expenditure and reduction in profitability. This influence on corporate profitability would, however, might be different in the period of stress in the FOREX markets. We identified scenarios with stress in the FOREX market to analyse the effect of firm-specific and macro factors on corporate profitability during stress. Our results are compared with normal periods. The rest of the paper is organized as follows: Section 2 provides the literature review and Section 3 provides the conceptual framework. Data description is provided in Section 4. Estimation of the regression models and the empirical findings thereof are provided in Section 5. Evaluation of corporate profitability while stress in the FOREX markets are given in Section 6. Section 7 draws the conclusion. The importance of firm-specific characteristics such as firm size, leverage, liquidity etc., in explaining the performance of private corporates was documented in many recent studies. Kakani and Kaul, 2002 identified that firm size, marketing expenditure, and international exposure had a positive relation with its shareholder values. Larger firms might have stronger competitive capability than their smaller counterparts, which might be due to their superior access to resources (Wu, 2006). As firms become large, they tend to increase their market share and enjoy economies of scale, thereby enhancing their efficiency and profit level (Bourgeois, 1980). However, on a contrarian view, firm-size is interpreted as the source of organizational costs (Shepherd, 1972), which, by and large, has been found to affect performance negatively (Montgomery and Wernerfelt, 1988; Porter, 1987; Rumelt, 1982). The financial literature has also analyzed the relationship between leverage and corporate performance, which was conventionally from the point of view of how the level of the firm’s debt affects the firm value. Debt can improve the value of a firm because it forces managers to take value-maximizing decisions (Jensen, 1986; Stulz, 1990). It acts as a disciplinary device in mitigating the agency costs of outside ownership and thereby contributes to an improvement in firm performance (Jensen and Meckling, 1976). Lang, Ofek, and Stulz 1996 have provided evidence in line with the idea that firm leverage might be beneficial for shareholders, limiting the growth for firms with low Tobin’s q. In a contrarian view, firms with more debt will have the greater operating difficulties in a downturn. Therefore, leverage will also have a negative effect on firm’s performance. The net effect of leverage on firm performance will be the result of the stronger of these effects. The importance of macroeconomic factors like exchange rate, interest rate and the WPI inflation rate to determine corporate profitability was accepted by several scholars. Many empirical studies in the recent time provide evidence for the relationship between foreign exchange rate movements and changes in the value of firms ((Olufemi, 2011; Baggs et al., 2009). However, findings of these studies are diverse. While many studies, inferred that the impact of exchange rate on firm’s value was significant (Allayannis, 1997; Allayannis and Ihrig, 2001; Chow et al., 1997; Dominguez and Tesar, 2001; Griffin and Stulz, 2001), many other studies argued that the value impact of exchange rate was weak (Bodnar and Gentry, 1993; Jorion, 1990). For Indian markets, a recent study by Samsudheen and Shanmugasundram (2013) established that for a period of 2010 to 2012 the sensitivity of the value of Indian firms to changes in exchange rate was substantial. Traditionally, various indicators have been used to measure corporate performance. Return on assets (ROA), return on equity (ROE), return on investment (ROI), return on sales (ROS) and profit margins are most commonly used measures (Davis and Kay, 1990; Mokhtar et al., 2006; Naser and Mokhtar, 2004; Prasetyantoko and Parmono, 2008). In the present paper, for analyzing corporate performance based on annual data, return on assets (ROA) was used. Similar analysis based on quarterly data was carried out using EBT margin which is the ratio of earnings of a firm before taxes (EBT) to sales. Return on assets (ROA) is the ratio of net profit to total assets which gives an idea as to how efficient the management is at using its assets to generate earnings. To examine the various factors influencing corporate performance, ROA for annual data and EBT margin for quarterly data are regressed on a set of control variables which were divided into firm specific factors and macroeconomic indicators. The nature of corporate data is cross-sectional. We designed a panel framework where the firm profitability is regressed on firm specific and macro-economic indicators to examine the nature of impact of the various factors on profitability. This framework has the advantage in removing the effects of unobserved heteroscedasticity among the entities and reflecting true association among the variables of interest. The model is based on simple panel regression analysis as: 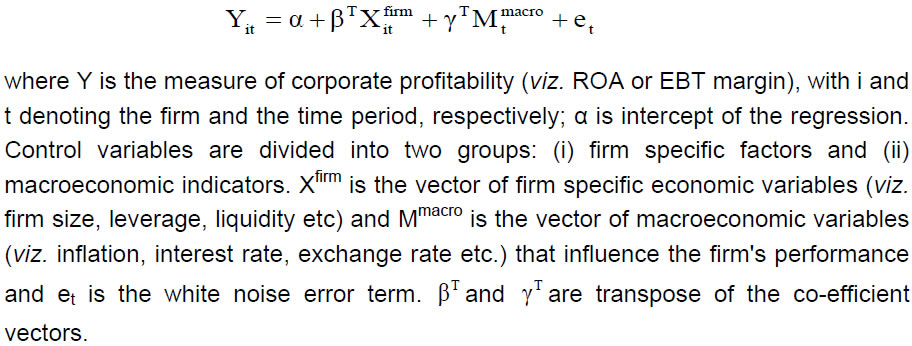 Two basic types of models have been considered to find out the true association of the variables after taking into account the unobserved heterogeneity. These are: (a) Fixed Effect Models - Here the specific assumption is that the effects of unobserved heterogeneity are fixed in nature and are reflected in intercepts. (b) Random Effects Models - In this case, it is assumed that the unobserved effects are random in nature and are uncorrelated with other explanatory variables. The longitudinal data for listed non-financial private companies during the years 2002 to 2014 has been made use of by carrying out panel data analysis to explore the relationships among variables. It was verified that all of them are stationary (see Table 8 of the Appendix). The data used has been obtained from the annual balance sheets and the quarterly earnings results of non-financial listed private corporates in India. More explicitly, the study analyses the influence of firm specific and macro variables using an unbalanced panel. The dependent variables, Return on Assets (ROA) and EBT Margin (EBTM) are computed as the ratio of net profits to total assets and profits before taxes to net sales respectively. The organizational variables namely liquidity ratio (ratio of current asset to current liability), leverage ratio (ratio of debt to total equity), firm size (log of total assets) and export intensity (exports to total assets ratio) have been extracted from annual reports of the listed companies. It is assumed that firm specific indicators remain same during the year. Macro variables (included as independent variables) such as WPI, Repo Rate, USD/INR RBI reference rate etc. were culled out from the respective data sources. Table 1 describes the variables used in the study. Average return on assets of the Indian non-financial private corporates stood at 4.8 per cent during the period under consideration – i.e. 2002-2014. The long term average of the leverage stood at around 0.76 for the annual data with slight variation in the quarterly data. The average liquidity was at 4.44. The variation of the leverage of the companies stood at the highest among all the firm specific variables followed by the second largest coefficient of variation in the liquidity ratio. Profitability measured in terms of EBT (Earnings before Tax) margin was at -27.1 per cent on average. Firm size (measured by log of total assets) and export intensity were least volatile among the firm specific variables considered. The macro variables exhibited low volatility. Average USD/INR rate for the period stood at 46.4 while the average of repo rate remained at 7 per cent and average inflation during the period was 6 per cent. The firm specific indicators were heavy tailed with a high kurtosis. 5. Panel regression for evaluating corporate profitability We employ panel regression method for identifying factors influencing corporate profitability. Based on the global recession of 2007-09, total sample period (i.e. Q1:2002 to Q3:2014) is divided into two sub periods, pre-crisis period (Q1:2002 to Q4:2007) and post crisis period (Q1:2009 to Q3:2014). Panel regression based on annual and quarterly data were carried out separately for the total sample and also for above two sub periods. 5.1 Evaluating corporate profitability during 2002 to 2014 Effects of different factors (firm-specific and macroeconomic) on corporate profitability are evaluated through the panel regression setup. Panel regression based on annual data and quarterly data are separately carried out. In the former model, ROA (i.e. the ratio of net profits to total assets) and, in the latter, EBT (earnings before tax) margin are considered as dependent variable. Firm-specific independent variables are firm size (X1), the leverage ratio (debt to equity ratio) (X2), the liquidity ratio (ratio of current asset to current liability)(X3) and the ratio of export to assets(X4). Macroeconomic indicators considered in our model are the USD/INR rate (M1), the REPO rate (M2) and the WPI inflation rate (M3). Hausman specification tests suggest fixed effect model for all the panel regressions considered by us (Appendix). In the panel regression based on annual data, the liquidity ratio and the export to assets are significant firm-specific factors to determine ROA (Table 2). Macro indicators are not significant in this case. However, in the panel regression based on quarterly data, firm size, the USD/INR rate and the WPI inflation are significant factors to determine the EBT margin. For the non-oil companies, the USD/INR rate is significant and negatively associated with the EBT margin for quarterly data. This outcome could be explained by higher non-trading dues of the non-oil companies in foreign currencies. These items include net interest payment on external debt, net dividend in FOREX, net capital repayment in FOREX, and fees, commission, royalties to be paid in FOREX etc. An appreciation (or depreciation) of domestic currency provides an advantage (or disadvantage) to these companies when their expenditure is expressed in terms of domestic currency which in turn boost (or reduce) their profitability. Table 2: Corporate Performance during 2002 to 2014 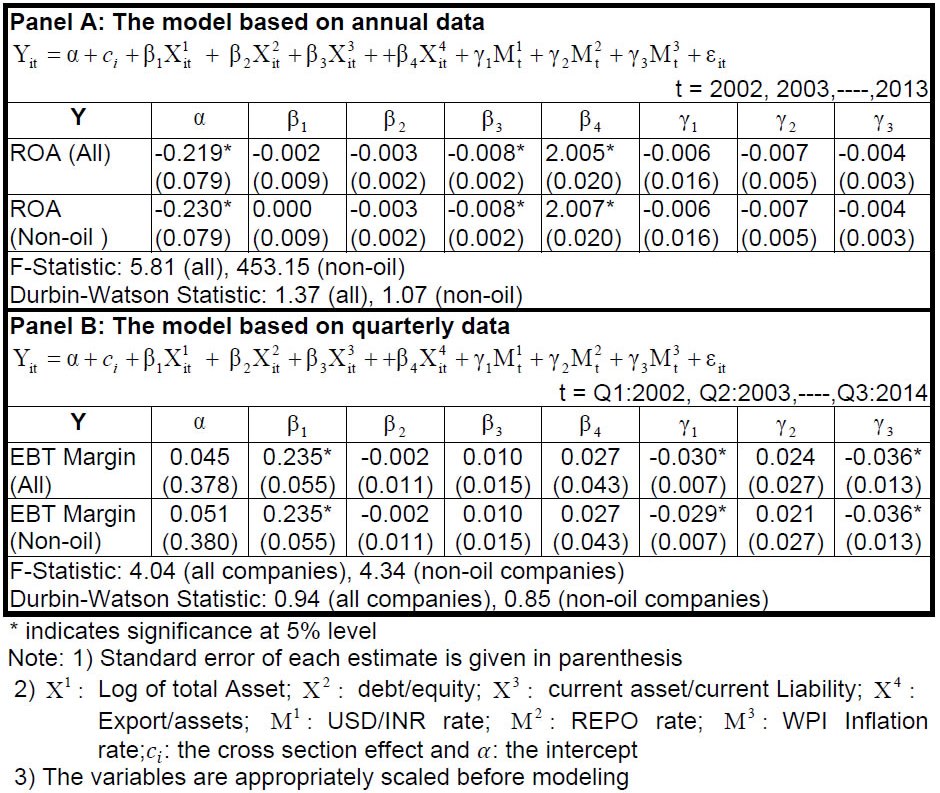 5.2 Evaluating corporate profitability in pre-crisis (2002-2007) During 2002-2007, Indian economy maintained average rate of growth of almost 8 per cent which was driven by higher corporate profitability and also by rapid expansion in financial markets. Corporate profitability during 2002-07 was particularly influenced by firm-specific characteristics like firm size, leverage ratio, liquidity ratio etc. (Table 3). Among macro-economic indicators, the USD/INR rate was the only significant indicator in the panel regression based on annual data which, however, was not coming out to be significant in the regression based on quarterly data. Other macro indicators viz. the repo rate and WPI inflation had no significant impact on corporate profitability. For non-oil companies, results are mostly similar as in for all companies. Table 3: Corporate Performance during 2002 to 2007 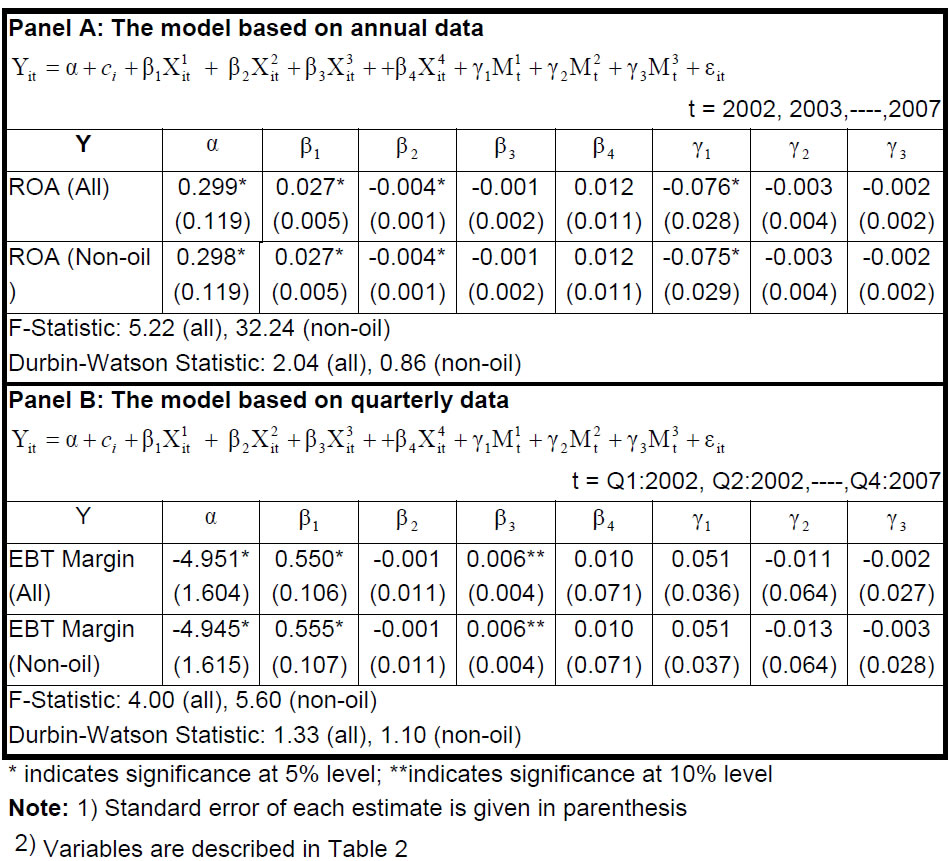 5.3 Evaluating corporate profitability in post-crisis (2009-2014) The global recession of 2007-09 had severely impacted the performance of Indian private corporates, as reflected in contracting net profits (Y-o-Y) for the last three quarters of 2008-09. In the post-recessionary period, the domestic economy became more integrated with the global economy and also more sensitive to external shocks. Simultaneously, the importance of macroeconomic factors like exchange rate, interest rate and the WPI inflation rate to determine corporate profitability is expected to be amplified. In the panel regression based on annual data, the USD/INR rate and the repo rate are found to be significant macroeconomic factors to determine ROA (Table 4).In the panel regression based on quarterly data, the USD/INR rate and the WPI inflation are observed to be significant macroeconomic factors to determine the EBT margin. The firm size (Log of total Asset) is the only significant firm-specific indicator in both the regression models having a positive effect on firm profitability. This indicates that larger firms would be expected to have higher profitability compared to medium and small sized firms. It is typically observed that larger firms with their diversification are able to survive the episodes of economic crisis and deep recession while the smaller firms suffer more and many are forced to close their shops. In both regression models, the coefficient of the USD/INR rate is significant and negative, which indicates that if rupee depreciates corporate profitability is likely to be reduced. The results are in consonance with the fact that Indian corporates are mostly import oriented characterised by considerably lower export-sales compared to import of raw materials. The depreciation leads to make the export cheaper and the import costlier which may have a net negative impact on the performance of the firms importing raw materials. Obviously, an appreciation of the USD/INR rate would have an opposite effect. Similar results could be observed even for non-oil companies. For these companies, the repo rate for annual data and the USD/INR rate and WPI inflation for quarterly data are significant macroeconomic indicators to express their profitability. The USD/INR rate is negatively associated with the EBT margin in regression based on quarterly data indicating that an appreciation (or depreciation) is likely to boost (or reduce) corporate profitability. The results are in similar lines to what we obtained with the annual data. Table 4: Corporate Performance during 2009 to 2014 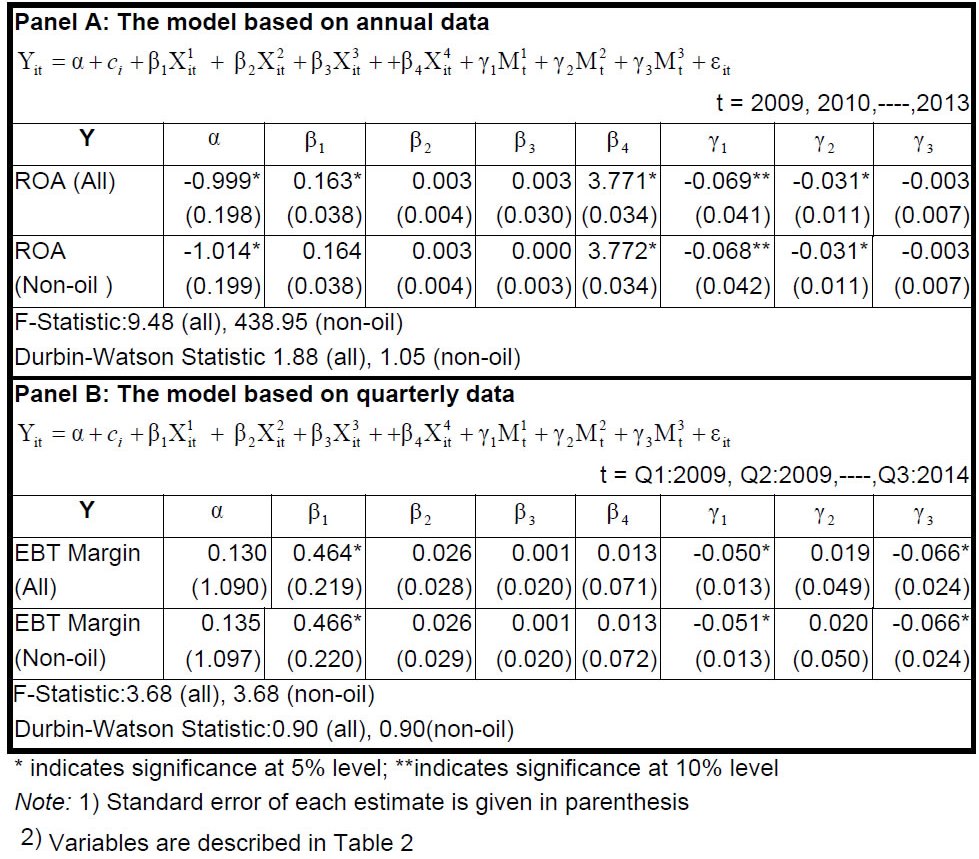 6. Evaluating corporate profitability under stress in the FOREX markets In the preceding section, we have observed that USD/INR rate is a critical factor in determining corporate profitability during pre-crisis and post-crisis periods. The importance of this factor has increased manifold in the post-recession (2009-2014) period because during this period the domestic economy has become more sensitive to external shocks. In this scenario, a persistent large movement in the exchange rate is expected to impact the performance of the corporate sector which may subsequently affect the banking sector and hence the entire economy. It is, therefore, relevant to identify scenarios with large depreciation/ appreciation of exchange rate for analyzing corporate profitability in stress. This is handled under single factor stress test framework. 6.1. Choice of stress scenarios The usefulness of stress tests as risk management tool crucially depends on the choice of stress scenarios which was traditionally picked by hand. Handpicked scenarios, however, might misrepresent risks, either because such scenarios are too implausible or because real stressful scenarios might not have been considered (Breuer and Csiszár, 2013). For overcoming pitfalls of performing stress tests with handpicked scenarios, we adopted the approach by Studer, 1997, 1999 and Breuer and Krenn, 1999, who used the Mahalanobis distance as a mathematical tool to choose stress scenarios. The Mahalanobis distance (Maha) of the realisation r from the expectation, E(r), is defined by:
Given that the distribution of the risk factor is elliptical, Studer’s systematic stress test method suggested that suitable Mahalanobis ellipsoids as sets of plausible scenarios may be chosen. Conversely, the less plausible scenarios are severe scenarios that lie over admissible domain of plausible scenarios (Breuer et al., 2009). A high value of Maha implies a low plausibility of the scenario r. If we want to get more severe scenarios, we choose a higher k and get less plausible worst-case scenarios. If we want to get more plausible scenarios, we choose a lower k and get less severe worst-case scenarios. 6.2. Corporate Performance in stress scenarios Considering USD/INR rate as a risk factor we have identified severe / or less plausible scenarios lying outside the admissible domain of plausible scenarios. The domain of plausible scenarios is a suitable Mahalanobis ellipse for some suitably chosen radius k. We have chosen stress scenario 1 that includes all large movements of exchange rate (either appreciation or depreciation) and stress scenario 2 that includes only large depreciations. During periods of stress in the FOREX market, large movements are normally observed also in other macroeconomic indicators like REPO rate, WPI inflation etc. Simultaneously, corporate performance indicators viz. EBT margin become more chaotic compared to the normal times. Our panel regression results indicate that during stress the USD/ INR rate is the only critical factor to determine corporate profitability (Tables 5 & 6). In the scenarios with large depreciation in exchange rate, the sensitivity of the exchange rate to the EBT margin is considerably high. Firm-specific indicators as well as other macro indicators have little impact on corporate profitability during those periods. Table 5: Corporate Performance during stress in the FOREX market 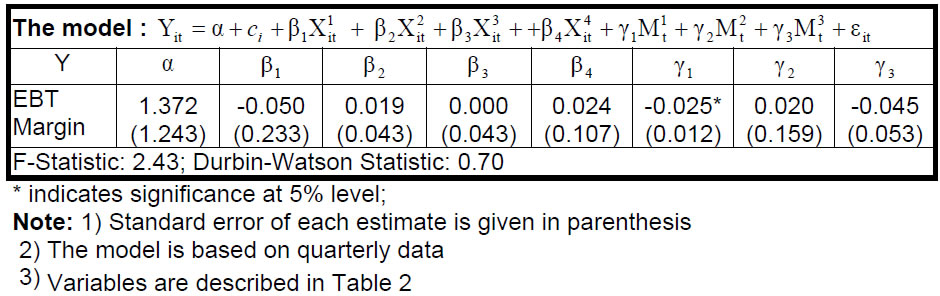 Table 6: Corporate Performance during stress in the FOREX market (includes quarters only when the rupee had a higher depreciation) (Stress Scenario 2) 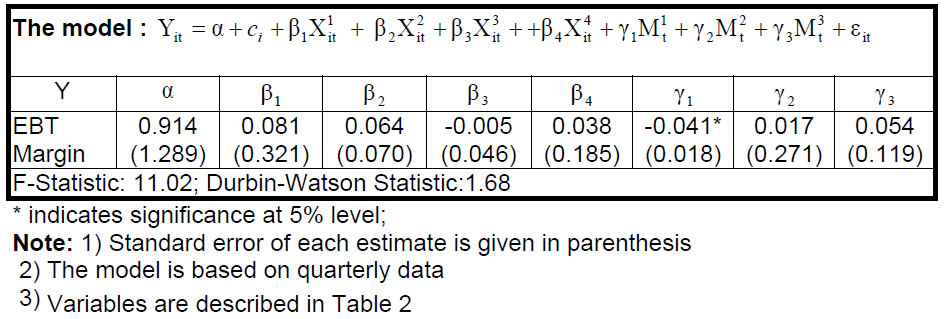 Indian corporate sector witnessed a significant growth over last two decades and became an integral as well as key strategic part of the economy. With the rapid development of the sector, factors influencing corporate performance are also metamorphosed over time. During 2002-2007, corporate profitability was mostly influenced by firm-specific indicators like firm size, leverage, liquidity etc. However, since 2009, the domestic economy became more integrated with the global economy and also more sensitive to external shocks. Simultaneously, the importance of macroeconomic factors like exchange rate, interest rate and the WPI inflation rate to determine corporate profitability is amplified. Among the macroeconomic indicators, the USD/INR rate was a significant factor whose importance has increased manifold in the recent time. Our panel regression model shows that the exchange rate is negatively associated with corporate profitability indicators (viz. ROA for annual data and EBT margin for quarterly data). Therefore, it can be inferred that when rupee appreciates, corporate performance is likely to get a boost in terms of profitability, though in the long run the impact would depend on the import and export elasticities. This gels with the nature of our corporate sector carrying out more imports than exports. As import gets cheaper when rupee appreciates, corporates are likely to be benefited from that. In a scenario of persistent large depreciation of domestic currency, the performance of the corporate sector is expected to be impacted negatively, which may in turn affect the banking sector. For non-oil companies also the USD/INR rate is a significant factor behind their profitability which is negatively associated with profitability indicators in most of our panel regressions. Although for these companies, the export is marginally higher compared to the import in 2013-14, the expenditure in foreign currencies exceeds earning, particularly due to various non-trading dues of these companies. An appreciation (or depreciation) of domestic currency provides a cost advantage (or disadvantage) to these companies when their expenditure is expressed in terms of domestic currency which in turn boost (or reduce) their profitability. In the post crisis period, many of the large private non-financial corporates in India have resorted to behave like financial intermediaries to take advantage of the easy liquidity abroad. This has amplified the impact of exchange rate volatility on their profitability. Any uncoordinated monetary policy actions by the developed economies can result into increased volatility in exchange rate in EMEs. We identified scenarios with stress in the FOREX market with the objective of analyzing the effect of the exchange rate on corporate profitability during stress. When the FOREX market is under stress, it is observed that the exchange rate becomes the only critical factor to determine corporate profitability, dominating all other factors. @The paper is prepared by Shaoni Nandi (Research Officer), Debasish Majumder (Assistant Adviser) and Anujit Mitra (Director) of the Corporate Studies Division, Department of Statistics and Information Management, Reserve Bank of India. 1 The views expressed in this paper are of the authors and not of the organization to which they belong. References Allayannis, G. (1997). The time-variation of the exchange rate exposure: An industry analysis. (57th Annual American Finance Association Conference, (New Orleans), January). Allayannis, G., and Ihrig, J. (2001). Exposure and Markups. Rev. Financ. Stud. 14, 805–835. Baggs, J., Beaulieu, E., and Fung, L. (2009). Firm survival, performance, and the exchange rate. Can. J. Econ. Can. Déconomique 42, 393–421. Bodnar, G.M., and Gentry, W.M. (1993). Exchange rate exposure and industry characteristics: evidence from Canada, Japan, and the USA. J. Int. Money Finance 12, 29–45. Bourgeois, L.J. (1980). Performance and consensus. Strateg. Manag. J. 1, 227–248. Breuer, T., and Csiszár, I. (2013). Systematic stress tests with entropic plausibility constraints. J. Bank. Finance 37, 1552–1559. Breuer, T., and Krenn, G. (1999). Stress Testing, Guidelines on Market Risk (Oesterreichische Nationalbank). Breuer, T., Jandacka, M., Rheinberger, K., and Summer, M. (2009). How to find plausible, severe, and useful stress scenarios. Int. Joural Cent. Bank. 5, 205–224. Chow, E.H., Lee, W.Y., and Solt, M.E. (1997). The economic exposure of US multinational firms. J. Financ. Res. 20, 191–210. Davis, E., and Kay, J. (1990). Assessing corporate performance. Bus. Strategy Rev. 1, 1–16. Dominguez, K.M.E., and Tesar, L.L. (2001). A Reexamination of Exchange-Rate Exposure. Am. Econ. Rev. 91, 396–399. Griffin, J.M., and Stulz, R.M. (2001). International competition and exchange rate shocks: a cross-country industry analysis of stock returns. Rev. Financ. Stud. 14, 215–241. Jensen, M.C. (1986). Agency costs of free cash flow, corporate finance, and takeovers. Am. Econ. Rev. 76, 323–329. Jensen, M.C., and Meckling, W.H. (1976). Theory of the firm: Managerial behavior, agency costs and ownership structure. J. Financ. Econ. 3, 305–360. Jorion, P. (1990). The exchange-rate exposure of US multinationals. J. Bus. 63, 331–345. Kakani, R.K., and Kaul, M. (2002). Firm Performance and Size in Liberalized Era: The Indian Case. XLRI Jamshedpur Sch. Bus. Work. Pap. Lang, L., Ofek, E., and Stulz, R. (1996). Leverage, investment, and firm growth. J. Financ. Econ. 40, 3–29. Mokhtar, M.., Kamil, Nikh Mohd, and Muda. M.S (2006). Evaluation of Factors Affecting Corporate Performance of Malaysian Listed Companies. Intl J. Econ. Manag. 1, 911–216. Montgomery, C.A., and Wernerfelt, B. (1988). Diversification, Ricardian rents, and Tobin’s q. RAND J. Econ. 19, 623–632. Nagaraj, R (2014). Economic Challenges to the New GovernmentA Policy Proposal. Economic & Political Weekly, 21, 35-41. Naser, K., and Mokhtar, M.. (2004). Determinants of corporate performance of Malaysian companies. (Singapore),. Olufemi, A.T. (2011). Exchange Rate Risk Exposure of Nigerian Listed Firms: An Empirical Examination. Int. Bus. Res. 4, 219–225. Porter, M.E. (1987). From competitive advantage to corporate strategy. Prasetyantoko, A., and Parmono, R. (2008). Determinants of Corporate Performance of Listed Companies in Indonesia. MPRA Pap. No 6777. Rumelt, R.P. (1982). Diversification strategy and profitability. Strateg. Manag. J. 3, 359–369. Samsudheen. K and Shanmugasundram G. (2013), Sensitivity of Indian Corporate Firms to the Foreign Exchange Rate Fluctuations, Asian Journal of Research in Business Economics & Management, 3, 57-69. Shepherd, W.G. (1972). The Elements of Market Structure. Rev. Econ. Stat. 54, 25–37. Shin, H. S. and Zhao, L.Y. (2013). Firms asSurrogate Intermediaries: Evidence from EmergingEconomies, Asian Development Bank, December. Shin, H.S. (2013). The Second Phase of Global Liquidity and Its Impact on Emerging Economies1. Keynote Address Fed. Reserve Bank San Franc. Asia Econ. Policy Conf. 7. Studer, G. (1997). Maximum loss for measurement of market risk. Doctoral dissertation, Swiss Federal Institute of Technology Zurich. Studer, G. (1999). Market risk computation for nonlinear portfolios. J. Risk 1, 33–53. Stulz, R. (1990). Managerial discretion and optimal financing policies. J. Financ. Econ. 26, 3–27. Varma, J.R. (1998). Indian financial sector reforms: A corporate perspective. Vikalpa J. Indian Inst. Manag. Ahmedabad 23, 27–38. Wu, M.L. (2006). Corporate Social Performance, Corporate Financial Performance, and Firm Size: A Meta-Analysis, Journal of American Academy of Business, Cambridge, 8 , 163-171. Table 7: Hausman Specification Tests (Null Hypothesis: Random Effects Model)
|


ഈ പേജ് ഷെയർ ചെയ്യുക:


റിസർവ് ബാങ്ക് ഓഫ് ഇന്ത്യ മൊബൈൽ ആപ്ലിക്കേഷൻ ഇൻസ്റ്റാൾ ചെയ്ത് ഏറ്റവും പുതിയ വാർത്തകളിലേക്ക് വേഗത്തിലുള്ള ആക്സസ് നേടുക!
ഞങ്ങളുടെ ആപ്പ് ഇൻസ്റ്റാൾ ചെയ്യാൻ QR കോഡ് സ്കാൻ ചെയ്യുക


പേജ് അവസാനം അപ്ഡേറ്റ് ചെയ്തത്:


