 IST,
IST,
RBI WPS (DEPR): 07/2013: Size of Government Expenditure Multipliers in India: A Structural VAR Analysis
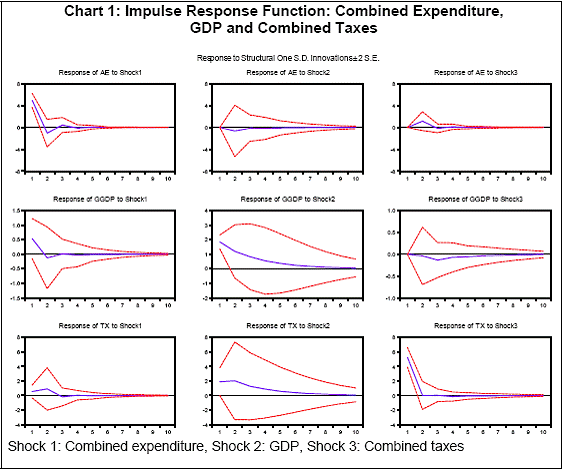
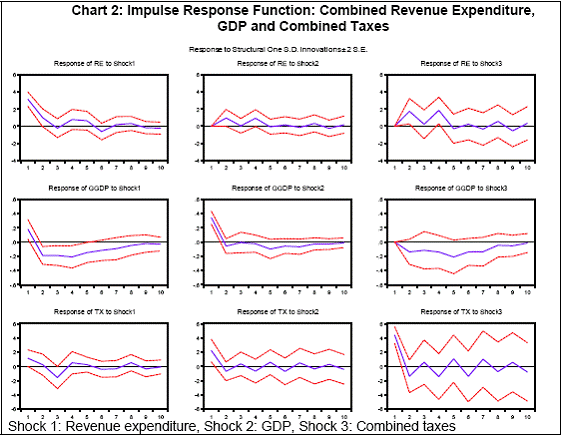
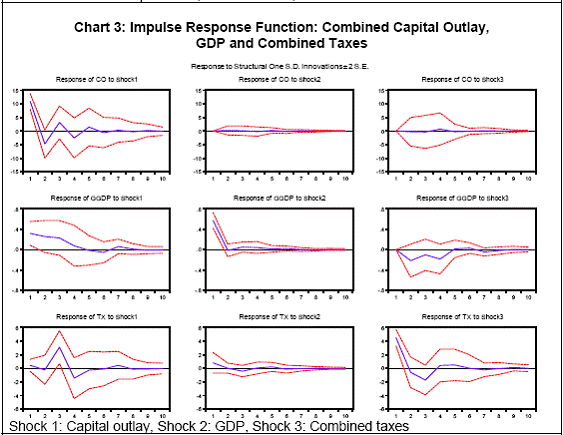
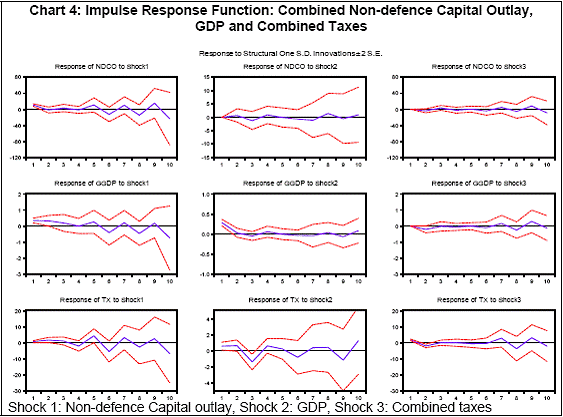
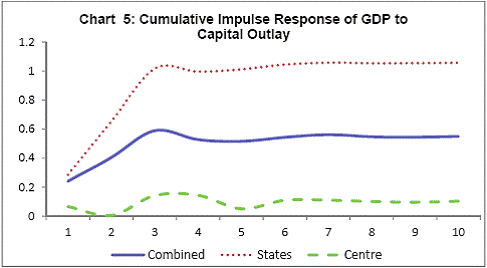
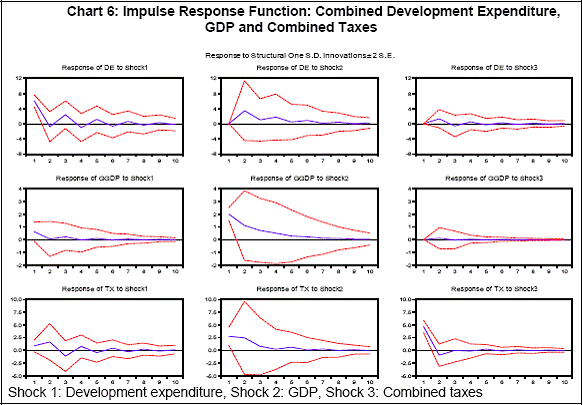
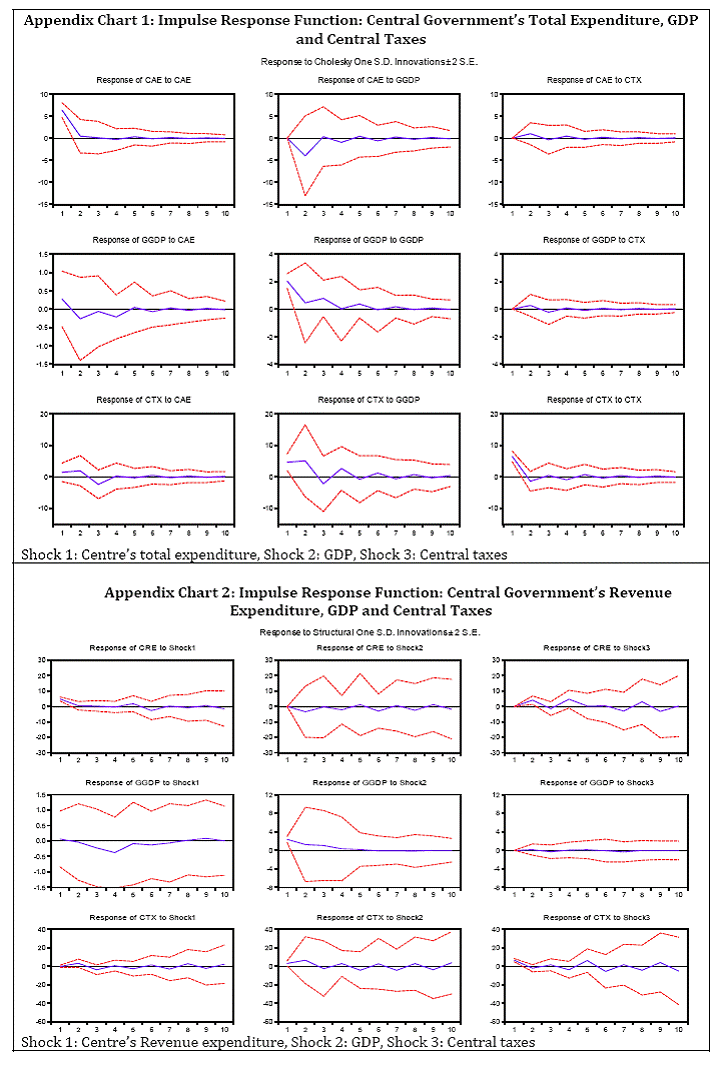
| RBI Working Paper Series No. 07 Abstract 1A structural vector autoregression (SVAR) framework has been used to estimate the size of government multiplier at the level of Central and the State governments in India. As a priori expected, capital outlay is found to be more growth inducing than the revenue expenditure. Since the revenue expenditure accounts for a major share in aggregate expenditure at both levels of government, impact multiplier for overall expenditure is estimated to be less than one and the positive impact dissipates immediately after the first year of shock. Only the capital outlay seems to have prolonged multiplier effect which continues upto four years. Empirical analysis indicates that the multiplier effect for all categories of expenditure by Central government is lower than that of the State governments. Empirical findings strongly suggest the need for change in composition of expenditure in favour of capital outlay and greater decentralisation of expenditure. JEL Classification Numbers: E62, H5 Keywords: Fiscal policy, Government expenditure, Expenditure Multiplier, Structural VAR I. Introduction Global economic and financial crisis in 2008 and 2009 led to large scale discretionary fiscal stimulus measures across countries as a means to stimulate aggregate demand reflecting an underlying belief that government spending or taxation measures could achieve the desired goal. The debate, however, continues to hinge on the size of the fiscal multiplier. ‘Multiplier effect’, measures the impact of an autonomous change in one of the demand components (e.g., consumption and investment) on the aggregate demand. This measure is used to capture the impact of reduction in tax or increase in government spending on output. Fiscal multiplier was argued to be greater than unity in simple Keynesian framework and larger in case of increase in spending than that in the case of tax cuts. This framework has been often extended to include interest rate, exchange rate and other variables (including open economy) to control for crowding out effect and for various channels of domestic and external leakages. Furthermore, the concept of fiscal multiplier has been used differently in terms of reference indicators of output and fiscal policy and also various time-frames (e.g., impact multiplier, cumulative multiplier and peak multiplier). The global crisis has led to a pre-eminence of interest in the role of fiscal policy as a macroeconomic stabilisation instrument. During the crisis period, while central banks, mainly in advanced economies, reduced policy rates to near-zero levels, many governments, both in advanced and emerging market economies, resorted to activist fiscal policy to deal with adverse macroeconomic shock generated by financial sector. In turn, this has led to a considerable debate on the effectiveness of fiscal policy as a stabilisation tool. Counter-cyclical fiscal policy measures have often been resorted to in the Indian case, as and when, needed. For instance during the recent global financial crisis, growth in Indian economy was adversely affected as exports, investment and capital flows suffered a setback. To boost the economy, Central government undertook various fiscal stimulus measures during December 2008 to March 2009. In the absence of credible study on multiplier, it is difficult to estimate the precise impact of fiscal measures on growth. Furthermore, size of expenditure multiplier not only reflects upon the quality and effectiveness of fiscal policy but also assumes importance when there is a need for undertaking a credible fiscal consolidation. These factors and also the lack of empirical estimates of fiscal multipliers for Indian economy motivated this study. The study has been organised into five sections. Besides the first introductory section, Section II provides a review of literature on the cross-section multiplier estimates. Section III briefly discusses the methodology and data sources used in the paper. Section IV presents empirical estimates, followed by Section V with concluding remarks and policy implications. II. Review of Literature The size of fiscal multipliers has become the topic of recent debate. In this debate, it was broadly accepted that “one size does not fit all" - the optimal fiscal response to a macroeconomic shock depends on initial conditions and country characteristics. In a prominent early contribution, Spilimbergo et al (2008) emphasised that fiscal expansion to combat the global shock may not be appropriate for all countries. In certain cases, it can threaten the sustainability of fiscal situation. Particularly, in case a country is facing high debt level or having unsound fiscal situation, fiscal expansion may not be appropriate as it may affect investor confidence and thereby resulting in funding difficulties. Perotti (1999) also argues that high debt levels can constrain the effectiveness of fiscal policy. Even though a country has the fiscal space to undertake expansion, the optimal level of fiscal expansion depends inter alia on country characteristics such as its size and the exchange rate regime. The impact of countercyclical fiscal policy depends on both its magnitude as well as its composition. The comparative impact of government spending and tax cuts also needs to be explored. It is more convincing theoretically to believe that government expenditure would have a greater impact on the economic activity as it has a more direct relationship with aggregate demand in comparison with tax cuts (Jha et al 2010). Among others, two divergent views come from the basic Keynesian and Ricardian Equivalence framework. While the Keynesian framework, assuming rigid prices, assigns prime role to fiscal policy to generate aggregate demand and growth, the Ricardian equivalence between taxes and debt in a dynamic framework leads to zero multiplier effect on output. In the latter case, a Ricardian consumer, being rational, pre-empts government’s inter-temporal budget constraint on account of present tax cuts or increase in expenditure and therefore does not alter its consumption level. The evidence from empirical studies is, however, far from conclusive. A large number of studies have estimated the size of the multiplier. Since these studies provide a wide range of estimates, economists are deeply divided about the usefulness of countercyclical fiscal policy as a stabilisation tool. Although there is ample literature on fiscal multipliers, only a few studies have examined the relative effectiveness of tax cuts versus government spending. In literature, optimal fiscal policy is also found to have strong interaction with the monetary policy stance and development of the banking sector. Under traditional Mundell-Fleming framework, financial development, external openness (trade and capital account) and exchange rate policy are considered important factors in determining the effectiveness of fiscal policy as stabilisation tool. Similarly, the response of private sector demand to fiscal policy also hinges on the sustainability of public finances. For instance, fiscal expansions during the phase of high levels of debt increase the possibility of sharp future retrenchment and thus may deter private sector to generate adequate demand. Similarly, the financial sector development, reflecting the access of private sector to credit, may lead to greater impact of fiscal stimulus. Recent studies undertaken in the wake of global financial crisis predict large government spending multipliers for a phase of deep recession when monetary policy is constrained by the zero lower bound policy rates (Christiano et al 2009 and Devereux 2010). Barro and Redlick (2009) also estimate a larger size of fiscal multiplier in a situation of slack in the labour market. Finally, Turrini et al (2010) find that fiscal policy is found to be more effective during banking crises, due to its impact on collateral values. Castro et al (2013) also find similar evidence. Empirical work by Ilzetzki et al (2011) argues that effectiveness of fiscal policy depends on country-specific conditions. Analysing different groups of countries, authors suggest that fiscal multipliers are smaller for poorer economies, more open economies, economies with flexible exchange rates and economies with high public debt levels. Using a panel of 17 OECD countries, Corsetti et al (2012) evaluate the impact of government spending shocks under different economic conditions, e.g., exchange rate regime, state of public finances and soundness of financial system and find that fiscal transmission differs across environments. Fiscal multipliers tend to be larger for developed economies. In the case of the US, Blanchard and Perotti (2002) find the size of multiplier (after three years) at around one for the government purchases. Based on different variants of methodological framework, Bryant et al (1988) find the multiplier to be in the range of 1.1 to 4.1 for government spending. In a study of five OECD countries, Perotti (2005 and 2007) estimate the multiplier to be in the range of (-)2.3 to 3.7 which varied across countries. Based on a sample of nine major European countries, a study by HM Treasury (2003) shows that tax cuts had lower multiplier impact on the economy as compared with government spending. Romer and Romer (2010) argue that the impact of tax changes on economic activity depends on the persistence of tax change, tax treatment of investment and implications for marginal tax rate. A number of studies have attempted a comparative analysis of advanced and developing countries and concluded that the latter tended to have lower multipliers than the former. For instance, Ilzetzki and Vegh (2008) find the cumulative multiplier of government spending for advanced countries at 1.5 which has far been higher than 0.5 per cent for developing countries. Based on a sample of 44 countries, a recent study by Ilzetzki et al (2011) concludes that the cumulative impact of government consumption expenditure on output was lower in developing countries as compared with high-income countries. Furthermore, crowding out impact of government consumption expenditure is found to be higher in developing economies than that in high income economies. The study also finds that fiscal multiplier is larger in economies with pre-determined exchange rate while it is negative in highly indebted countries. Presenting the estimates of fiscal multiplier in its World Economic Outlook Report (October 2008b), the IMF finds that in advanced economies, the multipliers are statistically significant and moderately positive. An increase of one percentage point in fiscal stimulus has been found to lead to an increase in real GDP growth of about 0.1 per cent, and up to 0.5 per cent above its initial level after three years. In contrast, although the emerging economies experienced similar impact like those of advanced economies, the effects on output in the medium-term have been found to be consistently contractionary indicating that discretionary fiscal measures may have a positive impact in the immediate period but turn anti-growth in the medium-term as they become more of a structural nature and thus more difficult to phase out in later years. In the post-global financial crisis, a number of studies have been undertaken to examine the impact of fiscal stimulus under varying conditions. However, Laxton (2009) opines that effectiveness of expansionary fiscal policy depends on whether private sector expects it to persist indefinitely. If such is the case, then size of multiplier will be smaller due to stronger private-sector offsets. Bruckner and Tuladhar (2010) find that while multiplier impact of public investment on output is higher than that of public consumption in Japan, its effectiveness depends upon the composition, the level of government responsible for implementation of projects, and supply side factors. Baxter and King (1993) also support that productive capacity enhancing government spending has much higher multipliers. Even though there has been a vast literature on estimating fiscal multipliers, the empirical work on fiscal multipliers provides a broad range of results and has not really settled the theoretical debates (IMF, 2008a). As Cogan et al (2009) put it “Macroeconomists remain quite uncertain about the quantitative effects of fiscal policy. This uncertainty derives not only from the usual errors in empirical estimation but also from different views on the proper theoretical framework and econometric methodology”. They find that the government spending multipliers in the case of permanent increases in federal government purchases are far lower in new Keynesian models than those in old Keynesian models, casting aspersion about the robustness of the models and the approach being used for transmission of fiscal policy. Apart from issues relating to robustness of models, there are certain other methodological challenges as well which have often been highlighted while estimating the size of multipliers. First issue relates to endogeneity problem as there are two possible directions of causation: from government spending to output and also from output to government spending. Second, the precise effects of fiscal stimulus are difficult to estimate as other factors impacting growth are also often at play. Third, the definition of multipliers is an important consideration for estimation. Fourth, empirical results are subject to choice of estimation technique. Various methods commonly used to estimate the size of multipliers, including structural vector autoregressions (SVARs), narrative approaches, model simulations, and case studies, have own pros and cons in addressing the challenges mentioned above. It is often argued that size of the multiplier largely depends on the method and approach used for estimation. In the context of use of SVAR models, Caldara and Kemps (2012) show that differences in estimates of fiscal multipliers documented in the literature by Blanchard and Perotti (2002) and Mountford and Uhlig (2009) are largely on account of different restrictions on the output elasticities of tax revenue and government spending. Yadav et al (2012) analyse the impact of fiscal shocks on the Indian economy using SVAR methodology. The study used quarterly data for the period 1997Q1 to 2009Q2. It is found that the impulse responses obtained from two identification schemes, viz., recursive VAR and structural VAR behaved in a similar fashion but the size of multipliers differs. The study showed that the tax variable had larger impact on private consumption as compared to the government spending. III. Empirical Framework: Data Sources and Methodology In the literature on fiscal policy and growth, the issue of simultaneity bias has been highlighted like many other macroeconomic relationships. It is often pointed out that relationship between economic growth and the indicator of fiscal spending may be bidirectional, i.e., fiscal spending influences economic growth and economic growth, in turn, influences the government’s decision making and ability to undertake fiscal measures. Therefore, controlling for such potential endogeneity between fiscal policy indicator and growth leads to the problem of simultaneity bias. In order to deal with the issue of potential endogeneity, a number of studies have either used models incorporating instrumental variables or Vector autoregression (VAR) framework to allow for feedback effects. In the present study, the structural vector autoregression (SVAR) framework has been used to gauge the effects of government spending on GDP. It is estimated for the period 1980-81–2011-12, covering one decade of relatively closed economy and over two decades of relatively open economy.2 SVAR uses economic theory to sort out the contemporaneous relationships between the variables (Sims, 1986). Following one of the frameworks adopted by Blanchard and Perotti (2002), the identification procedure is based on a Choleski orthogonalisation, with government expenditure ordered before GDP growth and tax revenue. Identification procedure is consistent with the assumption that government spending is subject to implementation lags and the fiscal authorities do not respond contemporaneously to trend in GDP growth. In other words, it is assumed that both revenue and capital expenditure are expected to remain unresponsive to current economic conditions and may not have any automatic cyclical component. Therefore, the identification procedure used in the paper presumes that government expenditure impacts GDP which, in turn, can impact tax collections. Thus, we assume that contemporaneous impact of government expenditure, if any, on taxes will be reflected through GDP. Various components of expenditure, i.e., revenue expenditure, capital outlay, non-defence capital outlay and development expenditure have been used in alternative specifications to examine their multiplier impact on GDP. Capital outlay has been deliberately chosen instead of capital expenditure as it constitutes only the investment expenditure and excludes debt repayments, etc by both levels of the government. However, it should not be inferred that other components of capital expenditure do not have multiplier effect. Estimation of multiplier is attempted using these variables at the level of Centre, State and combined finances. Data for different variables have been mainly taken from the Handbook of Statistics on Indian Economy published by the Reserve Bank. Among the exogenous variables, output gap (OG, i.e., actual below potential growth) has been estimated using Hodrick-Prescott filter approach and data on global output growth has been sourced from IMF’s World Economic Outlook database. While GDP (factor cost) at constant prices is used for estimating growth impact, expenditure and tax variables have been converted into real by deflating with WPI series. The variables are converted into growth rates so that the ratio of the impulse response of GDP to shock variables can be interpreted as elasticity α. The impact multiplier is then obtained by dividing the elasticity by the ratio of real spending to GDP. Peak multiplier is obtained based on the ratio of maximum accumulated impulse response of GDP to unanticipated shock in expenditure and dividing it by the ratio of real spending to real GDP. The elasticity is α = (ΔGDP/GDP)/(ΔEXP/EXP), and therefore the multiplier is ΔGDP/ΔEXP = α/(EXP/GDP).3 The structural vector autoregressive framework with exogenous variables has been used to control for external influences. These exogenous variables are assumed to have both contemporaneous and lagged impact on the endogenous variables without any feedback effect. Therefore, the model can be written in the following structural form equation: G(L)Yt = C(L)Xt + et Where G(L) and C(L) represent matrix polynomials in the lag operator L for vectors of endogenous variables (Yt) and exogenous variables (Xt). et is a vector of structural disturbances. Among the endogenous variables, we include expenditure, growth in GDP (GGDP) and tax revenue (TX)4 while the call money rate (CMR) representing the monetary policy stance, output gap (OG) and world GDP growth (WGDP) are included as exogenous variables.5 In the identification procedure, government expenditure ordered before GDP growth and tax revenue receipts. The main purpose of SVAR estimation is to obtain non-recursive orthogonalisation of the error terms for impulse response analysis. To identify the orthogonal (structural) components of the error terms, enough restrictions need to be imposed. Accordingly, we allow contemporaneous effect of only (i) increase in expenditure on GDP growth and (ii) GDP growth on tax revenue as is often expected in theory and practice (See Matrix A below). The relationship between the structural and reduced forms of system (p lags) can be written as:  Thus, the relationship between the structural shocks and the reduced form shocks is given by: ut = A−1et et = A ut Here ut is the observed (or reduced form) residuals and et is the unobserved structural innovations. To obtain the structural disturbances et from estimation of the VAR’s innovations ut, elements of matrix A (containing the contemporaneous relationships among the endogenous variables) are identified. We have restricted A matrix as a lower triangular matrix with ones on the main diagonal. In matrix form, it can be written as:  After identifying the elements of A matrix, it is possible to proceed with the analysis of the dynamic response of Yt to each shock in et. As monetary policy stance, proxied by call money rate, is expected to have impact on GDP in the short-run, it has been included among the set of exogenous variables albeit it is difficult to prejudge its impact on fiscal policy variables. However, it is generally expected that expansionary fiscal policy combined with accommodative monetary policy can have significant multiplier effects on the economy. The rationale behind using output gap is that if growth remains below the potential, it can impact the endogenous variables, viz., government expenditure, GDP and tax revenues.6 In fact, the literature suggests that size of the multiplier is bound to vary with economic conditions. For an economy operating at its potential level, any increase in government spending would just replace spending elsewhere and hence the multiplier effect may be either low or zero. In contrast, during period of negative output gap, workers and operating capacity remain underemployed, a fiscal boost can increase overall demand and hence higher multiplier. Similarly, it is assumed that global GDP growth can also influence endogenous variables contemporaneously. Since a major portion of combined expenditure is undertaken by the State governments, the multiplier effect has also been examined separately for the Central and the State governments. For lag length selection, information criteria, viz., the Akaike Information Criteria and Schwartz Information Criteria have been used which suggest a lag of two to six for various equations. However, in order to conserve degrees of freedom, a lag length of two to three is used in most of the equations. Wherever the optimum lag length criterion suggests large number of lags, we dropped higher order of lags largely keeping in view their respective statistical significance. IV. Empirical Analysis As stated in the previous section, expenditure multiplier effect is estimated using Structural VAR analysis. It shows that one per cent increase in combined expenditure of Centre and States has an impact of around 0.11 per cent on GDP which implies an impact multiplier of 0.59, if the historical average of real aggregate expenditure to real GDP ratio of 0.18 (or 18.3 per cent) is assumed (Table 1 and Chart 1). The impact multiplier is also the peak multiplier, as in the subsequent years, the combined expenditure seems to have a negative impact on GDP. In other words, the combined government expenditure, heavily dominated by revenue expenditure, does not show any positive impact on GDP in the medium and long run. As far as the multiplier effect of various components of government expenditure is concerned, it varies a lot across various categories of expenditure. As expected, the multiplier effect of revenue expenditure at 0.37 is seen only in the short-run as impulse response goes below the baseline in the second year itself (Chart 2). It perhaps implies a rapid crowding out of private demand component. In contrast, the impact multiplier of capital outlay is much higher than the revenue expenditure at 1.29, with a peak of around 3.56 in the fourth year after the shock. However, the size of multiplier for non-defence capital outlay is still higher at 1.81 than the overall capital outlay and the effect prolongs upto three years (Charts 3 and 4). The larger size of multiplier for capital outlay confirms that public expenditure allocated for investment has a larger growth inducing impact than that used for consumption. Interestingly, the size of combined development expenditure multiplier is smaller than that of capital outlay as it mainly comprises revenue expenditure (around 79 per cent). It is found that size of expenditure multiplier at Central and States level varies significantly (Table 1 and Appendix Charts 1 to 9). Lower expenditure multiplier at the Central level perhaps confirms the argument made in the literature that local government spending generates higher expenditure multiplier as investment projects are of relatively smaller scale, and are managed locally and, therefore, have lower gestation lags than projects of higher level of government. In the case of India, one per cent increase in total spending by the Central government leads to 0.04 per cent increase in GDP leading to a multiplier of 0.4, given the central expenditure-GDP ratio at an historical average of 0.11 (or 11 per cent). In contrast, one per cent increase in aggregate expenditure by the State governments has an incremental impact of 0.11 per cent, thereby leading to a multiplier of 1.07, given the state expenditure-GDP ratio at a historical average of 0.11 (or 11 per cent of GDP).7 However, in both the cases, the impact of spending dissipates immediately after the first year as evident from declining impulse response. The size of revenue expenditure multiplier is lower than that of capital outlay both at the Central and the State level.8 Low revenue expenditure is broadly consistent with a priori expectation that increases in government consumption are less persistent as the impact dies out immediately after the first year. Revenue spending by the State governments is, however, found to be more effective than that of the Central government. One per cent increase in revenue spending by States increases GDP by 0.05 per cent (implying a multiplier of 0.6 with SRE-GDP ratio of 0.08 or 8 per cent), the same at the central level leads to 0.02 per cent increase in GDP, implying a multiplier of 0.19 with CRE-GDP ratio of 0.07 (or 7 per cent of GDP). Similarly, capital outlay of the State government is also found to be more growth inducing than the Central government (Table 1 and Chart 5). The size of capital outlay multiplier at State level is 2.13, which is significantly higher than 0.39 estimated for the Central government. While the revenue expenditure impacts GDP in the current year, the capital outlay tends to have a prolonged impact on GDP. The accumulated impact of a positive shock in capital outlay of the Central government peaks in the fourth year and the cumulative peak multiplier works out to 0.85. For states’ capital outlay, the cumulative peak multiplier effect is evident in the third year and is estimated at 7.61. After the third year, the incremental impact of positive shock in States capital outlay becomes almost negligible. One of the reasons for low multiplier effect of Centre’s capital outlay may be its composition dominated by defence capital expenditure. Since 2000-01, defence capital expenditure constituted about 52 per cent of Centre’s capital outlay. It is found that an unanticipated positive shock to Centre’s non-defence capital outlay has higher multiplier effect (2.10) than overall capital outlay corroborating the fact that non-defence capital outlay is more growth inducing. The cumulative impact of Centre’s non-defence capital outlay peaks in the fifth year with total multiplier effect of 5.88 before gradually declining to the baseline. Since the Centre’s non-defence capital outlay accounts for mere 5.6 per cent of its total expenditure (3.2 per cent of combined expenditure of both Centre and States), the present composition of centre’s expenditure may not have long-lasting impact on GDP. Even though the States’ capital outlay has the highest multiplier effect on GDP, its share in combined expenditure is only 6.7 per cent (an average of 1980-81 to 2011-12). With a lower share of capital outlay in combined spending of Central and State governments, the growth impact of an increase in capital outlay is understandably quite low. High multiplier in case of local spending than that at the federal level is generally observed in literature. For instance, Serrato and Philippe Wingender (2010) found a multiplier of more than 6 for local spending by some counties/ States in the US. High value of multiplier for non-defence capital outlay/total capital outlay appears to be consistent with the literature. For instance, Aschauer (1990) estimated a value of 4 for infrastructure spending by the US government during 1945-85 period. Another study by Baxter and King (1993) estimated that long run multiplier effect of public investment could be as high as 8.0 under a scenarios of high productivity which could go upto 13.2, if inputs adjustments (labour and capital) in private sector are also taken into account. Similarly, Perroti (2006) found multiplier (including long-term transfers) to be more than 5 for government’s capital spending in case of Germany for period of 1960-89. Higher multiplier effect for capital outlay is expected in capital deficient countries like India where marginal returns on additions to capital stock are supposed to be high. Furthermore, expenditures on infrastructure have a positive complementary effect on private investment. It implies that greater availability of public infrastructure improves the long-term productive capacity and productivity of the private sector. In contrast, revenue spending, even if it is on public services, is generally once-for-all expenditures with smaller output effects. Development expenditure9 which accounts for nearly 57 per cent of total expenditure shows a multiplier of 1.0. However, development expenditure by the Central government seems to have a far lower impact on GDP than that by States (Table 1 and Chart 6). It is important to note that the proportion of capital outlay in development expenditure is higher in the case of State governments (26 per cent) than the Central government (20 per cent). Furthermore, since the size of multiplier of both revenue expenditure and capital outlay is higher in the case of State governments, higher development expenditure multiplier for State governments appears to be plausible. Most of the developmental capital outlay at both levels of governments (more than 80 per cent) is towards providing economic services, viz., agriculture and allied activities, food storage, rural development, irrigation, energy and transport. Expenditure on economic services is expected to have higher impact on GDP as compared with social services. However, the lower size of multiplier for combined development expenditure as compared with capital outlay is on expected lines as most of the development expenditure is incurred in the form of revenue expenditure. Impulse response functions of various categories of expenditure at the Centre and the State level are provided in Appendix Charts 1 to 8. Higher expenditure multipliers found in case of State governments than the Central government may reflect the quality of expenditure which is found to be better in case of former than the latter.10 Non-committed expenditure incurred by the States is two-third of the total revenue expenditure while it is close to one-half in case of the Centre. In fact, during the period of analysis, besides central assistance and grants to States, other major categories of less productive revenue expenditure are defence services, subsidies and interest payments which constitute nearly 57 per cent of Centre’s total revenue expenditure. Further, States may be involved in more efficient utilisation of expenditure than by the Central government which can be explained by the theory of decentralisation propounded by Oates. The ‘Decentralization Theorem’, formulated by Oates (1972) states: “For a public good – the consumption of which is defined over geographical subsets of the total population, and for which the costs of providing each level of output of the good in each jurisdiction are the same for the Central or for the respective local government – it will always be more efficient (or at least as efficient) for local governments to provide the Pareto-efficient levels of output for their respective jurisdictions than for the Central government to provide any specified and uniform level of output across all jurisdictions”. Oates (1972) further suggests “each public service should be provided by the jurisdiction having control over the minimum geographic area that would internalise benefits and costs of such provision”. The above principle, known as ‘subsidiarity’ is based on the foundation that decentralization and financial autonomy, access to local knowledge facilitates efficient allocation of public resources as per public preferences for services. As far as consistency and robustness of control variables like call money rate as monetary policy variable, output gap and world GDP growth is concerned, these variables showed expected signs in most of the equations. For instance, the coefficient of CMR exhibits a negative and statistically significant sign implying tightening of monetary policy adversely impacts GDP growth. Similarly, the positive sign of WGDP shows that robust world growth has a salutary impact on domestic growth albeit the coefficient is not statistically significant in some equations. However, the impact of output gap on government expenditure is found to be somewhat ambiguous. The increase in government expenditure in response to output gap (i.e., actual below potential) was observed only in few equations. As was expected, in most of the equations, a positive shock in tax collection leads to a negative impact on GDP growth, albeit with varying lags in subsequent years, implying a theoretically plausible negative tax multiplier. The size of tax multiplier at aggregate level is found to be in the range of 0.1 to 0.5 and confirms the empirical regularity that tax multipliers are generally less than the expenditure multiplier. V. Policy Implications and Conclusion Our results indicate that the size of the government expenditures multiplier varies with the type of expenditures undertaken by the government. As expected, the revenue expenditure multiplier in India works only in the short-run and is found to be lower than the overall multiplier. In contrast, the output effect of increase in capital outlay is found to be higher and more prolonged than other categories of expenditure. It may be noted that during the period of global financial crisis, the Central government undertook an additional expenditure amounting to 3.0 per cent of GDP as part of fiscal stimulus package during October-December 2008 and February 2009 (RBI Annual Report, 2008-09). Of the expenditure measures, revenue expenditure constituted around 84 per cent and the capital component accounted for the rest. On the whole, the fiscal stimulus measures appeared to have supported consumption demand rather than investment demand. Given the size of multiplier estimated for revenue expenditure and non-defence capital outlay and their respective share in fiscal stimulus during 2008-09, the overall size of multiplier is estimated around 0.5.11 We have also observed that expenditure multipliers in the case of States are larger than that of Centre. This could be attributed to the fact that while Centre’s expenditure is thinly spread over a large number of programmes and large areas of the country, expenditure by States is more focused. Another reason could be that spending by the Central government leads to higher crowding out effect than the State governments through the interest channel and confidence effects. It appears convincing as the level of Centre’s gross market borrowings is often many times larger than that of all States (on average 5.5 times of all States’ market borrowings during 1980-81 to 2011-12). Further, unlike the Central government, State governments borrowings are subject to a lot more discipline as the incentives for them are increasingly linked to fiscal prudence. In fact, the crowding-out hypothesis is found to be valid for many countries (e.g., Alesina et al, 2002). It is generally argued that unless the economy generates enough additional saving, higher government spending through higher market borrowing may put upward pressure in market interest rate and thereby rendering some private investments less feasible. In the process, output loss due to lower private investment may cancel out some of the expansionary effects of higher government spending. However, the hypothesis - whether crowding-out effect of government expenditure differs in case of Centre and States - needs further empirical verification in case of India. Overall, our results are broadly consistent with the notion for developing countries that the contemporaneous impact of overall government expenditure on output is smaller and less persistent than in developed countries. Empirical results point towards some important policy implications. First, higher multiplier of capital outlay emphasises the need for improving the composition of expenditure both at the Centre and States’ level. The combined capital outlay accounted for just 13 per cent of combined expenditure of Central and State governments during the sample period. In fact, the share of capital outlay in combined expenditure has declined to 11.7 per cent during the post-reform period (from 15.6 per cent during 1980s), which needs to be gradually increased over the years. Perhaps such strategy would augur well for successful fiscal consolidation process at both levels of the government. Results show that non-defence capital outlay can act as a key driver of growth. Higher output effects of non-defence capital outlay also have implications for fiscal stimulus packages designed at the time of crisis. Fiscal stimulus packages with greater focus on investment spending would induce faster recovery. Second, lower multiplier effect of all major categories of expenditure of the Central government points towards better decentralisation of government expenditure. Given that the rule based fiscal policy has been adopted across the State governments in India, giving more expenditure powers through greater decentralisation of resources may have more output effects as compared to the Centre. Higher multiplier effects of fiscal decentralisation have been observed in the case of other developing countries as well. Perhaps the same argument is made in the Chaturvedi Committee on Restructuring of Centrally Sponsored Schemes noting that if the number of centrally sponsored schemes is brought down, then this may have a higher welfare impact on the society (Planning Commission, 2011). To begin with, decentralisation of spending responsibilities could be tried in those sectors where it is feasible and States can be held accountable. Third, development expenditure is heavily dominated by the revenue expenditure (79.3 per cent during period of analysis). Pattern of this category of expenditure also needs to be gradually balanced in favour of non-defence capital outlay. Fourth, the empirical results on size of multipliers seem to indicate that fiscal consolidation through increase in tax revenue rather than reduction in expenditure may have less contractionary effect on GDP. In fact, fiscal consolidation through retrenchment in government spending at best can be a gradual process in a developing economy like India where social equity is still a distant goal to be achieved. Instead, the fiscal consolidation can begin with efforts to strengthen the revenue side through increases in less distortionary taxes while expenditure retrenchments can be undertaken over the medium run in a more gradual manner. Such policy strategy will facilitate not only pursuing fiscal consolidation process successfully without hampering growth but also help restoring fiscal space in the medium term. With adequate fiscal space in place, the fiscal authorities would be better prepared to come out of potential downswings in the economy. Emphasis on revenue side by undertaking tax measures and ensuring an efficient tax structure, wider tax base, sound tax governancen and a better design of various categories of taxes, in fact, are already being envisaged under the proposed reforms in form of the Direct Taxes Code and Goods and Services Tax. As the economy gains sustained momentum, the process can be taken forward by carefully undertaking adjustments on expenditure side of fiscal policy. To sum up, the variation in the size of the fiscal multiplier for various categories of expenditure is consistent with a priori expectations. The findings assume importance particularly when the need for the government is to carry forward the fiscal consolidation process without hampering growth prospects. Better allocation of expenditure is also necessitated by Central government’s policy to eliminate the effective revenue deficit by 2014-15. Towards this end, the size of various categories of expenditure multiplier can provide a broad guidance for defining the overall composition of government expenditure. Finally, we are well aware that the sample period might have masked some important structural changes in the economy which could have implications for estimated size of multiplier. Thus, for policy purpose, estimated multipliers can at best be construed as average multiplier impact of various categories of expenditure on GDP. @ Rajeev Jain (Emial) is an Assistant Adviser and Prabhat Kumar (Email) is a Research Officer in the Department of Economic and Policy Research, Reserve Bank of India, Mumbai. 1 The authors are grateful to Shri B. M. Misra (Officer-in-Charge, DEPR), Smt. Balbir Kaur (Adviser), D. Bose (former Director, DEPR) and Jeevan Kumar Khundrakpam (Director, MPD) for their constant encouragement and valuable guidance. The views expressed in the paper are those of the authors and do not necessarily represent those of the institution to which they belong. 2 In the absence of credible quarterly data on fiscal variables for a long period, yearly data were preferred. 3 Similar methodology was used by Espinoza and Senhadji (2011). 4 For centre and States, tax variable is represented by CTX and STX, respectively. 5 In most equations, the output gap was used as exogenous variable with one lag. 6 It is quite possible that actual GDP growth persistently may remain below potential growth for a few years. In that case, one or two years lag of GDP variable may not be appropriate to capture the response of endogenous variables to output gap even if it is assumed that previous year’s growth represents potential growth. Therefore, it is important to use output gap as control variable. 7 Notwithstanding the gradual uptrend in States’ expenditure as a ratio to GDP observed over the years, the historical average for centre’s and States’ expenditure as ratio to GDP is same. 8 Overall multiplier effect of Central government expenditure is higher than the multiplier effect of revenue expenditure and capital outlay. It may be due to the fact that overall expenditure also includes other forms of capital expenditure other than the capital outlay. Based on average of 1980-81 to 2011-12, it is estimated that capital outlay accounted for only half of the capital expenditure. It implies that other form of capital expenditure also have GDP inducing effect which, in fact, seems to be higher than the capital outlay. It is quite possible that repayment of government borrowing and loans to banks, constituting other forms of capital expenditure, may be boosting private investment which, in turn, leads to higher GDP. 9 Developmental expenditure mainly comprises spending on social Services (e.g., education, sports, art and culture, medical and public health, family welfare,, water supply and sanitation, housing urban development, etc.) and economic services (e.g., agriculture and allied activities; rural development; special area programmes; irrigation and flood control; energy; industry and minerals; transport and communications; roads and bridges and science, technology and environment, etc.). 10 In this context, one needs to recognise that in the past few years, the transfers to States and other developmental expenditure have grown significantly. Although such expenditure is classified as revenue expenditure at the central level, a significant part of these transfers may be provided for creation of capital assets at the State level (see Union Budget 2011-12). However, time series disaggregated data is not available for analysis. 11 Weighted multiplier effect = Share of RE *MULRE + Share of capital outlay * MULNDCO =0.84*0.19+0.16*2.1 = 0.5 References: Alesina, A., Ardagna S, Perotti R. and Schiantarelli F. (2002). “Fiscal Policy, Profits and Investment”, The American Economic Review, Vol.92, No.3: 571-89. Aschauer, David A. (1990). “Is Goverment Spending Stimulative?”, Contemporary Economic Policy, Vol 8, Issue 4. Barro, Robert J. and Charles J. Redlick (2009). “Macroeconomic Effects from Government Purchases and Taxes," NBER Working Paper No. 15369. Baxter, M. and R. G. King (1993). “Fiscal Policy in General Equilibrium,” American Economic Review, Vol. 83, No.3: 315–334, June. Blanchard, Olivier, and Roberto Perotti (2002). “An Empirical Characterization of the Dynamic Effects of Changes in Government Spending and Taxes on Output,” Quarterly Journal of Economics, Vol. 117, pp. 1329–68. Brückner, Markus and Anita Tuladhar (2010). “Public Investment as a Fiscal Stimulus: Evidence from Japan’s Regional Spending During the 1990s,” IMF Working Paper No. WP/10/110. Bryant, Ralph, Dale Henderson, Gerald Holtham, Peter Hooper, and Steven Symansky (1988). Empirical Macroeconomics for Interdependent Economies, Supplemental Volume (Washington: Brookings Institution). Caldara, Dario and Christophe Kamps (2012). “The Analytics of SVARs: A Unified Framework to Measure Fiscal Multipliers,” Finance and Economics Discussion Series 2012-20. Castro, Gabriela; Ricardo M. Felix; Paulo Julio and Jose R. Maria (2013). “Fiscal multipliers in a small euro area economy: How big can they get in crisis times?”, Bank of Portugal Working Papers 11|2013. Christiano, Lawrence, Martin Eichenbaum and Sergio Rebelo (2009). “When is the Government Spending Multiplier Large?," Journal of Political Economy, Vol. 119, No. 1, pp. 78–121. Cogan, John F., Tobias Cwik, John B. Taylor, and Volker Wieland (2009). “New Keynesian versus Old Keynesian Government Spending Multipliers,” NBER Working Paper No. 14782 March 2009. Corsetti, Giancarlo, Andre Meier, and Gernot J. Müller (2012). “What Determines Government Spending Multipliers?,” IMF Working Paper No. WP/12/150 Devereux, Michael B. (2010). “Fiscal Deficits, Debt, and Monetary Policy in a Liquidity Trap," Central Bank of Chile Working Paper No. 581. Espinoza, Raphael and Abdelhak Senhadji (2011). “How Strong are Fiscal Multipliers in the GCC? An Empirical Investigation,” IMF Working Paper No. WP/11/61. HM Treasury (2003). “Fiscal Stabilization and EMU,” HM Treasury Discussion Paper, London. Ilzetzki Ethan, and Carlos Végh (2008). “Procyclical Fiscal Policy in Developing Countries: Truth or Fiction?,” NBER Working Paper No. 14191 (Cambridge, Massachusetts: NBER). Ilzetzki, Ethan, Enrique G. Mendoza and Carlos A. Végh (2011). “How Big (Small?) are Fiscal Multipliers?,” IMF Working Paper No. WP/11/52. International Monetary Fund (2008a). “Global Economic Policies and Prospects,” Group of Twenty Meeting of the Ministers and Central Bank Governors March 13–14, 2009 (London). International Monetary Fund (2008b), World Economic Outlook (Chapter 5), October. Jha, Sikha, S. Mallick, D. Park and P. Quising (2010). “Effectiveness of Countercyclical Fiscal Policy: Time-Series Evidence from Developing Asia”, ADB Economics Working Paper Series No. 211. Laxton, Douglas (2009). “Effects of Fiscal Stimulus in Structural Models,” available at http://www.imf.org/external/np/seminars/eng/2009/fispol/pdf/laxton.pdf Mountford A., and H. Uhlig (2008). “What are the Effects of Fiscal Policy Shocks?,” NBER Working Paper No. 14551 (Cambridge, Massachusetts: NBER). Oates, W. E (1972). Fiscal Federalism, New York: Harcourt Brace Jovanovich. Perotti, R. (1999). “Fiscal Policy in Good Times and Bad," The Quarterly Journal of Economics, Vol. 114, 1399-1436. Perotti, Roberto (2005). “Estimating the Effects of Fiscal Policy in OECD Countries,” CEPR Discussion Paper No. 4842, Centre for Economic Policy Research: London. Perotti, Roberto (2006). “Public Investment and the Golden Rule: Another (Different) Look,” IGIER Working Paper No. 277 (Milan: Bocconi University Innocenzo Gasparini Institute for Economic Research). Perotti, R (2007). “In search of the transmission mechanism of fiscal policy”, NBER Working paper 13143. Planning Commission (2011). Report of the Committee on Restructuring of Centrally Sponsored Schemes (Chairman: B.K. Chaturvedi), September. Reserve Bank of India (2012). Handbook of Statistics on the Indian Economy, 2011-12. Reserve Bank of India (2009). Annual Report, 2008-09. Romer, Christina, and David Romer (2010). “The Macroeconomic Effects of Tax Changes: Estimates Based on a New Measure of Fiscal Shocks,” NBER Working Paper No. 13264. Serrato, Juan Carlos Suárez and Philippe Wingender (2010). “Estimating Local Fiscal Multipliers”, Department of Economics, University of California, available at ceg.berkeley.edu/students_9_2583495006.pdf Sims, Christopher A. (1986). “Are Forecasting Models Usable for Policy Analysis?” Federal Reserve Bank of Minneapolis Quarterly Review. Winter, Vol. 10, No. 1, pp. 2–16. Spilimbergo Antonio, Steve Symansky, Olivier Blanchard, and Carlo Cottarelli (2008). “Fiscal Policy for the Crisis,” IMF Staff Position Note, SPN/08/01 (Washington: International Monetary Fund). Spilimbergo Antonio, Steve Symansky, and Martin Schindler (2009). “Fiscal Multipliers,” IMF Staff Position Note, SPN/09/11 (Washington: International Monetary Fund). Turrini, Alessandro, Werner Roger and Istvan Pal Szekely (2010). “Banking Crisis, Output Loss and Fiscal Policy," CEPR Discussion Paper No. 7815. Yadav Swati, V. Upadhyay, Seema Sharma (2012). “Impact of Fiscal Policy Shocks on the Indian Economy,” Margin: The Journal of Applied Economic Research, Vol.6 No.4. pp. 415-444. 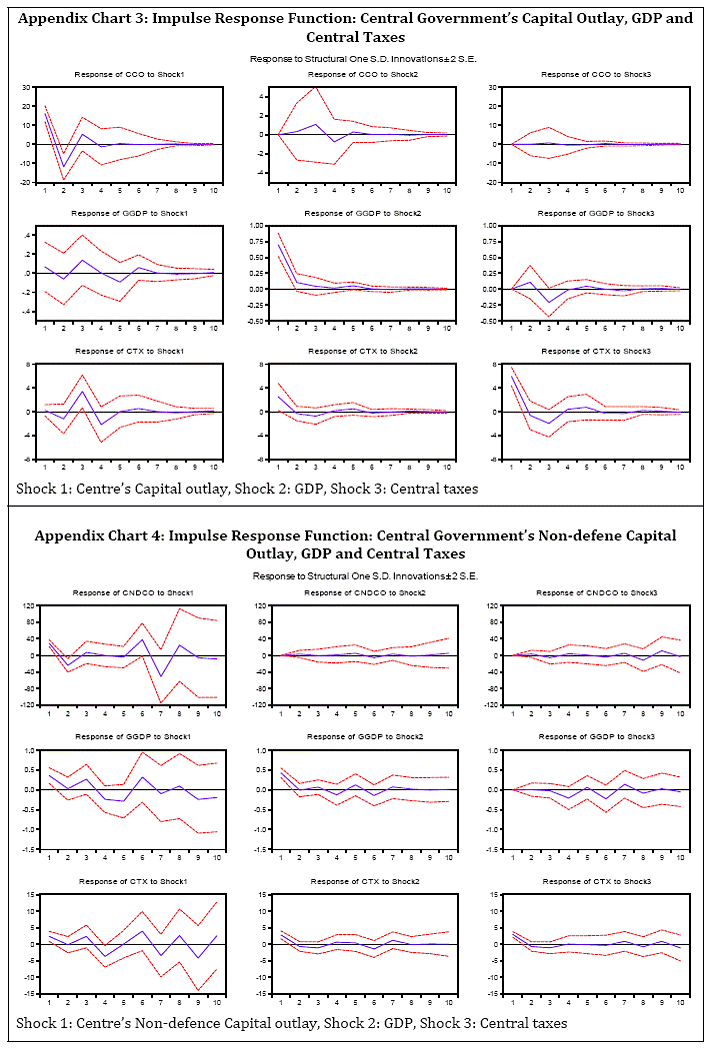 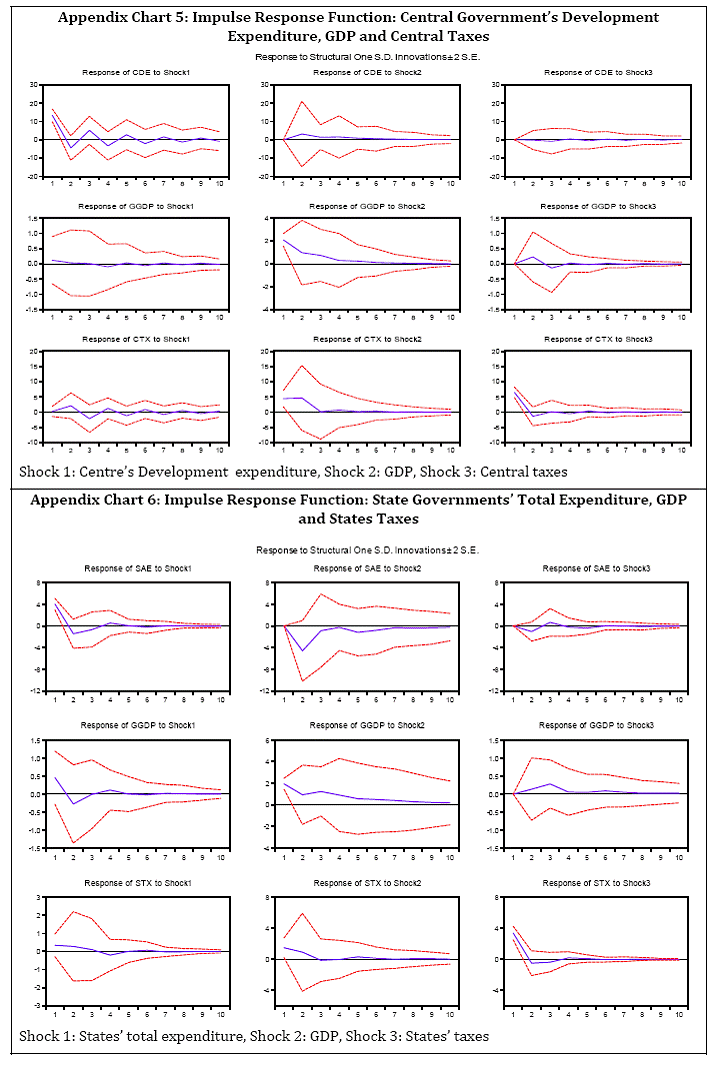 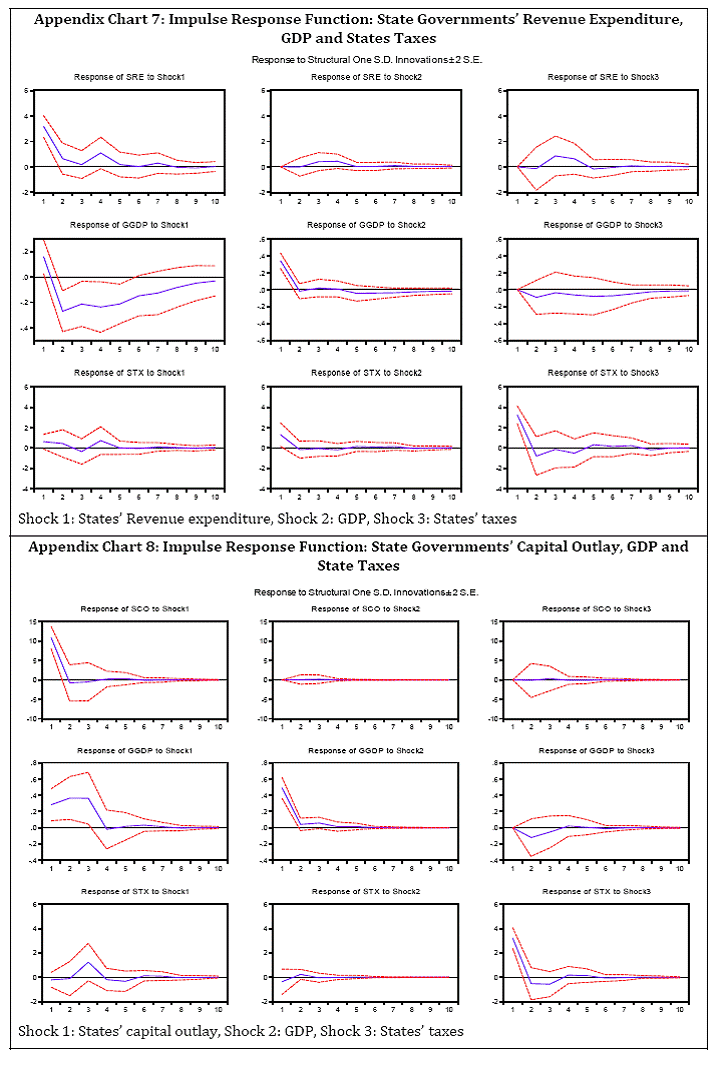 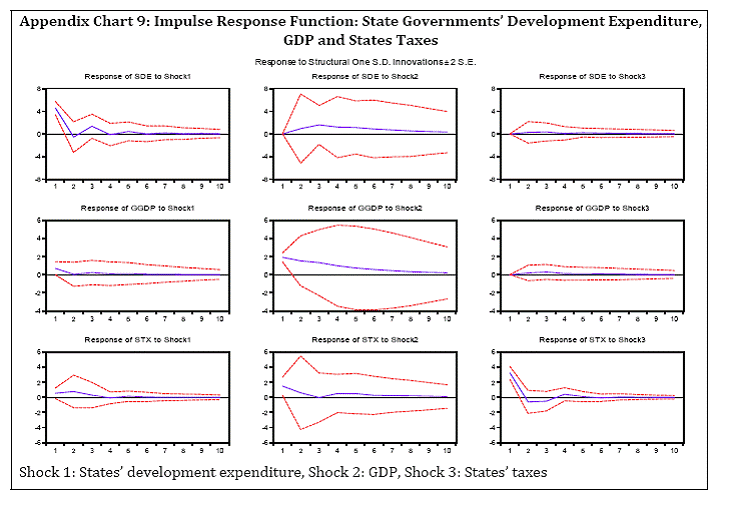 |
പേജ് അവസാനം അപ്ഡേറ്റ് ചെയ്തത്:


