 IST,
IST,


Economic Capital Framework of the Reserve Bank of India – Internal Review of the Framework
|
Select Abbreviations and Definitions
Select Definitions in the context of RBI’s ECF:
1. The extant ECF (adopted in 2019 based on recommendations of the Expert Committee to Review the Extant ECF of RBI) has been reviewed in view of the Committee’s recommendation that the ECF may be reviewed every five years. Overview of macroeconomic environment during last 5 years 2. The macroeconomic environment has been challenging owing to the pandemic, elevated global public debt, persistent inflation, rapid monetary tightening by central banks, volatility in financial markets, prolonged geopolitical tensions and geo-economic fragmentation. Impact of central bank policy actions on their balance sheets (B/S) 3. Central banks adopted accommodative monetary policy in response to the pandemic, leading to expansion in their B/S size and concomitant B/S risks, followed by aggressive and rapid tightening, owing to persistent inflation. This resulted in many central banks reporting negative net interest income due to materialisation of repricing risk on account of asset liability maturity mismatch, besides suffering valuation losses on their securities’ portfolio, underscoring the need to maintain a robust capital position. Review of the extant ECF 4. Despite the adverse macroeconomic developments and other challenges mentioned above, the Bank’s prudent Accounting Policies1 and the ECF have enabled RBI to augment its financial resilience, while also ensuring healthy transfer of surplus to the Government, at a time when many central banks have reported net losses, depleted their equity and suspended surplus transfers. Besides, consistent implementation of a rule-based, publicly disclosed ECF has helped build stakeholder confidence and trust in commitment towards maintaining Bank’s financial resilience. Summary of proposed recommendations 5. As the ECF has broadly met its objectives, despite adverse external developments, the review proposes continuation of the broad principles underlying the extant ECF, and no major changes in risk assessment methodologies. However, the review highlighted that the transfer of surplus to the Government has not been as stable as was desirable. Besides, certain risk sources that were not included in the current framework as they were not significant, have now gained in importance and merit inclusion. Accordingly, the major recommendations of the review are indicated below. Market risk 6. Major recommendations on the assessment of capital requirement for market risk are listed below: (i) While the requirement of economic capital for market risk may continue to be assessed using Expected Shortfall (ES) under stressed conditions, it is proposed to provide flexibility2 to the Central Board to maintain market risk buffers at any desired resilience level within the range of ES at 99.5% Confidence Level (CL) and ES at 97.5% CL. (ii) An integrated approach may be adopted, wherein the off-balance sheet portfolio is also considered, together with the on-B/S portfolio, while computing market risk buffer requirement. (iii) The requirement for market risk buffers may include Foreign Currency Assets (FCA) exposure in minor currencies. (iv) While computing market risk buffer requirement using Expected Shortfall, the variance-covariance (VC) matrix of price returns may be computed directly, rather than indirectly via transformation of VC matrix of yield returns. Credit risk and operational risk 7. Economic capital for credit risk (including on account of OFBS exposures) and operational risk may continue to be maintained as hitherto. Monetary and financial stability risk 8. Currently, the buffers are maintained at the resilience level decided by the Central Board, subject to a range of 4.5% - 5.5% of B/S size. 9. In this regard, while the challenges from the global macroeconomic environment and geopolitical developments amplify the need for maintaining an optimal level of realized equity to credibly discharge the Bank’s mandate, the resilience demonstrated by the Bank in recent years despite the pandemic and its aftermath, reinforces the Bank’s ability to manage monetary and financial stability risks effectively. 10. Further, the implementation period of the extant ECF has seen considerable volatility in the transfer of surplus to the Government, as indicated by a Coefficient of Variation (CV) of 63.30 per cent3. It is observed that the existing range of 1.0 per cent provides very limited flexibility to the Central Board to smoothen the transfer of surplus to the Government. 11. In view of the above, it is proposed to widen the applicable range of buffer requirement for monetary and financial stability risks to 5.0 ± 1.5 per cent, with the objective of providing adequate flexibility to the Central Board in determining the buffers, taking into account the prevailing macroeconomic and other factors, while also smoothening the transfer of surplus to the Government. Requirement of Realized Equity 12. The Contingent Risk Buffer (CRB), which provides for monetary and financial stability risks, credit risk, and operational risk, would, thus, be maintained within a range of 6.0 ± 1.5 per cent of the B/S size (as against the level of 6.5 per cent, with lower bound of 5.5 per cent under extant ECF). The Requirement of Realized Equity (RRE), would include the CRB and shortfall, if any, in revaluation balances, vis-à-vis the requirement for market risk buffers at the resilience level determined by the Central Board. Surplus Distribution Policy (SDP) 13. The Surplus Distribution Policy (SDP) may continue to treat revaluation balances as non-distributable, while imparting primacy to bolstering RBI’s financial resilience to the desired level, with the residual net income being available for transfer to the Government. Further, the clause applicable in case of Available Realized Equity (ARE) being short of the lower bound of RRE has been made comprehensive by requiring that appropriate risk provisioning may be made by RBI to augment ARE to ‘at least’ its lower bound. The clause has been expanded to state that in case net income is inadequate to augment ARE to its lower bound, no surplus will be transferred (including in subsequent years) till at least the lower bound is achieved. The excess realized equity, i.e., ARE in excess of RRE, shall be written back from Contingency Fund (CF) to income at the time of finalization of Annual Accounts. Impact of Recommendations 14. An analysis of risk provisioning as on March 31, 2025, under the extant and revised ECF, considering buffers for monetary and financial stability risks within the proposed range of 5.0 ± 1.5 per cent of the B/S size, is given in Table A below: 15. The impact of the proposed recommendations on risk provisioning and surplus transferable over the previous years, considering the buffers for monetary and financial stability risks being maintained within the proposed range of 5.0 ± 1.5 per cent of the B/S size, is placed in Table B below.
1 Extant Economic Capital Framework 1.1 The extant Economic Capital Framework (ECF) was adopted by the Reserve Bank of India in August 2019, subsequent to the approval and acceptance of the recommendations of the ‘Expert Committee to Review the Extant Economic Capital Framework of the Reserve Bank of India’ (Chairman: Dr Bimal Jalan) by the RBI Central Board in its 578th meeting held on August 26, 2019. The ECF defines a risk-based economic capital benchmark for the RBI, which provides guidance on risk assessment methodologies, risk provisioning and surplus distribution, keeping in mind the statutory mandate under Section 475 of the RBI Act and the public policy mandate of RBI, along with the international best practices. 1.2 The Expert Committee had recommended that the framework may be periodically reviewed every five years (Para 4.98). Accordingly, a review of the Framework has been carried out. The succeeding section outlines the guiding principles underlying the current ECF as well as its salient aspects. The extant Economic Capital Framework 1.3 The extant ECF of RBI is guided by the principle that the alignment of the objectives of the Government and the RBI is important. As the central bank is a part of the Sovereign, ensuring the credibility of the RBI is as important, if not more, to the Government, as it is to the RBI itself. The ECF also recognises the fact that being a public policy institution, RBI’s focus is on ensuring efficacy of its policy actions, even if such actions entail assuming significant balance sheet risks. Being the primary bulwark for monetary, financial and external stability, RBI’s financial resilience must be commensurate with the statutory responsibilities enshrined upon it, to ensure that RBI is seen as having the financial wherewithal to carry out loss-making policy actions, thereby ensuring their credibility. Box 1.1 outlines the salient aspects of extant ECF. 2 Global macroeconomic environment and its impact on central bank balance sheets 2.1 An analysis of the ECF and its impact on RBI’s balance sheet must be seen in the context of the broader macroeconomic environment in which RBI has operated over the preceding five-year period. The succeeding sections provide a brief overview of the global macroeconomic environment and its impact on central banks’ profitability and balance sheet. I. Global macroeconomic environment and its impact on central bank balance sheets 2.2 The previous five years have seen a period of extremely challenging macroeconomic environment, both on the global and domestic fronts. The period has been marked by several stress events, such as widespread disruptions to the economy and total output owing to the once-in-a-century pandemic, elevated global public debt on account of the pandemic-era expansionary fiscal policies, persistent inflation in the wake of supply chain disruptions, stretched asset valuations amid unprecedented volatility in financial markets, which have been aggravated by prolonged geopolitical tensions and geo-economic fragmentation. 2.3 Central banks adopted accommodative monetary policies as a response to the COVID-19 pandemic, leading to an inordinate expansion in their balance sheets (with concomitant increase in balance sheet risks), followed by aggressive and rapid monetary tightening in the face of persistent inflation. 2.4 The previous few years have seen many central banks reporting losses on an unprecedented scale, primarily on account of the twin-fold materialisation of interest rate risk. One, advanced economy central banks resorted to large-scale asset purchases as a part of quantitative and qualitative easing to maintain adequate liquidity in the financial system and support transmission of monetary policy. The purchase of these long-term fixed coupon assets was funded by creation of short-term reserves, resulting in an asset liability maturity mismatch, prone to repricing risk. As short-term interest rates rose rapidly on account of subsequent monetary tightening by central banks to rein in inflation, the significant increase in interest expense contracted the net interest margin, eventually resulting in a negative net interest income6, 7. Two, central banks with fair value accounting also suffered valuation losses on their portfolio of domestic and foreign securities, as interest rates rose. The impact of these valuation losses on central banks’ profitability was more pronounced in the case of central banks following IFRS 9 accounting standards, wherein valuation gains/ losses are taken to the P&L8, instead of being recorded in the balance sheet (as is the practice at RBI). 2.5 The economic capital frameworks, together with the surplus distribution policy of select Central Banks is presented at Annex I. An assessment of the impact of the macroeconomic environment on central banks’ profitability and equity is presented at Annex II. II. Overview of recent literature on central banks’ capital adequacy 2.6 An overview of the literature suggests the presence of varied views on the role of central bank’s capital, with the case against adequate capital being centred on the ability of central banks to perform their domestic operations regardless of their net worth, as they can issue liabilities (‘print money’), and the fact that as central banks are a part of the government, it is the broader government balance sheet that matters (Anand et al.). A few authors have argued that a central bank’s balance sheet and financial strength do not necessarily have a significant link with inflation (Benecká, S et al.) or its ability to act as an effective Lender of Last Resort (LOLR) and Market Maker of Last Resort (MMLR) (Buiter et al.). However, the case against adequate capital is seen to suffer from a few limitations (Jamie Long et al.), such as, the potential inflationary impact of printing money to meet liabilities denominated in domestic currency, the explicit or implicit constraining of policy choices, the adverse perception of market participants with respect to policy independence and efficacy, and the strain on public finances and central bank independence in the event of a recapitalisation. Further, an overwhelming amount of literature makes a strong case for central banks with a sound capital base being able to deliver better on their policies, as financial strength can support central bank independence and credibility, particularly in signalling to the market that they are ready and able to act swiftly, and without constraint, in response to a crisis. Further, there is a view that central banks, who are also prudential regulators and supervise capital requirements of commercial banks, are better placed to do so if their institution is seen to be financially sound. 2.7 Financial independence, which inter alia includes the availability of a Reserve Fund, the ability to control distributions to the Government and exclude unrealized gains from net profit, has been assessed as the most critical metric (among ten metrics) for central bank autonomy in a survey involving 87 central banks by IMF for development of the Central Bank Independence Index (Tobias Adrian et al.). In fact, central banks of advanced economies (Klaas Knot et al.), despite being issuers of reserve currencies and being subjected to lesser risks from external spill-overs, have recognised the need for maintaining optimal capital and provisions ‘to maintain resilience, to absorb unexpected losses, to adapt to evolving risks, and to effectively fulfil mandates, even in challenging economic conditions’ as well as to maintain ‘public trust in central bank independence’, while noting that capital adequacy should take ‘jurisdiction-specific circumstances into account, as central banks have diverse mandates, operations and sizes’, an approach that is recognised by the ECF as well. III. Scale of balance sheet challenges faced by RBI 2.8 During the Covid 19 pandemic, the policy toolkit adopted by RBI to ensure orderly conditions in the financial markets and transmission of monetary stability, saw the Bank undertake measures such as special liquidity facilities to ease redemption pressure on mutual funds and long-term lending, including targeted lending operations, to ensure that adequate liquidity is channelised to small and mid-sized corporates, microfinance institutions and non-banking financial companies. 2.9 As a result of the aforesaid liquidity extended by RBI along with an increase in CGRA on account of rise in foreign exchange reserves (due to robust capital inflows and cross currency movements) and depreciation in the rupee, the RBI’s balance sheet expanded by 30.02% in FY 2019-20 and at a Compounded Annual Growth Rate (CAGR) of 20.76% during the period June 30, 2019 to March 31, 2021. The aforesaid rate of expansion was much higher than that observed over the preceding 10 years (CAGR of 11.29%) and that projected by the Expert Committee in 2018-19, resulting in increased realized risk provisioning from net income. Further, the subsequent hardening of yields in both foreign and domestic securities, especially during the years 2021-2023, resulted in a decline in IRA balances of almost ₹3.32 lakh crore (equivalent to 5.24% of balance sheet as on March 31, 2023). Incidentally, a subset of the aforesaid period also saw materialization of exchange rate risk, with a decrease in CGRA being observed, partially because of rupee appreciation vis-à-vis the EUR and GBP. The movement in market risk factors over the previous five-year period is depicted in Chart 1. 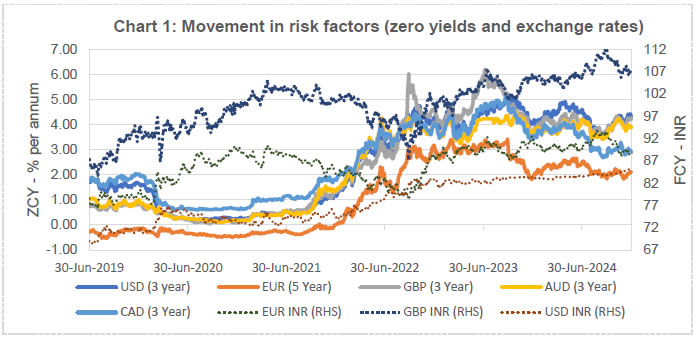 3 Review of the extant Economic Capital Framework 3.1 Despite the adverse macroeconomic developments and movement in risk factors during the review period, a combination of prudent accounting policies, ECF guidelines on provisioning requirements, and a rule-based Surplus Distribution Policy has ensured that RBI’s net income and economic capital levels remain resilient.
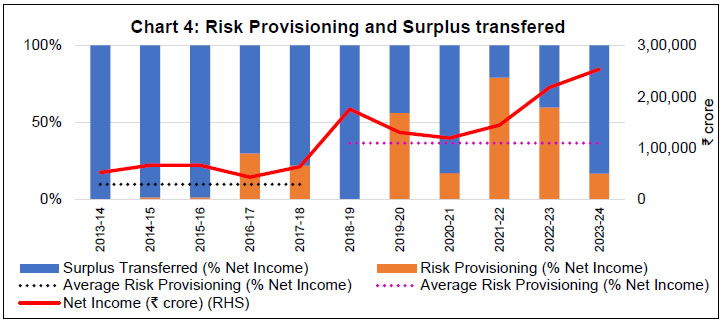
3.2 The robustness of the ECF is evidenced by the fact that RBI has been able to not only maintain its financial resilience but also augment it, at a time when many central banks have reported net losses, and a few have completely depleted their equity. Moreover, RBI has also ensured healthy transfer of surplus to the Government, unlike many central banks, which have had to suspend transfer of surplus to their governments. Several central banks have projected that they may not be in a position to transfer any surplus to their Governments in the ensuing years, as the entire net income/ profit shall have to be retained to recoup the accumulated losses and restore the equity to a targeted level by building buffers. 3.3 Besides, the adoption and implementation of a rule-based, publicly disclosed economic capital framework on a consistent basis has helped build stakeholder confidence and trust in the commitment towards maintaining financial resilience of the Bank. The transparent approach has helped ensure that there are no concerns of arbitrariness in decisions concerning levels of risk provisioning and surplus transfer. 3.4 The evolution of RBI’s total economic capital along with the constituents of realized equity9 and revaluation balances10 during the last 10 years is given in Chart 2 below. It is seen that while revaluation balances (in rupee terms) have broadly followed an increasing trend, revaluation balances as a percentage of balance sheet size have largely followed a cyclical trend with a downward bias, which has been marked by lower highs and lower lows, especially during the last five years. Chart 3 depicts the improved composition of economic capital during the previous five-year period, with realized equity constituting a higher proportion of economic capital as on March 31, 2024, compared to that on June 30, 2019. 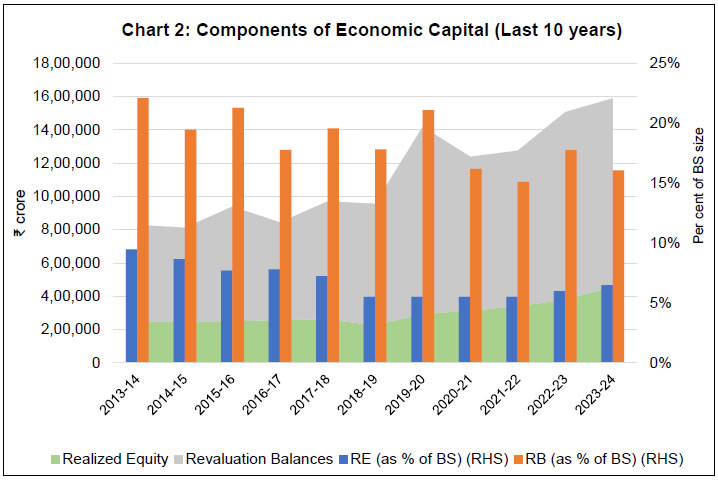 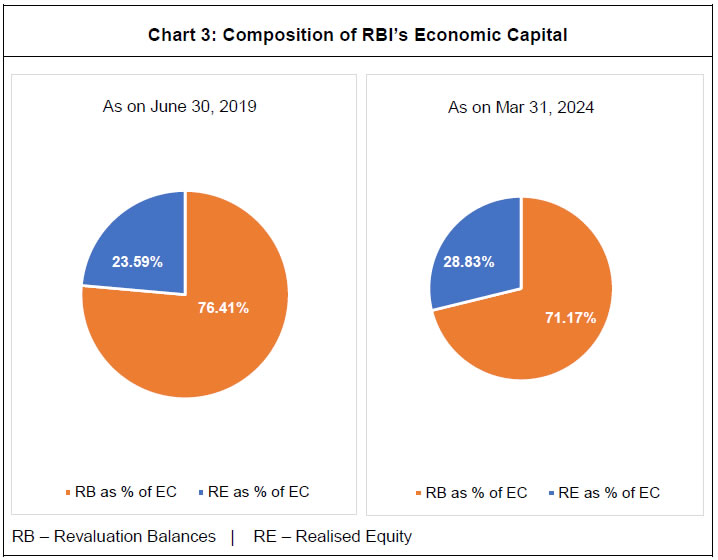 Risk provisioning and surplus transfer to Government (FY 2018-19 to 2023-24) 3.5 Over the period of operationalisation of extant ECF, RBI has, on an average, carried out risk provisioning equivalent to 36.68% of net income, while transferring 63.32% of net income to the Government. Though the average proportion of risk provisioning to net income has been higher than the preceding five-year period, which includes the period of operationalisation of the Malegam Committee recommendations (9.96% of net income) and that projected by the Expert Committee11, the same has been on account of the then unforeseen developments on the domestic and global macroeconomic fronts, including the pandemic and volatility in global financial markets. The segmentation of net income into risk provisioning and surplus transferred to the Government during the last 10 years is summarised in Table 1 and Chart 4 below.
 4 Review of Economic Capital Framework – Recommendations 4.1 The ECF has proven to be robust as it has met its objective of ensuring a resilient balance sheet for RBI, through many historic volatile episodes: (i) the once-in-a-century pandemic, that had a deep negative impact on economic growth and financial markets, not just in India but in every country in the world; (ii) major geo-political disruption, and the sanctions regime that followed as a response, which together are redrawing the contours of global supply chains and capital flows; (iii) the sharpest interest rate tightening by global central banks that the world has seen since the early 1980s, which particularly hurt central bank balance sheets; and (iv) two phases of sharp depreciation of EME currencies, including Indian Rupee. Not only has RBI’s balance sheet came out stronger from these negative episodes, RBI has managed to sustain and actually enhance surplus transfer to the Government during these five years. Therefore, it was felt judicious to continue with the same framework for economic capital recommended by the Expert Committee (Chair: Dr. Bimal Jalan), and adopted by the RBI in the preceding five years, as it has stood the test of extreme adversity. 4.2 Also, since the extant methodologies for market, credit and operational risks are based on global standards, the review proposes no major changes in risk assessment methodologies and the assumptions underlying them, as the same were recommended by the Expert Committee after comprehensive evaluation of available risk methodologies and the appropriateness of their applicability in RBI’s case. 4.3 At the same time, the review considered the experience gained from the operationalization of the current ECF over the last five years, the changes in the asset profile of the Bank’s balance sheet, and the developments in the domestic and global operating environment. Based on the above it highlighted two areas where the framework could be further bolstered to ensure continued alignment with its core objective, as follows:
The recommendations made by the review are presented below. Components of RBI’s economic capital 4.4 Realized Equity and Revaluation Balances may continue to be the twin components of RBI’s economic capital, with the extant principle of one-way fungibility (implying that revaluation balances cannot provide for risks other than market risk, while realized equity can provide for all risks, including market risk) continuing to be applicable. I. Risk parameterisation and Provisioning for market risk 4.5 An analysis of the methodologies used to assess and quantify market risks brings out the fact that Expected Shortfall (ES) continues to be the gold standard. As such, it is proposed that the assessment of market risk buffer requirement for on-balance sheet items may continue to be carried out using a parametric distribution of returns and applying the Expected Shortfall model under stressed conditions. 4.6 The Expert Committee had noted in its report that RBI should put in place a framework for assessing the market risk of its off-balance sheet (OFBS) exposures in view of their increasing significance (Para 4.50). Accordingly, it is proposed that an integrated approach may be adopted, wherein the OFBS portfolio13 is also considered, together with the on-B/S portfolio, while computing the market risk buffer requirement. 4.7 With respect to the choice of reference period, a simulation exercise was carried out to determine the most stressful period for computation of variance-covariance matrix, as part of computation of ES. It is observed that the period ended August 2013 (which was adopted by the extant ECF) continues to be the most appropriate for computation of stress variance-covariance matrix. However, it is proposed that the variance covariance matrix of price returns (which is used for computation of ES) may, henceforth, be computed directly from price returns, instead of the existing process of approximating it by transforming the variance-covariance matrix of yield returns using pre- and post-multiplicative factors. The proposed method would be statistically sound and is observed to result in a marginal increase in the requirement for market risk buffers. This is also followed for management of foreign exchange reserves by the Bank. The other parameters used in the computation of ES were reviewed to ensure their appropriateness, and it is proposed that they may continue to remain the same. The rationale for computing variance-covariance matrix directly from price returns is provided in Annex III. 4.8 The computation of economic capital currently considers only the major currencies in which forex reserves are deployed, along with gold, while computing the requirement for market risk buffers. In this regard, it is proposed that going forward, the requirement of market risk buffers may also consider the deployment of Foreign Currency Assets in minor currencies. 4.9 With regard to the confidence levels (CLs) to be chosen for maintenance of market risk buffers, a review of the existing parameters was carried out in terms of their adequacy under various stress scenarios. Under the extant ECF, the CL of 97.5 per cent was chosen so as to provide adequate protection against a 20 per cent appreciation of Rupee vis-à-vis the USD and 300 bps jump in domestic yields. The CL of 99.5 per cent provided additional (though limited) protection (up to 3.6 per cent of balance sheet) against cross-currency risk, gold price risk, yield risk in foreign securities and forward contracts valuation risks. A similar exercise was carried out as part of the review by considering various scenarios, including the scenario indicated above. Table 2 below illustrates the impact of adverse movement in exchange rates and yield curves on market risk buffers at ES 99.5 per cent (stress) and 97.5 per cent CL (stress), respectively. 4.10 Scenario A assumes shocks similar to those assumed by the extant ECF. Under this, market risk buffers equivalent to ES (stress) 99.5 per cent CL leave a residual buffer of 3.69 per cent of BS size for covering the excluded risks, while market risk buffers equivalent to ES (stress) 97.5 per cent CL are only adequate to meet the assumed shocks. Market risk buffers at ES (stress) 97.5 per cent CL fail to provide adequate protection against adverse movements in risk factors under all other scenarios, while buffers at ES (stress) 99.5 per cent CL provide adequate protection under all scenarios, except Scenarios F, G and H. In view of the inadequacy of buffers at ES (stress) 97.5 per cent CL to provide optimal level of protection to the balance sheet under certain scenarios, it is proposed to introduce flexibility14 to consider additional risk provisioning from Realized Equity/ Net Income (at the time of finalization of Annual Accounts), to augment market risk buffers to the level of resilience decided by the Central Board, within a range of ES at 99.5% CL and ES at 97.5% CL. The aforesaid flexibility to the Central Board would not only help ensure optimal resilience for RBI’s balance sheet to persistent adverse movement in risk factors but also offer the necessary flexibility to see through their transient movements. 4.11 Revaluation balances in excess of their requirement, if any, shall, by virtue of being unrealized gains, continue to be on the B/S for meeting market risks and will not be available for distribution. The impact of the proposals on the requirement of risk buffers for market risk over the last five years is detailed in Annex IV. II. Provisioning for credit risk and operational risk 4.12 The assessment of economic capital requirement for credit risk (including on account of OFBS exposures) and operational risk may continue to be carried out as hitherto. The requirement for economic capital, assessed as above, has remained around one per cent of the B/S size. Accordingly, it is proposed that the implicit combined requirement of realized equity for credit risk and operational risk at one per cent of B/S size may continue to be maintained, in line with the extant framework. III. Provisioning for monetary and financial stability risks 4.13 The ECF recognizes financial stability risks as the rarest of rare fat tail risks, the occurrence of which can potentially devastate the economy, and the concomitant responsibility on central banks, including RBI, to safeguard financial system stability. This may include measures such as providing emergency liquidity assistance, even by diluting collateral standards, and undertaking asset purchases, including private ones, to address market dysfunction and support monetary policy objectives, even if it entails assuming significant credit risk. In recognition of the fact that RBI forms the primary bulwark for monetary and financial stability, the Expert Committee had recommended that the size of the monetary and financial stability risk provisions be maintained between 4.5 to 5.5 per cent of the balance sheet size, to ensure the availability of adequate financial resources to assuage market participants’ concerns in case of a systemic stability crisis, and for the RBI’s crisis mitigating measures to be seen as credible. 4.14. The size of the monetary and financial stability risk provision was arrived at by the Expert Committee, with a view to ensure that potential losses arising on account of providing emergency liquidity assistance (ELA) to Top 10 SCBs in the event of a relatively adverse liquidity shock, are completely provided for. Though the ELA provided by RBI is expected to be collateralized, the ELA extended to SCBs beyond their stock of High-Quality Liquid Assets (HQLA), exposes RBI not only to market risk, but also credit risk. In view of this, the monetary and financial stability risk provisions have been maintained with RBI as the country’s savings for a rainy day, in view of its role as the LOLR. The review assesses the recent and emerging global macroeconomic factors that may impact monetary and financial stability, while also taking into account the resilience demonstrated by the Bank and the banking system over the past five years, which are discussed in the subsequent paras. 4.15 During the pandemic, central banks resorted to unconventional and riskier policy tools to restore monetary and financial system stability, such as engaging in large scale asset purchases. The likelihood of central banks having to resort to unconventional monetary policy tools in periods of future crises can also be gauged from the fact that central banks of many small open economies (SOEs) and emerging market economies (EMEs) launched asset purchase programs for the first time in response to the Covid-19 crisis, along with an expanded implementation by Advanced Economy (AE) central banks15. It is also observed that the range of assets covered by central banks’ purchase programmes was wider, and credit quality lower, than in the past, with several EME central banks purchasing private assets for the first time. 4.16 Though unconventional monetary policy tools have had a stabilising impact on financial markets, with a reduction in liquidity, credit risk and term premia, they also led to an increase in central banks’ exposure to risks by transferring risks from the private sector to the public sector. In the case of India, though the purchase of assets post-pandemic was confined to public assets, the possibility of private asset purchases in future periods of crisis may not be ruled out. Similarly, the possibility of providing direct liquidity assistance to AIFIs, NBFCs, MFIs, corporates and mutual funds against non-HQLA collateral during a future crisis, may also not be ruled out, especially if the risk appetite of the banking system is low or its capital position is strained. 4.17 With regard to other sources of contingent financial stability risks, the interconnectedness between banks and non-bank financial entities in the financial system is seen to be increasing, thereby increasing the risk of a contagion in a financial crisis. Further, given the global operations of SCBs, the possibility of RBI having to provide liquidity in foreign currency to overseas branches of SCBs in periods of stress, with tightening of counterparty credit lines and widening of spreads, may not be ruled out. 4.18 However, it is pertinent to also highlight the resilience demonstrated by the Bank in the face of the extreme macroeconomic factors, as elaborated in Chapter 2 of the report. This resilience of the Bank is of importance in the broader context of monetary and financial stability, especially when numerous other central banks have incurred losses and have depleted their equity in the preceding five years in their efforts to maintain monetary and financial stability. The resilience of the Bank’s Balance Sheet, assessed in terms of economic capital, risk provisions and surplus transfer to the Government, is elaborated in Chapter 3 of the report. 4.19 The resilience is also significant as it persisted despite the Bank undertaking several targeted measures during the pandemic to support the financial system and stabilise the broader economy. While these measures had the potential to impact the Balance Sheet, the Bank did not experience any such adverse outcomes. This indicates the strength and resilience of the Balance Sheet of the Bank, even during macroeconomic volatility and systemic stress. 4.20 In recent years, the foreign exchange reserves of the Bank have increased significantly from USD 433.71 billion as at end-September 2019 to USD 665.40 billion as at end-March 2025. The accretion has enhanced the Bank’s capacity to manage external shocks, mitigate exchange rate volatility, and thereby support monetary and financial stability, besides improving the resilience of its balance sheet. 4.21 Besides the resilience of the central bank, the banking sector has also exhibited a sharp improvement in the asset quality, indicating more resilient balance sheets and a lower risk of financial instability. The latest Financial Stability Report also reaffirms the resilience of the balance sheet of banks, by highlighting that the gross non-performing assets (GNPA) ratio of SCBs fell to a multi-year low of 2.6 per cent, buoyed, inter alia, by falling slippages. 4.22 In view of the lessons learnt from the cross-country experience of central banks as well as the ongoing uncertainty arising from spill-over effects of macroeconomic and geopolitical developments, the need for RBI to maintain an optimal level of realized equity to credibly discharge its mandate of safeguarding the monetary, financial and external stability of the country has been amplified. However, the resilience demonstrated by the Bank in recent years, despite the pandemic and its aftermath, reinforces the Bank’s ability to manage monetary and financial stability risks effectively and underscores the strength of its balance sheet. 4.23 While it was felt that the scenario of the top 10 SCBs experiencing liquidity stress simultaneously is rather conservative considering that the share of deposits of these 10 banks account for more than 74.75% of the deposits of all the SCBs, it was nonetheless decided to adhere to the basic structure of the assessment carried out by the Expert Committee. Accordingly, an assessment of the ELA requirement of Top 10 SCBs was carried out for position as on March 31, 2025. During the review, it was noted that the asset quality of the banking system had substantially improved since the assessment by the Expert Committee, as evident from the drop in GNPA ratios of SCBs from 9.3% (12.6% for PSBs) in March 2019 to a multi-year low of 2.6% (3.3% for PSBs) in September 2024. Although the Expert Committee had estimated potential LOLR losses for RBI based on uniform recovery rate of 80 per cent on ELA against non-HQLA collateral for both private and public sector banks, the present review proposes to account for the inherent strength due to sovereign ownership in case of PSBs, while assessing the recovery rates. This was evidenced by the fact that the Government had infused an amount of more than ₹3,15,000 crore as capital during the period since RBI’s Asset Quality Review. Accordingly, the potential LOLR losses of RBI for the quantum of loans extended to PSBs have been assumed to be lower (10%) as compared to private sector banks (20%). In view of this, the current assessment, broadly consistent with the assumptions used by the Expert Committee, indicate the potential losses to RBI at 2.97 per cent of RBI’s balance sheet in case of a liquidity stress scenario involving the top 10 banks and recovery rate of 90% for PSBs and 80% for private sector banks. (Table 3). 4.24 However, the analysis did not take into consideration other potential sources of monetary and financial stability risks listed earlier, which may also be considered while determining the applicable range for monetary and financial stability risks. 4.25 It is also seen that the period of the extant ECF has seen considerable volatility in the transfer of surplus to the Government, as indicated by a Coefficient of Variation (CV) of 63.30 per cent16. It is observed that the existing range of 1.0 per cent for buffers for monetary and financial stability risks provides very limited flexibility to the Central Board to smoothen the transfer of surplus to the Government. As surplus generated is essentially a function of the cyclical interest rates, a case could be made for a wider range, which will provide adequate flexibility to the Central Board to smoothen transfer of surplus to the Government. 4.26 In view of the above factors, it is proposed to change the buffer requirement for monetary and financial stability risks. Currently, these buffers are maintained at the resilience level decided by the Central Board, subject to a range of 4.5 per cent to 5.5 per cent of B/S size. It is proposed to widen the applicable range for buffer requirement for monetary and financial stability risks to 5.0 ± 1.5 per cent. The wider range would provide adequate flexibility to the Central Board in determining the buffers, taking into account the prevailing macroeconomic and other factors, while also smoothening the transfer of surplus to the Government. The range also provides adequate headroom vis-à-vis the potential LOLR loss at 2.97% of B/S size. Requirement of Realized Equity 4.27 The Requirement of Realized Equity (RRE) is to be assessed as the size of realized equity to meet the requirement for Contingent Risk Buffer (CRB) and shortfall, if any, in revaluation balances vis-à-vis the requirement for market risk buffers at the Central Board-determined resilience level. The CRB shall provide for monetary and financial stability risks, credit risk, and operational risk, as per the requirements specified in previous paras, and would be maintained within the range of 6.0 ± 1.5 per cent of the Balance Sheet size (as against the level of 6.5 per cent, with lower bound of 5.5 per cent of B/S size under the extant ECF). The upper bound of RRE would be based on CRB computed assuming buffers for monetary and financial stability risks at their upper bound of 6.5 per cent of B/S size, while the lower bound of RRE would be based on CRB computed assuming buffers for monetary and financial stability risks at their lower bound of 3.5 per cent of B/S size. IV. Surplus Distribution Policy (SDP) 4.28 The SDP shall continue to treat revaluation balances as non-distributable, while imparting primacy to bolstering RBI’s financial resilience to the desired level, with only the residual net income being available for transfer to the Government. The SDP shall compare the Available Realized Equity (ARE) (comprising Capital, Reserve Fund, CF and ADF) with its requirement (RRE), and allocate net income in the following manner:
4.29 A comparative analysis of risk provisioning, under the extant ECF and proposed ECF, considering the buffers for monetary and financial stability risks being maintained within the proposed range of 5.0 ± 1.5 per cent of the B/S size, is summarized in Table 4 below: Table 4 indicates that as on March 31, 2025, revaluation balances are adequate to meet market risk buffer requirements. Applying the range of 5.0 ± 1.5 per cent of the B/S size as buffer for monetary and financial stability risks, the RRE was in the range of 6.0 ± 1.5 per cent of the B/S size. As against this, the ARE stood at 6.91% of B/S size. Accordingly, at the upper bound of RRE i.e., 7.5%, additional provisioning of ₹44,862 crore would be required from Net Income, while at the lower bound of RRE i.e., 4.5%, an amount of ₹1,83,901 crore would be written back from CF to Income. 4.30 The impact of proposed recommendations on risk provisioning and surplus transferable over the last five years is placed in Annex V. 5.1 Risk parameterisation for market risk • An integrated approach may be adopted, wherein the off-balance sheet portfolio is also considered, together with the on-B/S portfolio, while computing market risk buffer requirement. (Para 4.6) • Introduction of flexibility to the Central Board to maintain market risk buffers at any resilience level within a range of ES at 99.5 per cent CL and ES at 97.5 per cent CL. (Para 4.10) • Enhancement in Methodology: The variance covariance matrix of price returns (which is used for computation of ES) may be computed directly from price returns, instead of the existing process of approximating it by transforming the variance-covariance matrix of yield returns using pre- and post-multiplicative factors. (Para 4.7) • Inclusion of Minor Currencies: The requirement of market risk buffers may also consider the deployment of Foreign Currency Assets in minor currencies. (Para 4.8) 5.2 Provisioning for credit risk and operational risk – Economic capital for credit risk (including on account of OFBS exposures) and operational risk may continue to be maintained as hitherto. (Para 4.12) 5.3 Provisioning for monetary and financial stability risk – It is proposed to widen the applicable range for buffer requirement for monetary and financial stability risks to 5.0 ± 1.5% (vis-à-vis range of 4.5% - 5.5% under extant ECF), with the objective of providing adequate flexibility to the Central Board in determining the buffers, keeping in mind the prevailing macroeconomic and other factors, while also smoothening the transfer of surplus to the Government. (Para 4.26) 5.4 Requirement of Realized Equity (RRE) – The Requirement of Realized Equity (RRE) is to be assessed as the size of realized equity to meet the requirement for Contingent Risk Buffer (CRB) and shortfall, if any, in revaluation balances vis-à-vis the requirement for market risk buffers at the Central Board-determined resilience level. The CRB shall provide for monetary and financial stability risks, credit risk and operational risk, and would be maintained within the range of 6.0 ± 1.5 per cent of the Balance Sheet size (as against the level of 6.5 per cent, with lower bound of 5.5 per cent under extant ECF). The upper bound of RRE would be based on CRB computed assuming buffers for monetary and financial stability risks at their upper bound of 6.5%, while the lower bound of RRE would be based on CRB computed assuming buffers for monetary and financial stability risks at their lower bound of 3.5% (Para 4.27) 5.5 Available economic capital/ risk buffers – The Requirement of Realized Equity shall be met exclusively by the Available Realized Equity comprising the Bank’s Capital, Reserve Fund, Contingency Fund and Asset Development Fund. The extant principle of one-way fungibility (implying that revaluation balances cannot provide for risks other than market risk, while realized equity can provide for all risks, including market risk) would continue to be applicable to the twin components of RBI’s economic capital. 5.6 Surplus Distribution Policy (SDP) The SDP shall continue to treat revaluation balances as non-distributable, while imparting primacy to bolstering RBI’s financial resilience to the desired level, with only the residual net income being available for transfer to the Government. The SDP shall compare the Available Realized Equity (ARE) (comprising Capital, Reserve Fund, CF and ADF) with its requirement (RRE), and allocate net income in the following manner:
(Para 4.28) 1. Economic & Political Weekly, 53, (48) (2018) – ‘Paranoia or Prudence? How Much Capital is Enough for the RBI?’ by Anand, Abhishek, Felman, Josh, Sharma, Navneeraj, & Subramanian, Arvind (2018). 2. Czech National Bank Working Papers, series 3 (2012) - ‘Does Central Bank Financial Strength Matter for Inflation? An Empirical Analysis’ by Benecká, S., Holub, T., Kadlčáková, N.L., & Kubicová I. 3. CEPR Discussion Papers No. 6827, London, Centre for Economic Policy Research (2008) - ‘Can Central Banks Go Broke?’ by Buiter, Willem H. https://cepr.org/active/publications/discussion_papers/dp.php?dpno=6827. 4. Bank of England Staff Working Paper No. 1,069 (April 2024) – ‘Central bank profit distribution and recapitalisation’ by Jamie Long and Paul Fisher. Retrieved from Central bank profit distribution and recapitalisation | Bank of England 5. IMF Working Paper WP/24/35 (Feb 2024) - ‘A New Measure of Central Bank Independence’ by Tobias Adrian, Ashraf Khan and Lev Menand. Retrieved from https://www.imf.org/en/Publications/WP/Issues/2024/02/23/A-New-Measure-of-Central-Bank-Independence-545270 6. Speech by Klaas Knot, President, De Nederlandsche Bank (April 2024) - ‘Central bank capital - of capital importance?’ Retrieved from https://www.bis.org/review/r240415d.htm Surplus Distribution Policy, Extant Economic Capital Frameworks and Accounting Standards of select Central Banks
Profitability and equity of central banks – Impact of macroeconomic environment Table A1 below presents a few examples of central banks who have experienced adverse profitability and equity position in recent years (FY 2020-21 to 2023-24), in pursuance of their mandates. Rationale for computing variance-covariance matrix from price returns and impact of methodology changes to economic capital requirement for market risk The existing MATLAB based market risk engine approximates variance covariance matrix of price returns of specified maturity buckets in various currencies by transforming the variance covariance matrix of yield returns using pre and post multiplicative factors while computing parametric VaR/ ES. The variance covariance matrix of price returns is required in order to compute the portfolio’s variance and consequently the VaR/ ES at specified CL. The pre and post multiplicative factor is a diagonal matrix arrived at as the product of modified duration and yield (on reference date) for the corresponding currency and maturity bucket. 2. While the above approximation is not otherwise seen to have a significant impact, an episode in 2021-2022 where EUR zero coupon yields were close to zero and transitioning from negative to positive, resulted in an unusually high value of computed variance on account of high values of yield returns (as denominator was close to zero), which was not being offset in the pre and post multiplicative factors, which considers a constant value of yield (prevailing on the reference date). 3. The aforesaid issue, essentially arising from usage of running yields in variance covariance matrix of yield returns compared to constant yield in pre and post multiplicative matrices, may be overcome if variance covariance matrix of price returns is computed directly by deriving price of zero-coupon bonds from zero coupon yields using continuous compounding. 4. Though the aforesaid issue did not have an impact on requirement of market risk buffers computed during the review period, as the reference date (stress period) under the approved ECF is August 30, 2013, adoption of the proposed method (of computing variance covariance matrix directly) would be statistically consistent and ensure that no undue anomaly is observed in assessment of market risk should the reference period change from August 2013 to 2022 and beyond. This is also followed for management of foreign exchange reserves by the Bank. Comparison of risk buffers for market risk under proposed and extant ECF The requirement of risk buffers for market risk as per the proposed recommendations vis-à-vis their requirement under the extant ECF for the previous five FYs, is placed in Table A2 below. Impact of proposed recommendations on risk provisioning and surplus transferable The impact of proposed recommendations on risk provisioning and surplus transferable, considering the buffers for monetary and financial stability risks being maintained within the proposed range of 5.0 ± 1.5 per cent of the B/S size, is placed in Table A3 below.
1 Inclusion of net valuation gains/ losses as Revaluation Accounts in the balance sheet instead of including them in the Income Statement, and charging of net unrealized losses in Revaluation Accounts to CF during finalisation of Annual Accounts. 2 Under the extant ECF, additional risk provisioning is permissible only if revaluation balances are lower than ES 97.5% CL. 3 The Coefficient of Variation (CV), computed as Standard Deviation / Mean, is a statistical measure of the dispersion of data points around the mean. It stood at 30.84 per cent during the six years prior to the adoption of the extant ECF. 4 Additional risk provisioning for March 31, 2025, estimated after considering ARE prior to risk provisioning (6.91%) 5 Section 47: After making provision for bad and doubtful debts, depreciation in assets, contributions to staff and superannuation funds and for all other matters for which provision is to be made by or under this Act or which are usually provided for by bankers, the balance of the profits shall be paid to the Central Government. 6 In the case of RBI, the Bank’s interest income on domestic assets has far exceeded the net interest outgo on account of liquidity adjustment operations in recent years, resulting in a significant positive interest income from domestic sources. Moreover, the interest income from foreign sources has also seen a significant increase as low coupon foreign securities/ deposits have progressively been replaced with higher coupon ones. 7 Examples of prominent central banks include Federal Reserve, European Central Bank, Deutsche Bundesbank, Banque de France, Swiss National Bank, Bank of Canada and Reserve Bank of Australia (RBA). 8 RBA, Bank of Russia, Czech National Bank, Monetary Authority of Singapore, and Reserve Bank of New Zealand are a few prominent central banks which have posted losses in the previous few years due to net valuation losses. 9 Post finalisation of Annual Accounts. Includes the impact of risk provisioning carried out during the year/ write-back of risk provisions. 10 Includes the impact of charging of negative balances in revaluation accounts to CF as per the Accounting Policy. 11 The Committee had projected average risk provisioning in the range of 14% to 16.6% of net income under the Mean Scenario. The range was projected to be 27.8% to 32.8% of net income in the case of a negative 1 SD shock to net income. 12 Excludes the impact on account of write back of ₹52,637 crore from CF in FY 2018-19. On inclusion of the same, the risk provisioning and surplus transferred as a percentage of net income would be 33.31% and 66.69% respectively. 13 As on March 31, 2025, the OFBS exposure is more than 10% of the size of the Bank’s Balance Sheet. 14 Under the extant ECF, in case the market risk buffers are adequate to meet their requirement computed at ES 97.5 per cent CL, no additional risk provisioning for market risk is permissible. 15 BIS, Committee on the Global Financial System (CGFS) Papers No 68 (Mar 2023) - ‘Central bank asset purchases in response to the Covid-19 crisis’ by Margarita Delgado (Banco de España) and Toni Gravelle (BoC). 16 The Coefficient of Variation (CV) is computed as Standard Deviation / Mean. It stood at 30.84 per cent during the six years prior to the adoption of the extant ECF. 17 Memorandum of Understanding: Financial relationship between HM Treasury and the Bank of England (2025) 18 Annual Report of the Reserve Bank of Australia (2024) 19 Section 213 of the Reserve Bank of New Zealand Act 2021 20 Statement of Financial Risk Management [Page 59 of the Annual Report of the Reserve Bank of New Zealand (2024)] 21 Section 27 of the Bank of Canada Act 22 Section 27.1 (1) of the Bank of Canada Act 23 Article 30 of the National Bank Act, 2003 24 Press Release: Annual result of the Swiss National Bank for 2024 (March 3, 2025) 25 Section 14 of the Bank of Thailand Act 26 Annual Financial Statement of Bank of Thailand (2023) 27 Section 7 of the Central Bank of Malaysia Act 2009 28 Annual Report of the Bank Negara Malaysia (2023) 29 Article 99 of the Bank of Korea Act 30 Financial statements of Bangko Sentral ng Pilipinas (2022 and 2023) 31 Additional risk provisioning for March 31, 2025, estimated after considering ARE prior to risk provisioning (6.91%) |
||||||||||||||||||||||||||||||||||||||||||||||||||||||||||||||||||||||||||||||||||||||||||||||||||||||||||||||||||||||||||||||||||||||||||||||||||||||||||||||||||||||||||||||||||||||||||||||||||||||||||||||||||||||||||||||||||||||||||||||||||||||||||||||||||||||||||||||||||||||||||||||||||||||||||||||||||||||||||||||||||||||||||||||||||||||||||||||||||||||||||||||||||||||||||||||||||||||||||||||||||||||

റിസർവ് ബാങ്ക് ഓഫ് ഇന്ത്യ മൊബൈൽ ആപ്ലിക്കേഷൻ ഇൻസ്റ്റാൾ ചെയ്ത് ഏറ്റവും പുതിയ വാർത്തകളിലേക്ക് വേഗത്തിലുള്ള ആക്സസ് നേടുക!
ഞങ്ങളുടെ ആപ്പ് ഇൻസ്റ്റാൾ ചെയ്യാൻ QR കോഡ് സ്കാൻ ചെയ്യുക


പേജ് അവസാനം അപ്ഡേറ്റ് ചെയ്തത്:


