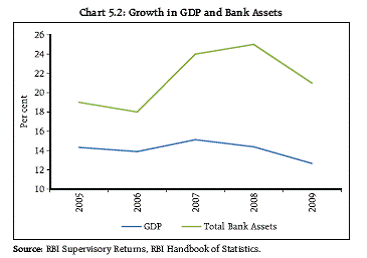
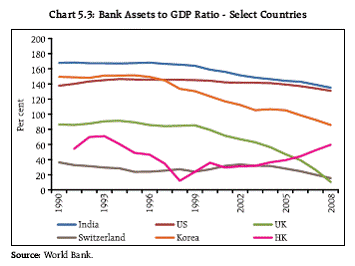
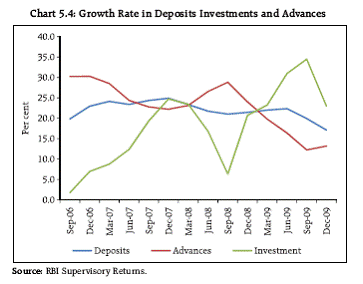
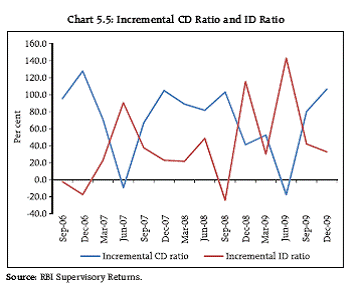
 IST,
IST,
Financial Stability Report
Post-crisis, financial stability has come to be recognised as an integral and perspicuous element of macroeconomic policy framework globally. Though comprehensive and all-encompassing in scope, the term ‘financial stability’ is usually interpreted conceptually as a persistent state of robust functioning of various financial system components – markets, institutions, market infrastructure – endowing the system to face any endogenous or exogenous financial shock with minimal disruptive impact. Pursuit of financial stability as a formal objective entails two broad aspects: first, the process aspect – rigorous, comprehensive and continuous systemic assessment of risk buildup across the financial system and second, the outcome aspect – having the necessary institutional and instrumental arrangements to take effective regulatory, supervisory and other policy measures to address the identified risks. The role of central banks in any financial stability arrangement is considered central on account of their implicit or explicit responsibility deriving from their monetary policy objectives, lender of last resort role and responsibility for the payment and settlement systems. The imperative need being recognised in the post-crisis scenario for central bank involvement in regulating and supervising financial institutions, particularly large systemically important institutions, has only reaffirmed the above role. The Union Budget for 2010-11 has announced the proposed establishment of an apex-level Financial Stability and Development Council (FSDC) to monitor macroprudential supervision of the economy, including the functioning of large financial conglomerates, and to address inter-regulatory co-ordination issues. Although the precise composition and mandate of the FSDC have yet to take shape, the proposed body answers a felt need for an institutional mechanism in the post-crisis scenario to pre-empt build-up of systemic risks with potentially huge costs for the fiscal balance sheet. The Reserve Bank is committed to working closely with the Government and other regulators to set up an agreed protocol delineating the specific role and functions of the FSDC vis-à-vis the existing framework. The Reserve Bank, on its part, has already set up a dedicated inter-disciplinary ‘Financial Stability Unit’ (FSU) with the remit to assess the health of the financial system with a focus on identifying and analysing potential risks to systemic stability and carrying out stress tests. The FSU will also prepare half-yearly reports based on its continuous assessments, crystallising the potential areas which need to be addressed from a financial stability perspective. Similar reports are being periodically brought out by many central banks. This is the first such report to be published by the Reserve Bank. Being the inaugural issue, it is necessarily more comprehensive, outlining the existing financial system in India, addressing the gamut of issues in financial stability as well as highlighting the initiatives taken to preserve financial stability pre-crisis as well as post-crisis. We hope this Report would provide useful insights and information to all stakeholders. Views and comments on the Report are welcome at fsu@rbi.org.in. D. Subbarao Mumbai
1. The global financial crisis has changed the way policy makers view and approach the issue of financial stability. The crisis has shown that even with price and macroeconomic stability, financial instability is a distinct possibility. Financial stability, therefore, needs to be pursued as an explicit policy variable. The emerging paradigm, post-crisis, is aimed at a more holistic approach to financial sector regulation with focus on systemic interconnectedness among various financial sector entities, apart from microprudential surveillance of individual institutions and use of macroprudential instruments to address the systemic risks. Many countries are in the process of redefining the regulatory objectives and mandates of various regulators. The Financial Stability Board has been set up, under a broadened mandate from the G20 Leaders, with the objective of co-ordinating, at the international level, the work of national financial authorities and international standard setting bodies in order to develop and promote the implementation of effective regulatory, supervisory and other financial sector policies. 2. In the Indian context, the multiple indicator approach to monetary as well as financial sector management has implicitly imbued the policy approach with the elements of financial stability. This Financial Stability Report (FSR) is an attempt at institutionalising the implicit focus and making financial stability an integral driver of the policy framework. The FSRs will be a periodic exercise in reviewing the nature, magnitude and implications of risks that have a bearing on the macroeconomic environment, financial institutions, markets and infrastructure. These will also assess the resilience of the financial sector through stress tests. It is hoped that FSRs will emerge as one of the key instruments for directing pre-emptive policy responses to incipient risks in the financial system. 3. This being the first of such reports, an attempt has been made to capture the structure and dynamics of the existing financial sector in India. The Report also needs to be seen as a perspective on the Indian approach to financial policymaking, placed in the background of the recent crisis. India’s response to the crisis 4. The nature and intensity of the impact of the global crisis on India was very different from those in some of the developed economies. The financial sector remained resilient and functioning, despite some volatility. There was no material stress on the balance sheets of banks and non-banking financial companies on account of toxic financial instruments. There were no solvency issues with any of the financial institutions requiring direct financial support from the Government. 5. The prudential policy framework for institutions and markets evolved over the years and the unconventional measures taken in response to emerging risks are now widely acknowledged to have played a significant role in protecting the Indian financial system from key vulnerabilities. The major elements of this approach were: (i) Prudential framework for banks addressing, inter alia, leverage, liquidity and counterparty risk concentrations; (ii) Recognition of large non-banking finance companies as systemically important and extension of the regulatory perimeter to such entities; (iii) An active capital account management framework, particularly in regard to the debt flows into the economy; (iv) Explicit regulation of key OTC derivative markets. 6. Though the direct impact of the crisis on India was relatively muted, the knock-on effects on the Indian economic and financial system were discernible, indicative of India’s rapid and growing integration into the global economy. The economy experienced a significant slowdown in 2008-09 in comparison with the robust growth performance in the preceding five years. Widening credit spreads and higher liquidity premia reflected the tightness of the domestic financial market conditions reflecting stress in the international financial market during Q3 2008 and Q1 2009. The Indian rupee also weakened significantly and the equity markets experienced sharp corrections. 7. However, quick and aggressive policy responses both by the Government and the Reserve Bank in the post-Lehman scenario mitigated the adverse impact of the global financial crisis. A number of conventional and unconventional measures were swiftly taken to improve domestic and foreign exchange liquidity and to contain excessive volatility. The domestic markets returned to normalcy much ahead of the global markets with a significant reduction in risk and a rebound in market activity. There was also an early recovery in economic growth. 8. The immediate challenge for the Indian economy and the financial sector is to reclaim the pre-crisis configuration with minimal efficiency loss. The process of exiting from an accommodative fiscal and monetary stance will be a test of the resilience of the system. Managing the complex and uncertain impact of global developments on the domestic economy will be an additional challenge. Global outlook 9. The forceful and coordinated global policy response to the crisis has facilitated the relative stabilisation of global markets and easing of credit risk concerns after the financial turmoil, especially in the second half of 2009. Uncertainties about growth prospects and financial stability, however, persist. The unevenness of the global recovery adds to this uncertainty. 10. Concerns about sovereign credit risk have also intensified in the light of the fiscal woes of Greece and some other Euro zone nations. Advanced economies are facing challenges in tackling high public debt which may not be addressed with just unwinding of existing stimulus measures. Spill-over effects of these concerns have already manifested themselves in increased sovereign credit spreads with knock-on effects on other asset classes. 11. Shortening of the maturity profiles of bank liabilities during the crisis has created large refinancing needs during the coming few years. International banks will need to take advantage of every opportunity to lengthen the maturity profile of their liabilities and to diversify their liability structure to include more customer deposits. 12. While global imbalances declined somewhat due to contraction of demand in advanced economies during the financial crisis, the structural problem associated with the imbalances remains. There are some incipient signs of the recurrence of these imbalances with the economic recovery, which is reminiscent of the pre-crisis days and could emerge as a cause for concern. Though the exposure of the Indian financial system to the international markets remains relatively low, the contagion impact from the global macroeconomic shocks on the Indian financial sector cannot be ruled out. Domestic Outlook and Assessment 13. There are evident signs of recovery in the growth increasingly taking hold. Data on industrial production, currently available up to January 2010, show that the uptrend is being maintained. The manufacturing sector, in particular, has recorded robust growth. The acceleration in the growth of the capital goods sector points to the revival of investment activity. After contracting for 13 straight months, exports have expanded since November 2009. Sustained increase in bank credit and the resources raised by the commercial sector from non-bank sources also indicate a revival. 14. The process of monetary policy exit has already begun. Sector-specific liquidity facilities were discontinued and the Statutory Liquidity Ratio (SLR) of scheduled commercial banks was restored to the precrisis level. The cash reserve ratio was raised by 75 basis points in January 2010. With the intensification of inflationary pressures, a hike of 25 basis points each in repo and reverse repo rates was announced on March 19, 2010. 15. Early steps to exit from the fiscal stimulus measures have also been initiated with the Union Budget for 2010-11 committing a return to the process of fiscal consolidation. The process of fiscal consolidation should facilitate better monetary management. In recognition of the Government’s intent to bring down deficit and debt levels, along with the positive outlook on domestic economic growth, S&P has recently upgraded its outlook on India from “Negative” to “Stable”. 16. In the above backdrop, the banking sector remains broadly healthy. Banks remain well capitalised in terms of regulatory capital adequacy ratios, with higher core capital and sustainable financial leverage, and this contributes to financial stability. Stress tests for credit and market risk reveal banks’ ability to withstand unexpected levels of stress. The balance sheets of households and corporates suggest that the financial system is not exposed to the risk of large leverages. The financial infrastructure remains robust and markets well functioning. The level of foreign exchange reserves and predominant domestic investor base in soveriegn debt provide a cushion against possible external sector shocks. 17. Going forward, however, there are several factors which may have a bearing on financial stability considerations. Inflation 18. Inflationary pressures have intensified in the recent past. Even as food prices are showing signs of moderation, they remain elevated. More importantly, the rate of increase in the prices of non-food manufactured goods has accelerated. Furthermore, increasing capacity utilisation and rising commodity and energy prices are exerting pressure on overall inflation. Taken together, these factors heighten the risks of supply-side pressures translating into a generalised inflationary process. Therefore, anchoring inflation expectations and containing overall inflation have become imperative. Market borrowing by the Government 19. Management of the government borrowing program will be a challenge in 2010-11 in spite of the lower projected net borrowings. This is on account of the fact that in 2009-10, the net supply of fresh paper was significantly lower than the net borrowings since the Reserve Bank had undertaken OMOs to the tune of Rs. 61,307 crore and there was a net redemption of MSS amounting to Rs. 53,036 crore. 20. The critical issue from the demand side perspective is the incremental appetite for government securities from banks, insurance companies and other institutional investors. Further, the commitment made by the Government to return to the path of fiscal consolidation, in particular, in accepting the recommendations of the Thirteenth Finance Commission in this respect, may improve sentiments in bond markets and assist in the anchoring of inflationary expectations. Domestic Markets 21. Volatility in financial markets has a critical bearing on the real sector and financial sector balance sheets. While some interest rate and foreign exchange risks could be managed using the hedging avenues available, from a financial stability perspective, excessive volatility on account of sharp movements over a short period could have adverse impact. Much will, of course, depend on how the macroeconomic situation evolves in the coming months. The aggregate quantum of the government borrowing program has already been priced in by the markets. Going forward, the maturity profile of fresh issuances and appropriate spacing of the borrowing program through the year will be important considerations. 22. Uncertainty is much more with regard to capital flows, which are likely be driven more by the global developments. At the current juncture, though, there is little evidence that the quantum of inflows has exceeded the absorptive capacity of the economy. If the trend changes significantly and the expectation of a surge in inflows materialises in the coming months, it could pose considerable challenge for management of the capital account. While there is a menu of policy options to respond to the challenge, the optimal policy mix will have to be carefully calibrated taking into account the evolving state of the economy and financial stability considerations. Regulatory Environment 23. There is an effort underway at the global level to realign the regulatory framework to make the financial system safer, less vulnerable to crises of the recent kind and more focussed towards the needs of the real sector. A lot of issues are being debated under the institutional framework of the G-20, the FSB and the BCBS, in all of which India is a key member, for orienting the regulatory approach towards a systemic risk containment perspective. The key themes on which there is broad agreement are: one, tighter regulatory standards on capital, liquidity and leverage for banks; two, providing oversight/bringing into the regulatory fold hitherto unregulated systemically important financial entities; three, addressing the systemic risks arising from the interconnectedness among financial sector entities; and four, regulation of financial markets and market infrastructure from a systemic risk perspective. 24. Some of the measures now being proposed could increase levels of regulatory capital and affect banks’ ability to lend. The critical challenge in this context would be to balance the needs of financial stability while ensuring adequate flow of credit to the real economy. For this purpose, it will be necessary to undertake a quantitative impact assessment and calibrate regulatory policies to mitigate any adverse impact on lending to the real economy. A Working Group of the FSB and BCBS has already been constituted to look into these aspects internationally. 25. India remains committed to the adoption of global best practices. In the Indian context, the regulatory approach for the financial sector was sensitive to the above concerns and had incorporated many of the measures well before the crisis. All commercial banks have migrated to Basel II requirements as at end-March 2009 under the Standardised Approach. Going forward, the migration to higher approaches under Basel II presents significant challenges in respect of requirements of data, systems, technology and skilled human resources. Regulation of Financial Markets 26. The crisis has demonstrated the need for effective regulation of financial markets not merely from a conduct of business perspective but also from a financial stability perspective. This becomes particularly relevant for markets involving key macroeconomic variables such as exchange rates and interest rates in the context of emerging countries like India. 27. Several far reaching measures have been taken recently in terms of allowing new products such as interest rate futures, currency futures, and repo in corporate bonds etc. Such products are new for the Indian market and an assessment of their implication on other markets, institutional behaviour and system as a whole would be critical. Going forward, a key focus area must be designing a robust market infrastructure and strengthening the systemic monitoring framework for these new markets. 28. The real challenge in developing markets and products in the future would be the de-concentration of risks from the banking system. The derivative markets were axiomatically perceived as instruments of risk diversification away from the banks but the crisis has shown that it is the banks which ultimately acted as the risk repositories in the system, that too in a nontransparent manner. In the Indian context, the key underpinnings while developing the markets would be to ensure that one, the process of disintermediation away from banks is genuine and two, wherever banks and non-bank finance companies are involved, there is clear, transparent capture of the risks within a prudential framework. Institutional Arrangements for addressing Financial Stability 29. A High Level Coordination Committee on Financial Markets exists for addressing inter-regulatory and other policy related issues and for monitoring the systemically important institutions (financial conglomerates). The Committee is headed by the Governor, Reserve Bank, and has representation from the Government and other major financial sector regulators viz., SEBI, IRDA and PFRDA. The Government has also announced the establishment of an institutional arrangement for financial stability in the form of a Financial Stability and Development Council (FSDC) to monitor macroprudential supervision of the economy, including the functioning of large financial conglomerates, and to address inter-regulatory co-ordination issues without compromising the independence of individual regulators. A key issue to be addressed is the nature of relationship of the FSDC with the existing HLCCFM. 30. Natural synergies between the roles of the Reserve Bank as monetary policy authority, regulator and supervisor of institutions and markets and Lender of Last Resort provide the Reserve Bank with the requisite means and competence to play an integral role in addressing the objectives of financial stability. Banking and Financial Sector 31. Indian banks have remained resilient even during the height of the subprime crisis and the consequent financial turmoil. The banking sector is adequately capitalised, the dominant component being loss absorbing common equity. In fact, the migration to Basel II (Standardised Approach for credit and market risk and Basic Indicator Approach for operational risk) has resulted in an increase in the capital adequacy ratio of the banking system. Credit quality continues to remain robust. The share of low cost current and savings account deposits in total deposits is high. Banks are required to hold a minimum percentage of their liabilities in risk free government securities. This, to a large extent, takes care of liquidity and solvency issues. 32. Despite a relatively strong outlook, it is clear that the economic slowdown has decelerated growth in the balance sheet of the banking system. This could have a lagged effect on the credit quality and profitability of banks. In fact, after showing a declining trend till 2007- 08, there was some increase in NPA levels in 2008-09. Prudential regulations for restructured accounts were modified as a one-time measure and for a limited period in view of the extraordinary external factors, in order to preserve the economic and productive value of assets which were otherwise viable. Several accounts were restructured under this dispensation. The restructured accounts in the standard category constituted 3.1 per cent of the gross advances as at end-December 2009. The asset quality may also come under pressure in case there are significant slippages in some of the restructured accounts. 33. However, there are early signs of a broad based recovery in bank credit and this could mitigate some of the potential risks. Furthermore, stress tests indicate that the banking sector is comfortably resilient and, even if, in a worst case scenario, it is assumed that all restructured standard advances were to become NPAs, the stress would not be significant. 34. Given the emergent pressures on the inflation front and the large fiscal borrowing programme, there are likely to be pressures on yields, which may have some impact on the cost of funds of banks. Banks may also need to make provisions towards depreciation in value of investments depending on the duration of their portfolio. This may impact the banks’ NIM and their profitability. The margins may also face pressure from the regulatory requirement for increased provisions and calculation of interest on savings bank deposits on a daily basis from April 1, 2010. 35. Though there has been some increase in banks’ duration of equity in recent months, the same is relatively low. This is a pointer to active interest rate risk management by banks and suggests that the banks’ vulnerabilities to interest rate increases will not be very significant. 36. Banks in India have been actively managing their asset liability mismatches based on guidelines which cover interest rate risk and liquidity risk measurement / reporting framework and prudential limits. The ALM analysis does not indicate any significant mismatches at the current juncture. The credit growth in the recent times, however, has been mostly marked in sectors like infrastructure and commercial real estate, both of which require longer term funding. The resultant ALM mismatches would require careful monitoring on an ongoing basis. 37. Other emerging issues include over-reliance on bulk deposits in certain institutions, which remain at elevated levels, and this could impact the cost and stability of the deposit base. With a fast expanding corporate sector and extant exposure norms, the headroom available to banks is constrained and needs to be addressed. 38. While the resilience of the commercial banks to credit and interest rate shocks has improved over time, the liquidity scenario analysis shows some potential risk. An analysis of liquidity ratios reveal positive mismatches in the short term time buckets. However, there is increased reliance on volatile liabilities to support balance sheet growth. The share of core deposits to total assets has progressively declined over the years (except in the last two quarters of 2009). Despite a high ratio of temporary assets to total assets, the coverage of liquid assets in relation to volatile liabilities has remained less than one, indicating a potential liquidity problem. 39. Liquidity stress tests indicate that some banks face liquidity constraints under the stress scenarios. Though the scenarios developed have very stringent assumptions, the results of the stress test suggest that banks need to continuously monitor their contingency liquidity plans while also strengthening systems for management of liquidity risk. The stress tests assume that assets available to meet the funding gaps are those maturing within one year. However, as banks maintain a minimum of 25 per cent of their net demand and time liabilities (NDTL) in SLR securities, it would be possible to raise additional liquidity when required. 40. The ratio of the credit equivalent of off-balance sheet (OBS) items to the balance sheet size of banks is low at around 3 per cent. However, such exposures, particularly those related to complex derivatives, are concentrated in a few foreign banks, which could be a cause for concern. 41. Excessive growth of non-insured deposits in the banking system also bears watching. This could make deposit insurance less effective and have a destabilising impact on the system. While there has been a significant element of cross-subsidisation in the settlement of deposit insurance claims, introduction of risk-based premiums at this juncture may not be feasible. Co-operative banks 42. India’s co-operative banking sector constitutes approximately 7 per cent of the banking sector’s total assets. The duality of regulatory control between the Registrar of Co-operative Societies and the Reserve Bank affects the quality of supervision and regulation of cooperative banks. To an extent, this has been addressed through the MoU entered between the State Governments and the Reserve Bank. While the financials of Urban Co-operative Banks have shown improvement, the financials of the rural co-operative sector remains a concern. Non-banking financial companies 43. The non-banking financial sector was able to manage the fallout of the crisis without creating systemic issues. Though an arrangement for providing liquidity support to meet the temporary liquidity mismatches for eligible non-deposit taking systemically important NBFCs (NBFC-ND-SI) was put in place, the actual availment through this window remained minimal. There has been a discernible slowdown in the pace of increase of balance sheets. However, in the immediate future, the sector will have to contend with the problem of monitoring ALM mismatches and credit quality. 44. Another aspect necessitating close monitoring is the interconnected flows between NBFCs and other financial sector entities. While exposure of banks to NBFCs is prudentially capped, the movement of funds between NBFCs and their group entities in the financial sector (especially in the capital market) could be relatively significant. Close and holistic monitoring of exposures between banks, mutual funds, NBFCs and other entities in the sector is important to prevent build up of systemic risks and to plug opportunities for regulatory arbitrage. 45. Given the increasing significance of the sector, the supervisory regime for the systemically important non-deposit taking NBFCs will need to be strengthened for a more robust assessment of the underlying risks. Regulation of Systemically important financial institutions 46. A monitoring and oversight framework for systemically important financial institutions (called financial conglomerates (FC) in India) is in place. The Technical Committee on RBI Regulated Entities, which is a part of the HLCCFM, has been designated as the inter-regulatory forum for having an overarching view of the FC monitoring mechanism and for providing guidance/directions on concerns arising out of analysis of FC data and for sharing of other significant information in the possession of the Principal Regulators, which might have a bearing on the Group as a whole. In order to strengthen the microprudential oversight of financial conglomerates, the Reserve Bank, in consultation with other sectoral regulators is in the process of implementing an enhanced framework for regulation and supervision of financial conglomerates. Central counterparties (CCP) 47. Central counterparties have emerged as critical elements for the smooth functioning of the financial markets and as a means to reduce systemic risk posed by derivative markets. Clearing houses, however, do not make risks disappear. They accumulate a large share of the smaller pool of counter-party risks. These entities are increasingly becoming systemically important market institutions and need to be regulated more firmly for robust risk management systems. Their capital,margining and collateral requirements need to be assessed from a prudential and systemic stability perspective. Accounting framework 48. Policy proposals to improve valuation of financial instruments and transparency in financial markets have assumed greater importance in the aftermath of the global financial crisis. The IASB has announced an accelerated timetable for replacement of IAS 39 dealing with the recognition and measurement of financial instruments. Further, IASB and the US FASB are working towards convergence between IFRS and the US GAAP. 49. In India, the ICAI had announced the mandatory convergence of Indian Accounting Standards with IFRS from 1st April 2011. Subsequently, the Ministry of Corporate Affairs has announced a roadmap for mandatory convergence of corporates in a phased manner commencing from 1st April, 2011. A separate roadmap for convergence of banks and insurance companies is under preparation. The convergence programme could be a major challenge for the Indian banking system in view of the rigorous requirements for skill upgradation, changes in IT systems, maintenance of parallel accounts during the transition period and implementation issues. Un-hedged corporate Exposures 50. The extant exposure norms along with interest rate differentials have resulted in corporates searching for alternate funding sources like ECBs. While these appear to be cheaper sources of funding given the divergence in policy interest rates, it exposes the corporates to exchange rate and liquidity risks and could be a source of credit risk for banks. The propensity to take unhedged corporate foreign exchange exposures also constitutes a potential source of risk to the banking sector. Legal Pendency 51. The delay in disposal of legal suits is a major concern in the Indian context, particularly in the case of insolvency proceedings. In fact, India remains an outlier in the World Bank “Doing Business Report” in terms of recovery rates and the completion of the winding-up processes. Clearly, major legislative initiatives are required in this regard. Data Availability 52. One of the key dimensions in any stability assessment exercise is the availability of appropriate data. Various international initiatives are being taken to strengthen available data sources to enable a better, forward-looking and targeted identification of risks for financial stability. The IMF, together with the FSB, has prepared draft recommendations in this regard, which are under examination. 53. India has made significant strides in enhancing its data dissemination standards. It was among the first set of countries that subscribed to the IMF’s Special Data Dissemination Standards (SDDS). However, data gaps need to be overcome in the area of interconnectedness of financial institutions, household indebtedness and a system level database on asset prices in certain segments like the commercial real estate exposure. Concluding Remarks 54. To sum up, India has been relatively less impacted by the global financial crisis and its financial institutions, markets and infrastructure remain healthy and robust. While robust regulatory and supervisory policies ensured the strength and resilience of the financial sector, a range of fiscal, monetary and prudential measures were utilised together to maintain financial stability, once the global disturbances touched Indian shores. This synergistic approach has been possible because of the close co-ordination between the Government and the Reserve Bank and other financial sector regulators, coupled with the fact that the Reserve Bank is both the monetary authority and the regulator of banks, non-banking financial companies and certain segments of financial markets. 55. However, the recent financial turmoil has clearly demonstrated that there is no place for complacency in the pursuit for maintenance of financial stability. No country is immune from any financial instability anywhere in the world. Maintenance of financial stability involves trade-offs and raises a number of challenges. It requires constant vigilance, especially during ‘peace’ times, to detect and mitigate any incipient signs of instability. The establishment of a Financial Stability Unit in the Reserve Bank and this Report are part of the central bank’s efforts in this direction. 1.1 The global financial crisis of 2008 has witnessed a paradigm shift in the way the world views financial stability. The crisis revealed that financial instability can occur even in a scenario of price stability and sound macroeconomic conditions. It also revealed that a threat to financial stability in one economy can spillover to other economies and snowball into a global crisis. Hence, preserving financial stability in a globalised world requires a robust architecture at both national and global levels. Financial Stability – In Search of a Definition 1.2 Though an often quoted and widely used phrase, financial stability has, in contrast to price stability, been difficult to define or measure. Policy makers and analysts at international fora have been actively engaged in defining financial stability in a precise, measurable and comprehensive manner. From a macroprudential perspective, financial stability could be defined as a situation in which the financial sector provides critical services to the real economy without any discontinuity. However, this cannot be quantified for measurement purposes. 1.3 A tautological definition could be the absence of financial instability. In that sense, financial stability could be best perceived as containment of the likelihood of failure of individual financial firms or any systemic stress, thereby limiting the associated costs to the economy. Financial distress could arise because of excessive financial risk taking by economic agents, whether consumers, investors, the Government or financial intermediaries. 1.4 The art of managing financial stability, hence, involves not only the identification and monitoring of the sources of risks from various segments of the financial system (i.e., financial institutions, markets, and payments, settlement and clearing systems) and preempting them from snowballing into a systemic crisis, but also creating conditions for a sound financial environment in normal times. This requires that all the principal segments of the financial system should be jointly capable of absorbing smoothly both anticipated and unanticipated shocks of any nature and magnitude, thereby facilitating an efficient reallocation of financial resources from savers to investors through adequate pricing of risk. It would also require preserving the confidence of the public in the ability of the financial institutions to meet their contractual obligations without interruption or outside assistance. More importantly, the financial stability exercise should be dynamic and deal with both microprudential and macroprudential issues, since interdependencies among firms and markets as also the linkages that arise through short-term funding markets and other counterparty relationships, such as over-the-counter derivatives contracts, have the potential to undermine the stability of the financial system. 1.5 Ideally, therefore, an effective framework for managing financial instability should necessarily include an assessment of the individual and collective robustness of the institutions, markets and infrastructures that make up the financial system, identification of the main sources of risk and vulnerability that could pose challenges for financial system stability in the future and an appraisal of the resilience of the financial system in terms of its ability to cope with crisis, should these risks materialise. The overall assessment should then determine whether remedial action is needed, since timely action on early warning exercises undertaken as part of the systemic risk analysis is critical for preserving financial stability. 1.6 The stability framework should be able to identify the potential build-up of financial imbalances by factoring in possible transmission lags in policy instruments, the probable consequences of ‘unknown unknowns’, and limitations of the modeling apparatus and stress testing exercise. Accordingly, the framework should be able to track the observable antecedents of a crisis, such as use of leverage, maturity mismatches, default rates and exposure to asset price bubbles and then design suitable policies. Financial stability at times depends on market participants’ expectations/perceptions of stability; hence establishing a track record of domestic stability also assumes importance. 1.7 To sum up in the Indian context, financial stability could encompass monitoring the following elements: • Excessive volatility in macroeconomic variables, both global and domestic, and market trends such as interest rates, exchange rates and asset prices; • Build-up of leverage in financial, corporate and household sector balance sheets; • Available systemic buffers within the financial sector, both at the institution and system levels, to withstand potential shocks to the economy; • Activities of unregulated nodes in the financial sector which, through their interconnectedness with the formal regulated system, can breed systemic vulnerabilities. Global Crisis and Financial Stability 1.8 Increasing global imbalances, build-up of excessive leverage and mismatches in financial intermediaries, weaknesses in the regulatory and supervisory system and complexities in financial products arising out of financial innovations have been some of the major factors leading to the global crisis. The crisis triggered unprecedented panic and uncertainty about the extent of risk in the system which was reflected in the sudden and massive break down of trust across the entire financial system. While banks tended to hoard liquidity, the credit, bond and equity markets witnessed reversal. In view of sudden preference for safety, yields on government securities plunged while spreads over risk free government securities surged across market segments. Massive deleveraging drove down asset prices, setting off a vicious cycle. Several venerable financial institutions came to the brink of collapse. While the epicentre of the crisis lay in the advanced economies originating from the US, it soon spread from the financial sector to the real sector in advanced economies and concomitantly spread geographically from the advanced economies to the emerging market economies and soon engulfed the global economy. 1.9 Post-crisis, financial stability has emerged as an important objective for central banks across countries in the world. Not only have individual regulators adopted a host of measures in their respective countries, but even the global community as a whole, has been making concerted efforts to reform the existing international financial architecture and help prevent such crises in future. Global Initiatives 1.10 The establishment of the Financial Stability Board (FSB) as an enlarged version of the Financial Stability Forum, under the broadened mandate from G20 Leaders, has been one of the most significant initiatives taken post-crisis to promote financial stability globally. The FSB has been setup with the objective of coordinating at the international level the work of national financial authorities and international standard setting bodies in order to develop and promote the implementation of effective regulatory, supervisory and other financial sector policies (Box 1.1). International Standard Setting Bodies 1.11 International standard setting bodies like the Basel Committee on Banking Supervision (BCBS), Committee on Global Financial System (CGFS), International Organization of Securities Commissions (IOSCO), International Accounting Standards Board (IASB), International Association of Insurance Supervisors (IAIS), along with international financial institutions like the IMF, are also in the process of revising their existing standards and codes in tune with the changed global environment. 1.12 In the US, the House of Representatives has passed the Wall Street Reform and Consumer Protection Act of 2009, which envisages, among others, establishment of a Financial Services Oversight Council (The final legislation is still under discussion in the Senate). Similarly, in the UK, there is a proposal for a Council for Financial Stability. The remit for these councils will essentially be to act as monitoring and coordinating bodies with a mandate to monitor and identify emerging risks to financial stability across the entire financial system, to identify regulatory gaps and to coordinate the agencies’ responses to potential systemic risks. 1.13 The European Union, based on the recommendations of the Larosiere Group, has proposed establishing a European Systemic Risk Board (ESRB) that would be responsible for macroprudential oversight of the financial system within the Union in order to prevent or mitigate systemic risks. Secretariat for the ESRB will be provided by the European Central Bank (ECB). ESRB is not conceived as a body with legal personality and binding powers but rather as a “reputational” body with an advisory role expected to influence the actions of policy makers and supervisors by means of its moral authority. Box 1.1: Financial Stability Board The FSB is an international body established to address financial system vulnerabilities and to drive the development and implementation of strong regulatory, supervisory and other policies in the interest of financial stability. FSB is the successor to the Financial Stability Forum (FSF) which was set up by the G-7 in the wake of the Asian crisis in 1999. FSB has been set up with an expanded membership (mainly from the G-20). The FSF almost exclusively focused on developed financial centres, while the FSB is more broadly represented. The erstwhile mandate of the FSF has now been expanded to include the following : • assess vulnerabilities affecting the global financial system and identify and review on a timely and ongoing basis the regulatory, supervisory and related actions needed to address them, and their outcomes ; • promote coordination and information exchange among authorities responsible for financial stability; • monitor and advise on market developments and their implications for regulatory policy; • advise on and monitor best practice in meeting regulatory standards; • undertake joint strategic reviews of the policy development work of the international standard setting bodies to ensure their work is timely, coordinated, focused on priorities and on addressing gaps; • set guidelines for and support the establishment of supervisory colleges; • support contingency planning for cross-border crisis management, particularly with respect to systemically important firms; • collaborate with the International Monetary Fund (IMF) to conduct Early Warning Exercises; and • undertake any other tasks agreed by its Members in the course of its activities and within the framework of this Charter. Members of the FSB commit to, inter alia, implement international financial standards (including 12 key international financial standards and codes) and agree to undergo periodic peer reviews, using, among other evidence, IMF/World Bank Public Financial Sector Assessment Program reports. FSB Plenary is the main decision making body. Three Standing Committees, viz., the Standing Committee for Vulnerabilities Assessments (SCAV), the Standing Committee for Regulatory and Supervisory Co-operation (SCRSC) and the Standing Committee for Standards Implementation (SCSI) report to the FSB Plenary. A Steering Committee under the Plenary provides operational guidance between plenary meetings to carry forward the directions of the FSB and ensures effective information flow to whole of FSB. Source : FSB. 1.14 The key aspects of the emerging frameworks in different countries are the following: (i) Supervision of individual firms from a systemic perspective vesting with the sectoral regulators; (ii) Greater involvement of central banks, where not already there, in supervision of systemically important entities; (iii) A collegial body of government/central bank/ regulators to monitor and coordinate response to systemic risks – the role of government as the ultimate absorber of solvency risk of financial institutions has been demonstrated in the recent crisis; (iv) Reorientation of regulatory mandates of all regulators to also take into account a systemic perspective. Central Banks and Financial Stability 1.15 In the aftermath of the global crisis, financial stability has emerged as a major objective in central banks, in spite of the fact that only three per cent of the IMF-surveyed central banks actually have an explicit legal responsibility for financial stability. 1.16 The two main objectives of central banks around the world relate to the maintenance of monetary and financial stability. While monetary stability is generally the explicit objective, financial stability is usually an implicit objective. Both monetary stability and financial stability are intimately linked. Monetary stability supports sound investment and sustainable growth, which in turn is conducive for financial stability. Since the fragility of banks and their counterparties tends to be heightened when prices are unstable, the pursuit of monetary stability can be seen as a crucial contribution to financial stability. Similarly, maintaining financial stability also contributes to monetary stability in the long run. 1.17 Central banks also assess risks on a system-wide basis taking into consideration the linkages between the real economy and financial markets as well as among financial institutions. Such assessment becomes the basis for policy actions regarding financial system stability. India’s Initiatives to Strengthen the Financial Stability Framework 1.18 The Reserve Bank of India, through its evolution over the past 75 years, has emerged as a universal, full service provider central bank in a true sense with responsibilities spanning multiple areas. Implicit in the various responsibilities endowed upon the Reserve Bank, through disparate legislations at different points of time, is a broad mandate for ensuring what is now internationally being referred to as ‘financial stability’. 1.19 The pursuit of financial stability has emerged as the central plank of financial sector reforms in India since the submission of the Report of the Committee on the Financial System, 1992 (Chairman: Shri M. Narasimham) which recognised financial stability as the sine qua non of rapid and sustainable economic progress. Since early 2000, maintaining financial stability has been a part of the stated policy objectives, with both monetary and regulatory policy measures being employed to achieve that goal. 1.20 The role of financial stability has been recognised, inter alia, from three principal perspectives. • Stability of the financial system has critical influence on price stability and sustained growth, which constitute the principal objectives of policy. • A stable financial system facilitates efficient transmission of monetary policy actions. • From the perspective of regulation and supervision, safeguarding depositors’ interest, and ensuring stability of the financial system, in particular, the banking sector, is the mandate of the Reserve Bank. 1.21 The IMF and the World Bank have been jointly conducting the Financial Sector Assessment Programme (FSAP) since 1999, which aims at assessing the stability and resilience of financial systems in member countries. India has been one of the earliest volunteers to participate in an FSAP in 2001 and has also been associated with independent assessments of standards and codes by the IMF/World Bank since then. It conducted a self-assessment of compliance with international standards and codes in 2002 and another review in 2004. Based on India’s experience in the FSAP and self-assessments, the Government, in consultation with the Reserve Bank, constituted the Committee on Financial Sector Assessment (CFSA) to undertake a comprehensive self-assessment of India’s financial sector. The CFSA, which submitted its Report in March 2009, has assessed financial stability in India as also compliance with international financial standards and codes. Need for a Financial Stability Report 1.22 The purpose of financial stability reports (FSRs), in general, is to identify at an early stage any vulnerability that could potentially lead to a crisis in the financial system and to recommend policy measures to address such vulnerabilities. Several central banks presently assess the stability of their financial systems through FSRs. The Bank of England and the Sveriges Riksbank, Sweden, were among the earliest central banks to introduce an FSR in 1997. At the global level, international financial institutions such as the IMF also publish periodical reports on global financial stability. Conveying information on financial stability may be perceived as important to enhance public understanding of and create awareness on financial stability and the role the central bank can play in the process. In times of crisis, the information and analysis presented through a FSR could also help in containing uncertainty and boosting public confidence in the system. 1.23 In India, while institution-focused microprudential supervision is being explicitly carried out, measures for financial stability incorporating macroprudential systemic issues have been ensured in a more implicit manner. In view of the growing and critical importance of financial stability, the FSRs from the Reserve Bank, starting with this one, will offer the Reserve Bank’s assessment of financial stability, with a focus on potential risks and vulnerabilities. 1.24 The content of FSR may seem to overlap with other reports of the Reserve Bank on the macroeconomic conditions and the financial system. But sufficient care has been taken to ensure that the FSR carries a different focus, i.e. to assess the magnitude and implications of risks that will have a bearing on the overall financial system and the economy at large. By doing so, it is hoped that the FSR would enhance transparency and augment confidence in the financial system. 1.25 Against the backdrop of the current global and domestic macroeconomic environment, this Report examines the strength and resilience of the three major segments of the financial sector, viz., financial markets, financial institutions and financial infrastructure. Different measures taken in India before and after the global crisis for preservation and strengthening of financial stability and the Indian approach to financial stability are presented in Chapter II. Chapter III – Macroeconomic Environment offers an assessment of macroeconomic risks arising from recent global and domestic developments that have implications for financial stability. Chapter IV – Financial Markets analyses the developments in various financial markets. The soundness and stability of different categories of systemically important financial institutions have been discussed in Chapter V – Financial Institutions. The issues relating to the financial infrastructure, including the regulatory and supervisory architecture, safety nets, payment and settlement systems and business continuity preparedness are discussed in detail in Chapter VI – Financial Sector Policies and Infrastructure. Chapter VII – Stress Testing and Resilience examines the resilience of the commercial banks to hypothetical stress possibilities through the conduct of stress tests for credit, market and liquidity risks. Chapter II The pursuit of financial stability in India has been more a matter of regulatory approach and orientation more than explicit mandates and institutional arrangements. The approach has evolved from past experiences and a constant interaction between the micro-level supervisory process and macroeconomic assessments. The development of key markets – the government securities market, foreign exchange market and money market – has been undertaken in the context of given macroeconomic imperatives of a large fiscal deficit, a capital account management framework and dominance of banks in these markets. The prudential framework for banks as well as non-banking finance companies has been used as an instrument for addressing systemic risks as well. There is an institutionalised framework for inter-regulatory coordination in the form of a High Level Coordination Committee on Financial Markets (HLCCFM). Introduction 2.1 Financial stability came to centre stage in the aftermath of the East Asian crisis in the 1990s, prompting central banks across the globe to pursue it as a goal, either explicit or implicit. Recent developments in the global financial system have once again focused attention on the importance of financial stability. One of the many lessons of the crisis has been that financial stability cannot be taken for granted and that it can be jeopardised even if there exists price and macroeconomic stability. 2.2 In the Indian context, the multiple indicator approach to monetary policy as well as prudent financial sector management have ensured financial stability. Even as the pace and intensity of financial system liberalisation gained momentum through the development of financial markets, financial institutions and financial infrastructure, the broader underpinnings of financial stability were not lost sight of. This was made possible on account of the synergies between the twin roles of the Reserve Bank as the monetary authority as well as the regulator of banks, financial institutions, NBFCs and key financial markets. 2.3 The first section of this chapter presents the measures taken by the Reserve Bank prior to the onset of the recent global crisis which were instrumental in ensuring maintenance of financial stability in the country even amidst the unprecedented global turmoil. The next section outlines the slew of monetary, regulatory and fiscal measures undertaken in India to ensure continuing financial stability even as the contagion from the crisis spread geographically across countries and between the real and financial sectors. These early measures helped restore confidence in the financial system and limited the impact of the turmoil on domestic growth. Measures initiated prior to 2008 2.4 The prudential policy framework in India for institutions and markets has evolved over the years. The unconventional measures taken in response to emerging risks are now widely acknowledged to have played a significant role in protecting the Indian financial system from key vulnerabilities. 2.5 Financial stability is not an explicitly stated objective under the Reserve Bank’s statute, the RBI Act, 1934. However, the Reserve Bank has undertaken various measures to strengthen financial stability in the system particularly since the liberalisation of the economy and the introduction of the financial sector reforms in 1991. A number of measures based on the principles that are now accepted internationally, had already been introduced in India, well before the crisis. 2.6 Some of these measures, which traverse a wide arena, viz., monetary policy implementation, management of the capital account, the regulatory infrastructure and management of systemic interconnectedness, the prudential framework and initiatives for improving the financial market infrastructure, are outlined below. Monetary Measures 2.7 In contrast to the minimalist formula of ‘single objective, single instrument’ adopted by some countries, the conduct of monetary policy by the Reserve Bank has been guided by multiple objectives and multiple instruments. In general, the three main objectives have been price stability, growth and financial stability, with the inter se priority among the objectives shifting from time to time, depending on the macroeconomic circumstances. The utility of a broad based approach to monetary policy, augmented by forward looking indicators, has been immense, especially in uncertain economic environments. Monitoring a number of macroeconomic indicators in the conduct of monetary policy has aided the Reserve Bank in interpreting asset market developments and in general, shaping economic and financial policy over the years. This has been further facilitated by the setting up of a Technical Advisory Committee on Monetary Policy to strengthen the consultative process in monetary policy making. Management of the capital account 2.8 Liberalisation of the capital account in India has followed a well-defined and calibrated approach. This has been accompanied by active management of the capital account, especially during the large capital flows in the last few years. The liquidity implications of measured interventions in the foreign exchange market were managed through the judicious use of the cash reserve ratio (CRR) and the market stabilisation scheme (MSS)1 . Management of the capital account has been buttressed through the imposition of prudential safeguards in respect of access of foreign entities to the domestic debt markets and on foreign exchange borrowings by domestic corporates. 2.9 A cap on the amounts that can be invested by FIIs in India’s government and corporate bond markets (currently USD 5 billion and USD 15 billion respectively) and the policy frameworks for non-resident deposits and ECB are important instruments for capital account management. Compliance with international standards 2.10 From the outset, India has resolved to attain standards of international best practice in the financial sector, but the endeavour has been to fine tune the process keeping in view underlying structural, institutional and operational considerations. Recognising the pitfalls of a broad brush approach to the regulation of the banking sector, the hallmark of which is its heterogeneity, a multi-pronged strategy has been adopted by the Reserve Bank. For example, a three-track approach, prescribing varying levels of stringency of capital adequacy norms for commercial banks, co-operative banks and Regional Rural Banks has been adopted. Regulatory infrastructure and systemic interconnectedness 2.11 One reason for India being relatively unaffected by the global financial crisis has been its well developed regulatory and financial infrastructure. The legal underpinnings of the various regulatory institutions in the country are well defined. The heterogeneous nature of the financial system is also well recognised. 2.12 In the Indian context, what has provided a systemic advantage and a sound model for financial stability is that the Reserve Bank, besides being the regulator for banks as well as non-banking finance companies, is also vested with the regulation of key financial markets, viz., money market, government securities market, foreign exchange market and credit market, in which banks are the dominant players. Hence, the channels of interconnectedness between banks and other financial sector entities are within the regulatory perimeter of the Reserve Bank. 2.13 Towards ensuring a coordinated approach to the supervision of the financial system, a High Level Coordination Committee on Financial Markets (HLCCFM) has been functional since 1992 with the Governor of the Reserve Bank as Chairman, the Finance Secretary, Government of India and the heads of other regulatory authorities like the Securities and Exchange Board of India (SEBI), the Insurance Regulatory and Development Authority (IRDA) and the Pension Funds Regulatory and Development Authority (PFRDA) as members. There are separate sub-committees under the HLCCFM with specific focus on entities regulated by the Reserve Bank, SEBI and IRDA. The Sub-Committee on RBI Regulated Entities has been specifically mandated to undertake the monitoring of financial conglomerates. Other than the above sub-committees, there is an RBI-SEBI Technical Committee to harmonise banking regulation and capital market regulations. 2.14 Two separate Committees of the Reserve Bank’s Central Board, viz., the Board for Financial Supervision (BFS) and the Board for Payment and Settlement Systems (BPSS), are responsible for focused regulation and supervision of financial institutions regulated by the Reserve Bank and the payment and settlement infrastructure, respectively. Prudential framework 2.15 From a systemic perspective, the Reserve Bank has been implementing various macro and microprudential measures to address banking system risks. In the case of systemically important non-deposit taking NBFCs (NBFCs-ND-SI), a gradually calibrated regulatory framework in the form of capital requirements, exposure norms, liquidity management, asset liability management and reporting requirements has been extended, which has limited their capacity to leverage and space for regulatory arbitrage. Exposure norms 2.16 As a prudential measure aimed at better risk management and avoidance of concentration of credit risks, the Reserve Bank has fixed limits on bank exposure to the capital market as well as to individual and group borrowers with reference to a bank’s capital. Limits on inter-bank exposures have also been placed (Table 2.1). Banks are further encouraged to place internal caps on their sectoral exposures, their exposure to commercial real estate and to unsecured exposures. These exposures are closely monitored by the Reserve Bank. Caps on banks’ investments in non-SLR securities and prohibitions on investment in unrated non-SLR securities have been imposed with a view to limit exposure to such securities which carry higher risk. Systemic interconnectedness has been addressed by introducing prudential norms on banks’ exposures to NBFCs and to related entities. Restriction on bank financing to NBFCs for certain purposes including financing against the collateral of shares or for onlending to capital market intermediaries are designed to prevent circumvention or undermining of regulatory intent in banks’ financing activities. Counter – cyclical measures 2.17 During the expansionary phase since 2004, the Reserve Bank has been taking various measures to counter procyclical trends. The adverse impact of high credit growth in some sectors and asset price fluctuations on banks’ balance sheets at various points in time were contained through pre-emptive counter-cyclical provisioning and differentiated risk weights for certain sensitive sectors. Some of these measures were relaxed in the wake of the global crisis as a counter-cyclical measure. In the light of subsequent large increase in the credit to the commercial real estate sector and the extent of restructured advances in this sector, the provisioning requirement for the sector was increased. As a move towards counter-cyclical provisioning, banks have been advised to augment their provisioning coverage to a minimum of 70 per cent by end September 2010 (Box 2.1). Liquidity Management 2.18 The requirement of a statutory liquidity ratio (SLR) for banks acts as a buffer for both liquidity and solvency of banks. Asset liability management stipulations for management of liquidity risks have been put in place. The stipulations have been improved in recent years to ensure more granular monitoring of liquidity risk. Also, liquidity ratios focusing on funding and market liquidity are monitored on an ongoing basis.
Box 2.1: Counter-cyclical Prudential Regulations - The Indian Experience Financial institutions generally tend to behave in a pro-cyclical manner in their operations. Some prudential regulatory measures also contribute to the pro-cyclical behavior of banks. Hence, maintenance of financial stability would require counter-cyclical measures. Dynamic provisioning, leverage ratio, capital insurance, counter-cyclical capital buffers, timevarying capital requirements, are some of the commonly discussed countercyclical prudential measures in the literature. Internationally, post the global crisis, organisations like the FSB, BCBS, CGFS, IASB and FASB are working on measures to mitigate pro-cyclicality including counter cyclical provisioning. India had, even prior to the crisis, adopted a counter-cyclical approach through a calibrated increase in the risk weights and provisioning requirements in specific sectors during the period of rapid credit growth. The objective was to contain the exposure of the banking sector to sensitive asset classes where rapid credit expansion was observed.
To counter the possibility of an asset bubble in addition to concerns about credit quality led to risk weight on banks’ exposures to certain sectors and provisioning on standard assets in those sectors being increased at various points of time as shown in the Table below. Following the global financial turmoil, some of the earlier counter-cyclical measures were reversed as shown in the Table. Illustratively, the risk weights on the commercial real estate exposure was increased from 100 per cent to 125 per cent in July 2005. Given the continued rapid expansion in credit to the commercial real estate sector, the risk weight on exposure to this sector was increased to 150 per cent in May 2006. In November 2008, as a further countercyclical measure to counter the downturn, the provisioning on standard commercial real estate advances which was increased from 0.25 per cent to 2.00 per cent in stages, was brought down to 0.40 per cent. The risk weight on exposure to commercial real estate sector was also reduced to 100 per cent. With a view to improving the provisioning cover and enhancing the soundness of individual banks, it has been decided in October 2009 that banks should ensure that their provisions coverage ratio (consisting of specific provisions against NPAs and floating provisions) is not less than 70 per cent by end- September 2010. This stipulation is a part of a counter-cyclical provisioning policy on which work is underway. The final policy would deal with buildup of provisioning buffers and their utilisation. 2.19 Recognising the importance of liquidity risks at the very short-end in the context of financial stability, the Reserve Bank had taken early measures to mitigate these risks at the systemic as well as the institution level. In this context, the introduction of the Liquidity Adjustment Facility (LAF) facilitated maintenance of stability in the money market. The risks of allowing access to the unsecured overnight market funds to all entities were recognised and measures were taken to restrict the same only to banks and primary dealers (PDs). To enable the phase-out of other participants from the uncollateralised money market, the repo markets – both bilateral repos and collateralised borrowing and lending obligations (a form of tripartite repos) – were developed. Since 2005, the overnight call market in India has been a pure inter-bank market. 2.20 Prudential measures were introduced to address the extent to which banks and primary dealers can borrow and lend in the unsecured call money market in relation to the net worth. Similar measures were also introduced to place limits on ‘purchased inter-bank liabilities’ (IBL), given the potential of such liabilities to create systemic problems. Financial Market Measures 2.21 Statutorily, the Reserve Bank has the regulatory mandate over the foreign exchange, credit, money and government securities markets as well as the OTC interest rate markets, including derivatives thereon. Extensive measures for deepening of these financial markets in terms of instruments, products and participants were undertaken. Procedures for execution or settlement of exchange traded currency and interest rate products fall within the regulatory purview of SEBI. 2.22 The above mandate has contributed to a robust regulatory framework for all OTC markets, unlike in many other jurisdictions. The key aspects of the Reserve Bank’s regulation of financial markets encompass product specifications, nature of participants, prudential safeguards, reporting requirements, etc. 2.23 Under the RBI Act 1934, the validity of any OTC derivative contract is contingent on one of the parties to the transaction being a regulated entity. Access to derivative products is essentially permitted for the purpose of hedging an underlying exposure. For interest rate derivatives, there is an additional leeway to undertake derivative transactions for transformation of risk exposure, as specifically permitted by the Reserve Bank. 2.24 The Reserve Bank’s approach to the introduction of sophisticated financial products in the country has been cautious. Where such products have been permitted, wide ranging safeguards have been prescribed. These include stringent criteria for ‘true sale’ in case of securitisation, subjecting credit enhancements and liquidity support to capital regulations and amortisation of profit from sale of assets to SPVs over the life of the securities issued. Structured derivative products are permitted only as long as these are a combination of two or more of the generic instruments permitted by the Reserve Bank and do not contain any derivative, not allowed on a standalone basis. Comprehensive guidelines on derivatives have been issued emphasising the need for a proper risk management framework and appropriate corporate governance practices with regard to the use of derivatives and also focusing on the ‘suitability’ and ‘appropriateness’ of customers for various derivative products. The responsibility for assessment of customer suitability and appropriateness rests with the market maker. 2.25 Emphasis has also been placed on the development of market infrastructure. As early as 2001, the Clearing Corporation of India (CCIL), began to act as a central counterparty in the foreign exchange, government securities and money markets in a phased manner. Screen based order matching and automated settlement systems for the money and government securities markets were also put in place. A Real Time Gross Settlement System to address systemic risks in inter-bank settlement was implemented in 2004. 2.26 In order to increase transparency, various initiatives for improving dissemination of market information, especially with regard to OTC markets, have been taken by the Reserve Bank. Deposit Insurance 2.27 The deposit insurance provided by the Deposit Insurance and Credit Guarantee Corporation (DICGC) provides a safety net for the depositors. Deposit insurance in India is mandatory for all banks (commercial/co-operative/RRBs/LABs) and covers all deposits (upto a limit of Rupees one lakh), except those of foreign governments, Central/State Governments, inter-bank deposits, deposits received abroad and those specifically exempted by DICGC with the prior approval of the Reserve Bank. Indian Response to Global Financial Crisis 2.28 India’s integration into the world economy over the last decade has been remarkably rapid, accentuated by trade globalisation and access to external funding. India has been affected by the crisis through the adverse feedback loops between external shocks and domestic vulnerabilities. In other words, the impact of the crisis found its way into the financial sector in India from the real sector, which got negatively impacted due to the problems in the developed economies. The contagion of the crisis therefore, has spread to India through all the channels - the financial channel, the real channel, and the confidence channel. 2.29 Both the Government and the Reserve Bank responded to the challenge in close coordination and consultation to deal with the fall out of the crisis and to restore the growth momentum.The main plank of the Government response was fiscal stimulus while the Reserve Bank’s action comprised monetary accommodation, liquidity measures and reversal of counter-cyclical regulatory measures. The Government’s response 2.30 The Fiscal Responsibility and Budget Management (FRBM) Act, 2003, mandated a calibrated road map to fiscal sustainability. Accordingly, Central and State Governments in India have made a serious effort to reverse the fiscal excesses of the past. However, recognising the impact of the global crisis on India, the Government invoked the emergency provisions of the FRBM Act to seek relaxation from the fiscal targets and launched fiscal stimulus packages between December 2008 and July 2009. These packages, amounting to about 3 per cent of GDP, included additional public spending, particularly capital expenditure, government guaranteed funds for infrastructure spending, cuts in indirect taxes (ad valorem Central Value Added Tax was reduced by 4 per cent while Central Excise Duty and Service Tax was reduced by 2 per cent each), expanded guarantee cover for credit to micro and small enterprises and additional support to exporters. State Governments were authorised to incur increased fiscal deficits of up to 3.5 per cent of the Gross State Domestic Product (GSDP) for 2008-09 and 4 per cent of GSDP for 2009-10 in order to increase their capital expenditure. The Reserve Bank’s response 2.31 The Reserve Bank’s policy response was aimed at containing the contagion from the outside – to keep the domestic money and credit markets functioning normally and see that the liquidity stress did not trigger solvency cascades. In particular, three objectives were targeted: first, to maintain a comfortable rupee liquidity position; second, to augment foreign exchange liquidity; and third, to maintain a policy framework that would keep credit delivery on track so as to arrest the moderation in growth. Policy initiatives in this direction were a judicious mix of the conventional and the un-conventional. These were implemented in packages starting mid-September 2008, on occasion in response to unanticipated global developments, and at other times, in anticipation of the impact of potential global developments on the Indian markets. Monetary Policy Measures 2.32 The span of seven months between October 2008 and April 2009 was witness to unprecedented monetary policy actions. The repo rate was reduced by 425 basis points to 4.75 per cent while the reverse repo rate was reduced by 275 basis points to 3.25 per cent. Liquidity measures 2.33 A number of measures to improve the liquidity in the system, both rupee and foreign exchange liquidity, were employed. On the conventional side, the quantum of bank reserves impounded by the central bank was reduced and the refinance facilities for export credit were liberalised. CRR was brought down by a cumulative 400 basis points to 5.0 per cent; SLR was reduced by 100 basis points to 24.0 per cent and the export credit refinance limit for commercial banks was enhanced to 50.0 per cent from 15.0 per cent of outstanding export credit. 2.34 Measures aimed at managing foreign exchange liquidity included an upward adjustment of the interest rate ceiling on the foreign currency deposits by nonresident Indians. Restrictions relating to the cost ceiling and end-use of funds in the ECB regime for corporates were relaxed. Select NBFCs and housing finance companies were allowed access to short term foreign currency borrowing. Buyback of foreign currency convertible bonds (FCCBs) by Indian companies was allowed both under the approval and the automatic routes, subject to certain conditions, in view of depressed asset prices internationally. Amongst the unconventional measures taken by the Reserve Bank was a rupee-dollar swap facility for Indian banks to facilitate management of their short-term foreign funding requirements. 2.35 A special refinance facility was introduced on November 1, 2008 for scheduled commercial banks (excluding RRBs) up to 1.0 per cent of each bank’s NDTL as on October 24, 2008. Another special refinance facility was introduced for apex financial institutions, SIDBI, NHB and EXIM Bank, for expanding available lendable resources for refinancing credit extended to small industries, housing and exports, respectively. 2.36 As mutual funds came under redemption pressure, the Reserve Bank instituted a 14-day special repo facility for commercial banks for a notified amount of about USD 4 billion to alleviate liquidity stress faced by the mutual funds. Banks were allowed temporary use of SLR securities for collateral purposes for an additional 0.5 per cent of Net Demand and Time Liabilities (NDTL), exclusively for this. Subsequently, this facility was extended for NBFCs and later to housing finance companies as well. The relaxation in the maintenance of the SLR was enhanced to the extent of up to 1.5 per cent of NDTL. 2.37 In order to curtail leveraging, commercial banks, all-India term lending and refinancing institutions were not permitted to lend against or buy back Certificates of Deposit held by mutual funds. This restriction was relaxed in the context of the drying up of liquidity. 2.38 Considering the systemic importance of the NBFC sector, the Government, in consultation with the Reserve Bank, announced the setting up of a special purpose vehicle (Industrial Development Bank of India Stressed Asset Stabilisation Fund (IDBI SASF) Trust) that could raise funds from the Reserve Bank against governmentguaranteed bonds for an aggregated amount of Rs.20,000 crores, to meet the temporary liquidity constraints of systemically important non-deposit taking non-banking financial companies (NBFC-ND-SI). 2.39 As government borrowings increased in the wake of fiscal stimulus measures, buy back of government securities and de-sequestering of market stabilisation bonds were judiciously employed and sequenced to enhance the availability of domestic liquidity. 2.40 Thus, the Reserve Bank was able to manage the single most important concern in the wake of the global crisis i.e., the liquidity issue, through the judicious use of the instruments in its arsenal viz., CRR, SLR, LAF, Refinance, OMO and MSS. The potential release of primary liquidity during mid September 2008 to October 2009 had been to the tune of Rs.5,85,000 crore 2 . At the same time it was ensured that the growth in primary liquidity was not excessive. Importantly, the measures were instituted without any dilution of collateral or counterparty standards. The quality and the size of the Reserve Bank balance sheet also remained largely un-affected. Prudential Measures 2.41 Reflecting the rapid turn of events that could impair assets down the line, the Reserve Bank reversed some counter-cyclical measures taken prior to the crisis. Provisioning requirements for standard assets in the sensitive sector were reduced from 2.0 per cent to 0.4 per cent in line with requirements for other standard assets. Risk weights on large unrated corporate claims were reduced from 150 per cent to 100 per cent. as were the risk weights applicable to commercial real estate and NBFC exposures. A special dispensation in restructuring (corporate workouts) guidelines over a limited period was introduced, to enable banks to quickly identify viable units which had been affected by the downturn and provide them the required assistance. Exit Policy – Major Challenges 2.42 The discernible improvement in the global economic outlook in the recent times has led to a worldwide debate on the timing and sequencing of exit from the expansionary monetary and fiscal stance. There is a widespread consensus that it is appropriate to sequence the exit in a calibrated way so that the recovery process is not hampered and inflationary expectations remain anchored. The stance in the Reserve Bank’s Third Quarter Review of the Monetary Policy 2009-10 undertaken in January 2010 was shaped by the consideration that consolidating recovery should encourage a clear and explicit shift from ‘managing the crisis’ to ‘managing the recovery’. 2.43 It is, however, important to recognise though that the exit debate in India is qualitatively different from that in other advanced and emerging economies because of the unique features of its macroeconomic context. First, most of these countries do not face an immediate risk of inflation, whereas India is confronted with an upturn in inflation. Second, India has the challenge of reviving domestic consumption and investment demand - the traditional dominant drivers of our growth. Households, firms and financial institutions in India are not struggling with impaired balance sheets unlike those in advanced economies. Third, India has traditionally been a supply constrained economy in contrast to advanced economies which are demand starved. The supply constraints, which remained subdued during the crisis period due to weak demand, will re-emerge and may indeed become binding. Fourth, India is one of the few large emerging economies with twin deficits – both fiscal and current account. While the current account deficit is modest, there is a need to make a responsible, credible and timebound fiscal adjustment. In this context the downsizing of the government borrowing programme becomes critical, so as to help sustain a moderate interest rate regime. However, the exit strategy from fiscal support requires to be modulated in accordance with the evolving macroeconomic developments. 2.44 The exit process in India had begun with the closure of some special liquidity support measures. SLR was restored to 25 per cent as was the limit for the export credit refinance facility which was returned to the precrisis level of 15 per cent. The non-standard refinance facilities for scheduled commercial banks were discontinued. In the January 2010 Review of the Monetary Policy, CRR was increased by 75 basis points in a bid to reduce excess liquidity and help anchor inflationary expectations. With the intensification of inflationary pressures, a hike of 25 basis points in repo as well as reverse repo rates has been announced on March 19, 2010. Concluding Remarks 2.45 India has been using a combination of fiscal, monetary and prudential measures to maintain financial stability. This synergistic approach has been possible because of the close co-ordination between the Government, the Reserve Bank and other financial sector regulators. 2.46 Both macroprudential and microprudential policies adopted by the Reserve Bank have ensured financial stability and resilience of the banking system. The timely prudential measures instituted during the high growth period especially in regard to securitisation, additional risk weights and provisioning for specific sectors, measures to curb dependence on borrowed funds and leveraging by systemically important NBFCs have stood India in good stead. The reserve requirements – both cash and liquidity – acted as natural buffers preventing excessive leverage. 2.47 Moving ahead, the Indian financial sector would be increasingly exposed to the forces of globalisation which may have implications for financial stability. The Reserve Bank is conscious of the need to pay increasing attention to financial stability and to improve skills in this area. Towards this direction, a multi-disciplinary Financial Stability Unit has been recently set up in the Reserve Bank. 1 The MSS bonds exemplify the active co-ordination between the Government and the Reserve Bank to manage capital flows. In 2006-08, market stabilisation bonds were issued to sterilise the impact of huge capital flows. The proceeds of these issuances would lie impounded in the Government’s account with the Reserve Bank. These arrangements were formalised through a MoU with the Government which was placed in public domain. When the flows reversed during the last quarter of 2008, the measures were rolled back through desequestering and buy back of MSS bonds to inject liquidity in the system. 2Includes SLR reduction of Rs.40,000 crores Chapter III The Indian financial system avoided the adverse impact of the direct contagion from the global financial crisis but it faces challenges arising from the stress in the global macro-financial conditions as well as the slowdown in domestic economic activity. Despite signs of recovery in the global economy and the easing conditions in global financial markets, there are downside risks that the global recovery could remain gradual, bumpy and uneven across countries. Sovereign debt, especially in some Eurozone countries, pose further risk. In India, slowdown in growth of GDP and emerging inflationary pressures led by prices of food and essential commodities have posed a complex challenge for the stance of macroeconomic policy. The financial system, in turn, has had to contend with several important macro level developments, including non-disruptive absorption of the large borrowing programme of the Government that was necessary for the growth-supportive fiscal stance and financing from non banking sources by the corporates. There are strong signs of recovery in economic activity while inflationary pressures in the manufacturing sector are gaining strength. 3.1 The global recession that followed the unprecedented global financial crisis and the significant slowdown of domestic economic activity since the second half of 2008-09 have posted considerable challenges for the financial system of India, notwithstanding its resilience to the impact of direct contagion from the global crisis. Globalisation has made the tasks of monitoring systemic vulnerabilities and ensuring financial stability more complex. Global Environment Outlook on growth 3.2 Global activity contracted by about 0.8 per cent in 2009, according to IMF’s World Economic Outlook Update, January 2010. It is expected to recover and grow by about 3.9 per cent in 2010 (Chart 3.1). Signs of recovery in advanced economies are emergent while some emerging market economies (EMEs) are showing signs of a strong turnaround. However, the outlook for global growth is by no means certain. The downside risks for the global economy include continued global imbalances, the current level of high excess capacity, costs of sustained fiscal stimulus which will manifest over time and the possible impact of withdrawal of policy stimulus. Jobless recovery in advanced economies and the persistence of stress in credit markets indicates that the recovery could prove to be fragile. In the absence of a strong demand recovery, the bulk of the new production could end up being stocked as inventories1 leading to a second round of cut backs on production and jobs and to a double-dip recession. Achieving sustainable growth in the medium-term is contingent on tackling supply-side constraints arising from stagnation in capacity levels during the crisis period and the rebalancing of global pattern of demand. Economies dependent on export and capital flows will need to re-focus on domestic demand while commodity exporters will need to enhance resilience to possible volatility in international commodity prices.
Outlook on Inflation 3.3 Global inflation remained subdued for the most part during the past few years; it slipped into negative territory in some advanced economies especially in the second half of 2008-09 (Chart 3.2). Inflationary pressures were muted as a result of anaemic aggregate demand, sharp decline in oil prices since mid-2008, major corrections in prices of agricultural commodities and metals, lower shipping costs, presence of significant slack in industrial activities due to build-up of inventories and decline in capacity utilisation. As long as output gaps persist, inflationary pressures are likely to remain subdued (IMF WEO Update January 2010). However, with rising energy prices, inflation in most economies has moved into positive territory. In the developing world, limited economic slack, increased capital flows and rising commodity and energy prices are likely to cause further strengthening of inflationary pressures. Global Imbalances 3.4 With the onset of the crisis and decelerating growth in advanced economies, the intensity of global imbalances has lessened. The issue, however, is far from resolved as the reduction in imbalances appears to be temporary and not structural. Chart 3.3 shows the movements in trade balances of the US and China as proxies for global imbalances. The decline in US trade deficit has been accompanied by an increase in the personal savings rate in the US and falling import consumption. However, as the economies are recovering, the imbalances have again started to increase. Sovereign Debt 3.5 Due to large fiscal stimulus measures taken by various countries, there has been sharp increase in sovereign debt. The IMF Global Financial Stability Report (GFSR), Market Update (January 2010) has pointed out that the transfer of financial risks to sovereign balance sheets and the higher public debt levels has added to financial stability risks and complicated the exit process. Concomitant decline or slowdown in output in some countries has further aggravated the fiscal consolidation process. The GFSR Market Update projects a substantial increase in net supply of public sector debt relative to the long-run average over the next two to three years. This may crowd out growth in private sector credit, increase the cost of borrowing and act as a drag on economic recovery. Substantial loss in investor confidence in some sovereign issuers has the potential to affect the growth and credit performance in these countries. This loss of confidence may also spillover to other countries.
Domestic Macroeconomic conditions Co-movement with the Global Economy 3.6 The slowdown in GDP growth during the second half of 2008-09 called into question the earlier perceptions of decoupling. Studies have also clearly demonstrated increasing business cycle correlation between developing and developed economies in the recent wave of globalisation. Further, India’s total current and capital account flows have more than doubled from less than half of the country’s GDP in 1990-91 to over 100 per cent of the GDP in the last two years (Chart 3.4). While exposure to the world economy has increased through both the trade and capital channels, the exposure through the capital flows channel is substantially higher than in the pre-Asian crisis period. Predominance of Domestic Demand 3.7 The Indian economy continued to be largely driven by domestic demand notwithstanding its increasing globalisation. Private Final Consumption Expenditure (PFCE) and Government Final Consumption Expenditure (GFCE) together account for two thirds of the country’s GDP. The slowdown in growth in the second half of 2008-09 led to some decline in PFCE during 2008-09 and 2009-10. However, this was offset through greater GFCE reflecting the fiscal stimulus package, upward revision in public sector salaries consequent on the Sixth Pay Commission Awards and other expenditures by the Government (Chart 3.5). 3.8 There was some deceleration in Gross Domestic Capital Formation (GDCF) in 2008-09, which had shown an increasing trend as a percentage of GDP until the onset of the crisis. However, the impact on GDCF was muted as it was largely financed through domestic savings (Chart 3.6) and reliance on foreign savings has been moderate. During 2008-09, savings rate declined due to deceleration in the growth of GDP and disposable income and lower public savings. This decline in savings rate, along with subdued business climate and clearing of accumulated inventories, led to a fall in investment rate. However, the savings and investment rates are expected to rebound to their respective trend levels in 2009-10 and 2010-11.
GDP: Sectoral Growth 3.9 In 2009-10, the agriculture sector has experienced dual adverse shocks in terms of deficient monsoon and the associated drought and flood in certain parts of the country resulting in decline in production of kharif2 food grain and oilseeds. Such shocks have generally affected the overall macroeconomic conditions through lower GDP growth, increased compensatory fiscal expenditure and pressures on domestic inflation. Total foodgrain production during 2009-10, however, is estimated to be only moderately lower by 6.2 per cent as compared to the previous year as a result of a marginal increase in rabi production. The cyclical slowdown in industrial production recorded in 2007-08 was accentuated in the second half of 2008-09 with declining external and domestic demand in the wake of the global crisis. Subsequent policy measures have resulted in recovery in industrial activities. The recovery has been tangible since April 2009 and the cumulative growth in industrial production accelerated to 9.6 per cent during 2009-10 (April-January), substantially higher than the growth recorded during the corresponding period of the previous year (3.3 per cent). Reflecting a slowdown in domestic industrial activity and weak external demand during the first half of 2009-10, there was a further deceleration in services (Chart 3.7). With subsequent recovery in manufacturing sector and exports, growth of services sector is also expected to revive. GDP: Outlook 3.10 At the beginning of the fiscal year, the Reserve Bank had forecasted GDP growth at 6.0 per cent with an upward bias. The upward bias had been strengthened further due to (a) recovery in industry and core infrastructure sectors, (b) upturn in the business and consumer confidence and its reflection in the revival of consumption and investment demand, (c) revival in exports and capital flows, (d) recovery in the stock market and higher resource mobilisation through public issues and private placements and (e) improved overall global economic and financial conditions. Based on these factors, the Reserve Bank revised its forecast of growth in GDP during 2009-10 to 7.5 per cent. The optimism in respect of recovery during 2009-10 is borne out by the growth rate of GDP in the first two quarters at 6.1 per cent and 7.9 per cent. The growth rates, though higher than 5.8 per cent registered in the last two quarters of 2008-09, remains below potential. In the third quarter, however, the GDP growth decelerated to 6.0 per cent reflecting, in part, the impact of deficient South-West monsoon on the kharif crop and the higher base effect due to payment of arrears under the Sixth Pay Commission. There remain some downside risks emanating from a possible downturn in global growth and build up of inflationary pressures. Oil prices, which are expected to remain stable in near future, may rise if there is sustained and rapid global recovery and may also emerge as a downside risk.
Credit Growth 3.11 Growth of bank credit decelerated in the wake of slowing economic growth and clearing of inventories in the second half of 2008-09. The deceleration continued in the first half of 2009-10. In consonance with resurgence in economic growth as well as business confidence, recent data point to clear signs of pick up in credit growth in the second half of 2009-10 (Chart 3.8). Inflation 3.12 Inflationary pressures have intensified beyond the baseline projections of the Reserve Bank and there is risk of supply-side pressures translating into a generalised inflationary process. Even as food prices are showing signs of moderation, they remain elevated. More importantly, the rate of increase in the prices of non-food manufactured goods has acclerated. Inflationary pressures could be further exacerbated on account of increasing capacity utilisation and rising commodity and energy prices. The recent industrial production data suggest revival of private demand, which could potentially add to inflationary pressures. Some moderation, though, may be expected on account of the base effect in the coming months (Chart 3.9). In order to anchor inflationary expectations and contain inflation going forward, the Reserve Bank announced a hike of 25 basis points in the repo and reverse repo rates on March 19, 2010.
Government Sector Deficit Indicators 3.13 The fiscal position of the Central and State governments showed improvement during the period 2003-04 to 2007-08 under the aegis of the Fiscal Responsibility and Budget Management Act, 2003, further supported by robust economic growth. State finances also benefitted from higher devolution of resources from the Centre following the recommendations of the Twelfth Finance Commission. The combined finances of the Centre and States witnessed considerable improvement in terms of key deficit indicators during 2003-04 to 2007-08 (Table 3.1). During 2008-09, the trend reversed, both at the Centre and States, reflecting the fiscal stimulus measures. The expansionary fiscal stance has been sustained during 2009-10. As a result, debt-GDP ratio, which had been showing a declining trend, increased during 2009-10.
3.14 Early steps for calibrated exit from the stimulus measures have been proposed in the Union Budget for 2010-11. For the first time, the Government has set targets for reduction in domestic public debt-GDP ratio. Financial Soundness of the Corporate Sector 3.15 Corporate sector fragility could be a significant source of risk to financial institutions’ liquidity and solvency. Corporates in India were affected by the global crisis from the last quarter of 2008 as exports declined, stock prices corrected sharply, foreign sources of funds dried up and cost of funding increased. Increasing integration of the Indian economy with the global economy has significantly affected the corporate funding pattern. From 2002-03 onwards, Indian corporates are increasingly meeting their funding requirements from external sources3. The trend was further reinforced since 2005-06 though there was a slight decline in the wake of the global crisis during 2007-08 (Chart 3.10). 3.16 The dependence on foreign borrowings in the total borrowings of corporate increased from 1.6 per cent in 2003-04 to 12.7 per cent in 2007-08, indicating the increasing reliance of Indian corporates on global credit markets. The share declined modestly to 11.1 per cent in 2008-09 (Chart 3.11).
3.17 While the Indian corporate sector’s dependence on foreign sources of funding has increased, its soundness, as measured by its leverage and expense ratios has showed an improving trend during the last few years. The debt to asset ratio of the corporate sector, an indicator of degree of leverage and sensitivity to interest rate shocks, has decreased in the past few years, reflecting the sector’s improved ability to service debt. The debt to equity ratio has also decreased in recent years (Chart 3.12).
3.18 An analysis of corporate performance since the onset of the global crisis reveals that sales growth started declining from the second quarter of 2008-09. However, the impact of the same on corporate profitability was muted due to fiscal stimulus measures coupled with lower interest rates consequent to monetary policy measures. As sales started recovering from the Q2 of 2009-10, it provided a further fillip to corporate performance (Charts 3.13 and 3.14).
Financial Soundness of the Household Sector Household Savings and Investment 3.19 In the crisis affected economies, the net worth of the household sector has been eroded through falls in asset prices, in particular equity and housing prices. In India, however, though household investment in equities has risen in recent past, the share of investment in contractual assets (deposits, provident funds, life insurance and claims on government) and others is significantly higher (Chart 3.15). Thus, fall in equity prices have only negligible impact on the aggregate net worth of the households. Further, since the correction in housing prices has been marginal and limited to some pockets (Chart 3.16), the value of physical savings of the household has also remained largely intact. Household Consumption and Borrowing 3.20 Growth in PFCE decelerated significantly in the second half of 2008-09 and first quarter of 2009-10 from a steady path in the previous quarters. Some recovery was recorded in the second quarter that continued further in the third quarter. Retail credit, however, has been exhibiting a declining trend from 2007-08 onwards. The consumption expenditure of the household sector in India is, however, not significantly leveraged in terms of bank credit (Chart 3.17) .
Concluding Remarks 3.21 Progressive strengthening of finance and trade channels has increased the exposure of the domestic economy to global developments in recent years. This led to some deceleration in the growth momentum during the second half of 2008-09. However, coordinated monetary and fiscal policy measures ensured a quick recovery in 2009-10. The growth momentum is expected to be sustained in 2010-11. 3.22 Domestic demand, which still plays a major role in India, is likely to remain robust due to limited impact of drought, continued growth in disposable income and lagged impact of monetary and fiscal stimulus measures. The balance sheets of the households and corporates remain healthy and suggest that the financial system is not exposed to highly leveraged firms and individuals. Exposure of households to equity markets as well as bank credit is limited. Performance of the corporate sector after weakening in the immediate aftermath of global crisis is showing signs of recovery. 3.23 However, uncertainty about recovery in global growth, emerging concerns about the impact of fiscal excesses especially in some European countries, incipient increase in global imbalances and the impact of the timing and pace of exit adopted by the developed countries could pose downside risks. Domestically, the inflationary pressures have intensified in the recent past, as evident in the sharp acceleration in rate of increase in the prices of non-food manufactured goods and persistently elevated food prices. Increasing capacity utilisation and rising commodity and energy prices further increase the risks of supply-side pressures translating into a generalised inflationary process. In order to anchor inflationary expectations and contain inflation going forward, the Reserve Bank has already announced a hike of 25 basis points in the repo and reverse repo rates. _____________________ 1 Eichengreen, Barry and Kevin O’Rourke (2009) “A Tale of Two Depressions” ,Vox, September 1. 2 Summer or monsoon crops which are usually sown with the first rains in July are referred to as kharif crops (e.g. rice, millets, maize, cotton, sugarcane). Winter crops which are harvested around March-April are referred to as rabi crops (e.g. wheat, barley, mustard, sesame, peas, oat). 3 External sources of funds include equity, domestic and foreign borrowings, trade credit and other current liabilities. The global financial crisis that originated from the subprime market swiftly impacted the global financial markets and subsequently affected the institutions and the real economies. The adverse feedback loop entrenched over time, as failing institutions and weakening growth prospects induced further stress in financial markets. Although Indian financial markets remained largely immune to the direct impact of the financial crisis until September 2008, the reversal in capital flows following failure of Lehman Brothers created stress in the domestic financial markets with significant hardening of overnight rates, correction in equity prices and pressure on the exchange rate. The Financial Stress Indicator (FSI) also suggests that the Indian economy experienced stress which peaked in October 2008 and lasted until March 2009. The Reserve Bank took a number of conventional and unconventional measures to improve domestic and foreign exchange liquidity and to contain excessive volatility. The counter-cyclical regulations applied ahead of the global crisis helped cushion against systemic instability. The domestic markets returned to normalcy much ahead of the global markets with a significant reduction in risk and a rebound in market activity. Global Scenario 4.1 The mortgage crisis in the US translated into systemic risk in mid-2008. Major commercial banks, investment banks, insurance and mortgage companies and other financial institutions in the US and Europe started suffering large losses that eroded their capital base. Credit spreads for all types of assets increased substantially. Although central banks/governments bailed out a number of failing financial institutions, financial markets continued to suffer from a crisis of confidence. Emerging market economies (EMEs), which showed considerable resilience in weathering the crisis up to September 2008, came under strain in the last quarter of 2008. 4.2 Extreme risk aversion, poor business and consumer confidence, deleveraging and the resultant deterioration in economic conditions raised the risk of a depression in mature economies in late 2008. As a result of decisive and extraordinary efforts by central banks, governments and other official institutions, the markets stabilised in early 2009. The systemic risks to the global financial system have now come down significantly. The various financial asset markets have started to rally since April 2009 prompted by better than expected economic data, improved corporate and financial sector earnings and a resurgence of business confidence. The upward shift in earnings expectations, particularly of the financial sector and improved confidence aided a recovery in risk appetite. As financial markets normalised, banks and corporates were able to raise capital from the markets. Such capital raising efforts were initially supported by credit guarantee programmes launched by various countries. 4.3 Nonetheless, the risk of a re-intensification of the adverse feedback loop between the real and financial sectors remained significant as long as banks were under strain and households and financial institutions remain highly leveraged (Global Financial Stability Report, October 2009, IMF). Financial Markets displayed bouts of intermittent volatility throughout 2009 reflecting this concern. However, market confidence was boosted by central banks/governments in advanced and developing economies reassuring markets that stimulus measures would be kept in place until the recovery process is sustained. Going forward, the inevitable withdrawal of stimulus measures needs to be carefully calibrated to ensure minimal disruption to the recovery process. 4.4 Pressures on banking sector liquidity during the financial crisis together with the extraordinary measures taken during the period have led to a shortening of the maturity profile of bank liabilities. This has, in turn, led to banks facing large refinancing needs in the coming few years. Management of such funding risk requires international banks to take advantage of every opportunity to lengthen the maturity of their debt and to diversify the structure of their liabilities to include more stable customer deposits. If not properly managed, this funding risk may hinder the recovery process. 4.5 Sovereign (Chart 4.1) and corporate CDS spreads (Charts No. 4.2.A and B) broadly stabilised from Q2 2009 after widening to historically high levels in late 2008 amidst high volatility. However, concerns about the sustainability of high debt levels mainly in some western European countries have led to the re-widening of sovereign CDS spreads in those countries in recent months. 4.6 The disruptions in financial markets were reflected in a sharp correction in equity prices and increased volatility across both advanced and emerging markets. Equity price indices in several advanced and emerging economies witnessed large declines in the range of 30-67 per cent (Chart 4.3). The correction in equity prices in some EMEs was sharper compared to that of the MSCI World index. As public policy measures were initiated, equity markets globally recovered sharply, especially since March 2009. As the signs of recovery became more evident, equity markets witnessed further gains in Q3 of 2009 only to correct towards the end of 2009 on the back of concerns about sovereign debt (Chart 4.4). 4.7 US treasury 10 year yields fell during the global crisis and stood at 2.5 per cent in March 2009. However, yields sharply retraced to touch a high of 4.0 per cent in June 2009 amidst reversal of ‘safe haven’ flows and receding fears of deflation. They have since remained in a range below 4.0 per cent. 4.8 Currency markets displayed heightened volatility during the global crisis. In the second half of 2008, the US dollar generally appreciated against most currencies, barring the Japanese yen and the Chinese yuan, as risk appetite waned and US investors liquidated their positions in the overseas equity and bond markets. The strength of the US dollar during the crisis was further accentuated by the huge US dollar shortage in the markets that prevailed post the Lehman bankruptcy with short term interbank LIBOR as a funding source drying up. This resulted from a currency and maturity mismatch arising from shorter term local currency funding and longer term investment in US dollar assets by banks (mainly European ones) using cross currency basis swaps and by rolling of FX swaps.
4.9 The failure of insurance giant, AIG, and a large Money Market Mutual Fund, Reserve Primary Money Fund, in the US led to the drying up of non-bank funding sources. As the crisis spread, there were severe dislocations in FX swap markets and a decrease in market liquidity caused a synthetic elongation in the maturity of financial assets held by the banks. Obtaining US dollar funds in the LIBOR market became extremely difficult owing to heightened counterparty risk perceptions. The resultant US dollar shortage eased after the Federal Reserve entered into US dollar swap arrangements with central banks of advanced economies and with those of Mexico, Brazil and South Korea. During the crisis period, a close relationship existed between the EUR/US$ exchange rate and the basis swap spread in the currency pair (Chart 4.5). 4.10 Since Q2 of 2009, the US dollar started depreciating against the major international currencies and against EME currencies due to a reversal of safe haven flows to the US, continuation of the easy monetary policy in the US and the relative attractiveness of the EME assets (Chart 4.6). 4.11 The stimulus measures have also significantly increased global liquidity. While this had the salutary effect of providing the backdrop to economic growth in troubled times, its impact on asset price inflation could be important going forward. Low interest rates in the US (the US has almost zero overnight interest rate which the Fed has committed to maintain for the foreseeable future2 ), coupled with lower volatility and reduced risk aversion, may incentivise capital flows that may potentially fuel asset price bubbles globally. According to the Institute for International Finance, a Washington based think-tank, conditions for such capital flows to emerging markets like India have never been more “propitious” since EMEs offer the “prospect of higher returns’’ and “less risks” unlike in the past when they carried “above-average risk”. Public debt as a proportion of GDP has been falling in EMEs, whereas the same is rising in mature economies. Also, growth in EMEs is now more domestic demand driven. Both these factors have increased the relative attractiveness of assets in EMEs.
Domestic Markets 4.12 Domestic financial markets were affected by the global financial crisis, though to a lesser extent compared to advanced markets. Widening credit spreads and higher liquidity premia reflected the tightness of the domestic financial market conditions reflecting stress in the international financial market during Q3 2008 and Q1 2009. The Indian rupee also weakened significantly and the equity markets experienced sharp corrections. Swift supportive action from the monetary and fiscal authorities ensured that the pace of recovery in financial markets was distinctly faster in case of India as compared to the global markets. Volatility, however, increased due to intermittent uncertainty about global economic revival, rising inflation and the possibility of a less than normal monsoon. These developments are discussed in the following paragraphs. Foreign Exchange Market 4.13 The decade before the crisis witnessed exponential growth in turnover in the domestic foreign exchange market. The daily turnover of all segments (spot, forwards and swaps) grew from around US$ 5 billion in 1997-98 to US$ 50 billion in 2008-09 reflecting the progressive liberalisation of foreign exchange markets and the increasing integration of the Indian economy with the global markets. Qualitatively too, the nature of the foreign exchange flows has changed significantly, with larger volumes emanating from the capital account, especially in the last five years. The movement of the US$/INR exchange rate has also reflected the trends in such capital flows and in equity markets (given that a significant part of such flows find their way to the equity market) (Charts 4.7 and 4.8). 4.14 The Indian rupee had traded in a range around INR 40 against the US dollar between October 2007 and April 2008. This period was characterised by large and sustained capital inflows. The Reserve Bank’s presence in the market helped manage the volatility and resulted in accretion to the foreign exchange reserves, thereby contributing to stability. Large capital outflows in the last quarter of 2008 dominated sentiments in the foreign exchange market and the INR depreciated by significantly more than 20 per cent. With the resurgence of capital flows, improvement in business sentiment and trade deficit, the currency has recovered significantly in 2009-10 (Chart 4.7).
4.15 Forward premia in Indian foreign exchange markets have generally been lower than the rate dictated by the interest rate differential (Chart 4.9). On some occasions, as in March and October 2008, the forward premia diverged further (and became negative on some days) in the wake of acute, though temporary, cash US dollar shortages. 4.16 The weakness in the Indian rupee against the US dollar in 2008 was also accompanied by heightened exchange rate volatility. The volatility of the US$/INR was, however, less pronounced than that of currencies of advanced countries, as was the case with the currencies of major EMEs (Chart 4.10). 4.17 The domestic foreign exchange market also exhibited expectations of appreciation of the US dollar against the Indian rupee, especially in the wake of the failure of Lehman Brothers. This was reflected in the shapes of volatility smiles in October 2008 (Chart 4.11) which showed the extremely high demand for US dollar calls as compared to the US dollar puts at various strike prices, resulting in a skewed structure. Moreover, the preference was for very deep in-the-money calls.
4.18 With the situation returning to near-normal, the skewness reduced significantly as can be seen from the volatility smiles a year later in October 2009 (Chart 4.12). Nonetheless, the skewness remained in favour of US dollar calls, particularly in the one year maturity. 4.19 The Reserve Bank’s actions in the domestic foreign exchange market reflect its objective of developing stable and liquid financial markets. In 2007, large capital inflows necessitated their absorption to prevent rapid and disorderly appreciation of the Indian rupee. Large foreign exchange reserves are an offshoot of this policy. 4.20 The purchase of US dollars by the Reserve Bank, however, turned into sale by June 2008 and this continued until May 2009. Such action was driven by the need to ensure orderly conditions in the market which had turned volatile (Chart 4.13). 4.21 The importance of capital flows in determining exchange rate movements leaves the domestic foreign exchange markets susceptible to international capital flows. The size and lumpy nature of the flows have also made the Reserve Bank’s liquidity management operations far more challenging. 4.22 Increased volatility makes hedging of foreign exchange risk by economic agents critical. It also tends to increase the costs of hedging. According to data compiled by the Reserve Bank from the commercial banks6 , the un-hedged exposure of corporates as a percentage of total exposures increased from 5.1 per cent as on December 2008 to 25.4 per cent as on March 2009. As this was a period of heightened volatility, unhedged exposures can impact the health of the corporate sector and translate into increased credit risks for the banking sector.
Government Bond Markets 4.23 In line with global trends of increased government spending in response to the economic slowdown, the Government announced stimulus packages during 2008-09 which resulted in net market borrowing through dated securities to nearly double from that of 2007-08. The net market borrowing for the year 2009-10 was about Rs.4,00,000 crores, 80 per cent of which was completed by late October 2009. 4.24 Concerns about high fiscal deficit (particularly when inflationary expectations are not benign) have put upward pressure on government bond yields. Higher bond yields have the potential to raise the cost of borrowings for the corporate sector and this constitutes a risk for economic recovery. However, the rise in yields moderated as the Reserve Bank announced its plans for open market operations to purchase government securities upto Rs.80,000 crores for the first half of 2009-10 and to issue securities of shorter maturities (Chart 4.14). In addition, Market Stabilisation Scheme (MSS) buyback auctions and open market purchases were synchronised with the Government's normal market borrowings and de-sequestering of MSS balances. By appropriately releasing liquidity to the financial system, the Reserve Bank ensured a relatively smooth conduct of the Government's market borrowing programme in 2009-10. 4.25 Turnover in the government bond markets has been a function of yield movements and the evolving fiscal position (Chart 4.15). The trading is generally high during times of softening yields. On the other hand, the market tended to become shallower and trading lacklustre during periods of rising yields, indicating the pre-dominance of long only investors in the market. The proportion of government securities in the trading book of financial institutions like banks that dominate trading is low. The reason for this is that much of the investment by banks in government securities is part of the mandated SLR requirement and is held to maturity to avoid the markto- market risk. 4.26 The yield curve shifted upwards between April 2008 and September 2008 due to general firming up of interest rates and the increase in policy rates viz. raising of repo rate from 7.75 per cent to 9 per cent. Thereafter,following the easing of liquidity and the sharp reductions in the policy rates (repo rate was brought down to 4.75 per cent by April 2009), the curve steepened significantly with the long term rates remaining somewhat sticky. The yield curve has since started to shift higher with the curve steepening further in the short end on the back of inflation concerns and higher supply of government bonds (Chart 4.16).
Corporate Bond Market 4.27 The primary market in corporate bonds is regulated by Securities and Exchange Board of India (SEBI) for both public and private placements by listed entities. SEBI also regulates the secondary market in corporate bonds, both OTC and exchange traded in India. The Reserve Bank is responsible for the regulation of repo market in corporate bonds. 4.28 As Chart No. 4.17 illustrates, trading in corporate bonds is low compared to the cash market in equities and government bonds. Issuance under private placement increased from Rs.1,28,601 crores in 2007- 08 to Rs.2,07,164 crores in 2008-09. In the period April- December 2009, issuance has been at Rs. 152,191 crores with the non-financial sector raising Rs. 81,617 crores. Public issues by non-financial entities constituted Rs.19,791 crores during this period compared to Rs.23,874 crores raised abroad via ECBs. 4.29 The impact of the financial crisis on the corporate bond market manifested itself through a sharp increase in the spreads on corporate bonds and a decline in the turnover after August 2008. However, with domestic money and government securities markets returning back to normalcy, the risk spread on corporate bonds also declined significantly by the end of Q4 of 2008-09 and there was marked improvement in volumes (Chart 4.17). The market activity has further increased thereafter as business confidence recovered and the demand for funds increased in tandem with economic recovery. 4.30 With ample liquidity, improved risk appetite, better financial results and investor confidence, spreads on corporate bonds narrowed to pre-crisis levels by June 2009. While government bond yields have steadily moved higher from the start of 2009 and until the end of the year, corporate bond yields have not matched the increase (Chart 4.18). As a result, corporate spreads have narrowed to below pre-crisis levels at the end of 2009, reflecting an improved risk perception. In contrast, commercial rates in the short end during the year fell but started rising towards the end of 2009.
4.31 There were some legal, regulatory and institutional bottlenecks impeding the development of the corporate bond market in India, many of which have been addressed in recent years through regulatory and other measures. These include removal of TDS on coupon payments, introducing repo in corporate bonds, reducing the minimum lot size for trading and reporting mechanisms to enhance transparency, simplifying the listing agreement and incremental disclosure requirement for listed corporates. The Reserve Bank is also in the process of introducing CDS in corporate bonds and this is expected to provide a fillip to the cash bond market. 4.32 However, some impediments to the development of the market still remain. Stamp duties in India vary depending on the state and the type of investor (it is lower in case of commercial and cooperative banks as investors). Institutional investors invest mostly in highly rated bonds. Issuers with high credit ratings tend to have the best of options open to them including ECB (External Commercial Borrowing) and domestic bank debt at sub-PLR rates. Therefore, the reliance on public issues is less even though such bonds do not have currency mismatches and interest rate reset clauses as is the case with term finance from banks. As recommended by the High Level Expert Committee on Corporate Bonds and Securitisation (headed by Shri R.H.Patil), product standardisation, a centralised database and improvement in bankruptcy procedures are among other bottlenecks which need to be addressed. Additionally, relaxation in the investment norms of the institutional investors and removal of restrictions on entry of long term investors like pension and provident funds could improve the depth of the market. Money Market 4.33 Increasing collaterisation in the money market has added to the inherent strength of this segment. During the Lehman crisis, the overnight rates firmed up due to the twin effects of the foreign exchange operations of the Reserve Bank to contain excess volatility and advance tax outflows from the banking system that drained out liquidity from the system. However, market activity remained robust, largely unaffected by counterparty concerns that affected money markets in developed countries. Collateralisation of inter-institutional markets and a daily access to the central bank under LAF served as effective stabilisers in the face of weak global sentiment. Overnight rates subsequently eased owing to reduction in policy rates and quantitative measures such as reductions in CRR to infuse liquidity. 4.34 The weighted average call money rate has mostly remained within the LAF corridor from November 2008 onwards (Chart 4.19) and liquidity position remained comfortable on a sustained basis from January 2010 onwards.
4.35 The CBLO and market repos trade well below the Reserve Bank’s reverse repo rate. Borrowings by banks of cash under CBLO were previously exempt from CRR requirements. This, inter alia, gave rise to an arbitrage opportunity wherein banks could borrow cash in CBLO and lend to the Reserve Bank under the LAF window. In the Second Quarter Review of Monetary Policy for 2009-10, this exemption was withdrawn. Money Market and Debt-oriented Mutual Funds 4.36 The mutual fund (MF) industry (other than UTI) in India is relatively young. The assets of mutual funds have grown by six times between 2003 and 2009. However, the majority of the assets under management of the MFs is contributed by corporates and banks and the retail participation is low. A large component of these assets are under Liquid (with investments upto 91 days maturity) or Liquid Plus (with investments maturing upto one year) funds. These schemes were the fastest growing segment within mutual funds. 4.37 The MFs are large lenders to the overnight money markets like CBLO and Repo, while banks are the major borrowers. At the same time, higher returns, good liquidity through early redemption facilities and tax arbitrage opportunities have seen the investment by scheduled commercial banks in Liquid and Liquid Plus schemes of the MFs grow manifold in the recent period. The funds invested by the MFs in banks were partly contributed by the banks themselves. Such circularity in movements of funds poses potential risk to the financial system. Liquidity risk resides in such mutual funds since their liabilities are withdrawable virtually on demand whereas the investments are for longer periods. 4.38 In the third quarter of 2008-09, mutual funds faced enormous redemption pressures from their institutional investors leading to panic selling of MF assets. In view of the pressures on MFs, the Reserve Bank introduced a liquidity refinancing scheme (through a 14-day repo) for banks’ lending to MFs. Despite the liquidity stress incident in 2008, the Liquid and Liquid Plus schemes continue to rely overwhelmingly on institutional investors like commercial banks whose redemption requests are likely to be large and simultaneous. A need has hence arisen for the MFs to align their sources of money to a broader set of investors, particularly retail investors. 4.39 Bank investment in MFs is observed to be correlated with MF investment in CPs. Bank investments in MFs tended to fall towards the end of Q2, 2009-10, and this coincided with a dip in MF investments in CPs. Similarly, with bank investment in MFs increasing after the quarter-end, deployment by MFs in CPs has also increased. Financial Stress Indicator 4.40 The recent financial turmoil has prompted renewed debate about the causes and impact of financial system stress. Measures of financial stress are useful for analysing the impact empirically. To assess the stress in the financial system in India, a Financial Stress Indicator (FSI) has been computed. This takes into consideration the volatility in various financial markets through different variability measures/ indicators in a combined form. The FSI is a composite index of a number of indicators like growth in bank credit, risk spreads, mortgage spreads, equity volatility, commercial paper spread, certificate of deposit spread, etc. Changes in the FSI are useful in evaluating whether stress is rising or falling and in establishing time frames for extreme events. The advantage of utilising such an index is the ability to depict the start, peak, and end of a financial stress episode and thereby to calculate its duration. Moreover, such an index facilitates understanding of the contribution of each component to the financial stress events. 4.41 The FSI for India comprises ten select components (Box 4.1), which are aggregated into an overall index to capture stress conditions in three financial market segments (banking, foreign exchange, debt and equity markets). These components (subindices) have been combined using variance-equal weighting method to create the composite FSI (Box 4.2). Since each component in the FSI is standardised, the level of stress for a current event can be compared only with that of an historical event in terms of their deviations from the mean. Therefore, the FSI is relative to the sample period used for its construction and captures the contemporaneous level of stress. 4.42 The FSI of India, which peaked in October 2008, has since declined (Chart 4.20). The stress condition lasted till March 2009. Box 4.2: Methodology for Computing Financial Stress Indicator (FSI) Financial stress is defined as the force exerted on economic agents by uncertainty and changing expectations of loss in financial markets and institutions. Study of financial stress in the economy is important for the policymakers to effectively gauge the current status of the economy and make informed decision. There are many indicators for different sectors of the economy which try to mirror the happening in that particular sector. Financial Stress Indicator (FSI) combines all these different indicators into a unified indicator and provides a measure of the current degree of stress in the financial system. It captures the contemporaneous level of stress. Computation of financial stress is a two step process i.e. (I) selection of indicators from different sections of the economy and then (II) combining these indicators using suitable methods. The indicators are selected from various sectors of the economy such as viz. banking sector, foreign exchange, debt and equity markets. Methodology The choice of how to combine the variables (the weighting method) is perhaps the most important aspect of constructing an FSI. Various weighting techniques such as factor analysis, variance-equal weights, and transformations of the variables using their sample Cumulative Distribution Functions (CDF) are being commonly used. a) Factor Analysis: The basic idea of factor analysis is to extract weighted linear combinations (factors) of a number of variables. This technique has two main purposes: (i) to reduce the number of variables, and (ii) to detect the structure in the relationships between variables. b) Variance-equal weights: A variance-equal weighting method generates an index that gives equal importance to each variable. It is the most common weighting method used in the literature. The variables are assumed to be normally distributed, which is the primary drawback of this approach. The mean is subtracted from each variable before it is divided by its standard deviation, hence the term “variance-equal” weights. c) Transformations using sample CDFs: Each variable is transformed into percentiles based on its sample CDF, such that the most extreme values, corresponding to the highest levels of stress, are characterised as the 99th percentile. The smallest values, corresponding to the lowest levels of stress, are characterised as the first percentile. The transformed variables are then summed equally to create the composite indicator. References: 1. Bordo, M. and A. Schwartz. 2000. “Measuring Real Economic Effects of Bailouts: Historical Perspectives on How Countries in Financial Stress Have Fared With and Without Bailouts.” NBER Working Paper No. 7701. 2. Demirgüç-Kunt, A. and E. Detragiache. 1998. “The Determinants of Banking Crises in Developing and Developed Countries.” IMF Staff Papers 45(1): 81-109. 3. Mark Illing and Ying Liu, “An Index of Financial Stress for Canada”, Bank of Canada working paper, 2003/14. 4. World Economic Outlook, IMF, April 2009, Chapter 4 “ How Linkages Fuel the Fire: The Transmission of Financial Stress from Advanced to Emerging Economies” Recent Policy Measures 4.43 The Reserve Bank’s calibrated and measured liberalisation and development of markets and market infrastructure paid dividends during the global crisis. Even during the period of stress, it continued to take a wide range of policy measures to further develop and liberalise the markets, some of which are outlined below. Bond Futures 4.44 In August 2009, with a view to widening the choice of hedging tools against interest rate risk, a bond future contract was introduced with a notional 10-year Government of India bond by the National Stock Exchange (NSE). Interest rate swaps and forward rate agreements have been introduced in 1999 and the former has attracted significant liquidity. However, the futures contract is yet to record high trade volumes. In fact, both turnover and open interest have fallen to very low levels in recent months (Chart 4.21). The suggestions received from the market participants for infusing liquidity into the product are being examined by the Reserve Bank. Currency Futures 4.45 Currency futures were introduced in NSE and MCX-SX in August and October 2008 respectively. The contracts are cash settled and unlike their OTC variants, do not require proof of any underlying that needs hedging. These two features largely explain the increase in trading volumes of the currency futures. Moreover, it is a far simpler product to trade and has a wider base of interested participants. Sustained increase in the volumes of currency futures in contrast to the almost stagnant open interest indicates that the market is driven largely by intra-day activity (Charts 4.22 and 4.23). Credit Default Swaps 4.46 The Second Quarter Review of the Monetary Policy 2009-10 announced a proposal for the introduction of plain vanilla OTC single name credit default swaps (CDS) for corporate bonds for resident entities subject to appropriate safeguards. To begin with, all CDS trades will be required to be reported to a centralised trade reporting platform and, in due course, they will be brought on a central clearing platform.
Concluding Remarks 4.47 Global financial markets, after a period of unprecedented turmoil, normalised to a degree in 2009. Spreads declined, equities recovered and volatilities receded from their peaks. Liquidity conditions improved due to swift and coordinated public policy measures. Going forward recent concerns about the sustainability of high debt levels mainly in some western European countries and the funding risk faced by banks during the coming years could pose some risks to global markets. 4.48 The global transmission of liquidity shocks was rapid and unprecedented. The steep decline in asset prices impacted market liquidity. The failure of global financial institutions and sharp deleveraging tightened the availability of funding. As the risk of growing illiquidity in markets cascading into solvency problems became entrenched, there were swift monetary and fiscal policy responses with a view to ensuring orderly functioning of markets, preserving financial stability. The global financial crisis affected all segments of the domestic financial markets. The Financial Stress Indicator (FSI) also suggests that the Indian economy experienced stress which peaked in October 2008 and lasted until March 2009. 4.49 The stress in India was felt in the form of substantial and quick correction in equity prices, excessive volatility in the foreign exchange market and pressure in the domestic money markets, emanating particularly from the reversal of capital flows and the stress on the domestic non-bank financial entities. The liquidity injection by the Reserve Bank ensured that the domestic markets stabilised by Q1 of 2009-10. The use of countercyclical regulations ahead of the global crisis helped preserve financial stability. The markets, on the strength of their robust infrastructure, continued to function in an orderly manner. Notwithstanding the financial crisis, the Reserve Bank continued with the development of financial markets with the introduction of new instruments such as currency and bond futures with appropriate safeguards.
4.50 Interest rate and growth rate differential between India and the developed markets has the potential to cause large capital flows into India. Capital flows have in fact already increased with rise in risk appetite in view of the early recovery in India, sharp improvement in asset prices and early exit initiated by India out of extraordinarily accommodative monetary policies compared to other developed and even some emerging markets. Large capital flows beyond the absorptive capacity of the economy exert pressure on the exchange rate and have implications for financial stability. They also increase the cost of sterilisation causing the fiscal burden to grow. 4.51 Corporate hedging behaviour is influenced by liquidity and risk appetites. If the former is low and latter high, it causes disincentives to hedge economic risks. Increases in un-hedged exposures by corporates during periods of volatility raises systemic concerns. _____________________ 1 Itraxx Crossover is the Markit iTraxx Europe Crossover Index and is composed of around 40 entities. The graphs use the series with effective dates in September 2008 and March, 2009 and maturity dates in 2014. Itraxx Europe is the Markit Itraxx Europe Index composed of 125 investment grade entities from various sectors like automobiles, energy, financials etc. The series used are the ones maturing in 2014. CDX Investment Grade is the Markit CDX North America Investment Grade index composed of 125 investment grade entities from various sectors and the two series used mature in 2014. CDX Crossover is the Markit CDX North America Crossover Index composed of 35 entities each having an eligible rating as defined in the index rules. The two series used mature in 2013. 2 The FOMC meeting held in January and later in March 2010 did have one member, Thomas Hoenig, dissenting the decision to retain the language seeking low rates for an extended period. 3 DXY represents the value of the US dollar against six developed market currencies. The highest weight is for the Euro at 57.6 per cent. The weights of the other currencies are as follows: Japanese yen: 13.6 per cent, Pound sterling: 11.9 per cent, Canadian dollar: 9.1 per cent, Swedish krona: 4.2 per cent and Swiss franc: 3.6 per cent. 4 ADXY is the Bloomberg-JP Morgan Asia Dollar index and is weighted in terms of trade and liquidity of Asian currencies. Chinese yuan has the highest weight in the index at 32.6 per cent. Weights of the other currencies are as follows : Hong Kong dollar : 11.8 per cent, Singapore dollar : 11.2 per cent, Korean won : 16.1 per cent and Indian rupee : 6.1 per cent, Indonesian rupiah : 2.9 per cent, Malaysian ringgit 5.4 per cent, Philippine peso 1.9 per cent, Taiwanese dollar : 7.6 per cent and Thai baht : 4.4 per cent. 5 A volatility smile is a plot of implied volatility against strike prices for an underlying. The shape of such a plot is normally like that of a smile and therefore, the name. This is a typical shape in option markets other than for equities. It has been observed that deep out-of-the-money and deep in-the-money strike prices have higher implied volatility in the market when compared to the estimates using normal probability distribution. While at-the-money options have implied volatilities that are closer to estimates using a normal probability distribution. The implication of higher implied probability is that the market estimates deep out-of-the-money and deep in-the-money strike prices to have a higher probability of occurrence than the ones implied by normal curve distributions. A skewed shape as in Chart 4.17 suggests a great demand for buying calls and selling puts of US dollars against the Rupee. 6 The data pertains only to the exposures/hedges of above US$ 25 million. The amount of unhedged exposure has been determined without taking in to account the natural hedges available to domestic entities. The data also does not cover exposures of FIIs and other non-resident entities. These hedges also include forwards/options booked under the past performance facility, for which underlying may not be available as yet. The assessment of the portion of unhedged exposures on the buy side & sell side separately is not possible currently. Chapter V The key feature of the Indian financial system is its heterogeneity. It derives its strength from its soundness and resilience, which have ensured that the sector was not impacted significantly even during the most acute period of the global financial turmoil. Commercial banks, the dominant segment of the financial sector, have remained healthy, though incipient signs of deterioration in asset quality could cause some concern going forward. This has manifested itself in an improved rating outlook for the entities in the sector. Significant measures have been taken in the co-operative banking sector which is recording an improvement in its performance parameters, though concerns remain. The NBFC sector has been well regulated in general and the NBFCs-ND-SI, in particular, are under close monitoring. However, some strengthening of the supervisory regime for the NBFCs- ND-SI will be needed for a more robust assessment of the underlying risks. Overall the performance of the banks and non-banks within the regulatory ambit of the Reserve Bank through this troubled period has been found to be satisfactory. Financial Institutions Structure 5.2 Banks have traditionally been the most important financial intermediaries in India, accounting for approximately 70 per cent of total assets in 2009 (Chart 5.1). The commercial banks dominate the sector, comprising more than three-fifths of financial system assets. The financial intermediation by banks in India has played a central role in supporting the growth process, by mobilising savings.
5.3 NBFCs, which provide a gamut of services and account for around 9 per cent of financial sector assets, have become an integral part of the financial system in India, playing a crucial role in broadening access to financial services, enhancing competition and bringing in greater risk diversification. 5.4 Insurance institutions, accounting for nearly 13 per cent of the total financial system assets, are dominated by public sector insurance companies, although private participation in this sector has been permitted since 2000. As at end-March 2009, there were forty-four insurance companies operating in India, of which twenty-two were in the life insurance business. Of the remaining, twenty-one were in general insurance business and one was a national re-insurer. The total premium collected by insurance companies during 2008-09 stood at about Rs. 2.5 lakh crore. Insurance penetration (insurance premium as a per cent of GDP) during 2008 was relatively low at 4.0 per cent for life business and 0.6 per cent for non-life business. 5.5 The financial institutions, in aggregate, have registered an impressive Compounded Annual Growth Rate (CAGR) of 17.8 per cent in terms of asset growth between 2007-2009. During this period, the share of banks in the financial sector assets has increased. This could primarily be due to the fact that, in the immediate aftermath of the failure of Lehman Brothers, there was a flight of funds from the mutual funds and insurance sectors and banks were perceived as safer havens. During 2009-10, however, mutual funds, especially money market mutual funds, have seen an increase in assets under management. This is largely attributable to a significant deployment of wholesale funds, particularly from the banking and corporate sectors, in the wake of easy liquidity conditions, slackening of credit demand, risk aversion on the part of banks and the advantages of some tax arbitrage and early redemption available for such investments. Commercial Banks Growth Trends 5.7 Healthy economic growth, especially since 2005, has also facilitated impressive growth in the commercial banking sector (Chart 5.2). Though the growth rate of the consolidated balance sheet of commercial banks moderated in 2008-09 at 21 per cent as compared to 25 per cent in 2007-08, the sector continued to grow at a rate higher than that of the nominal GDP (at current market prices). Accordingly, the ratio of commercial banking assets to GDP increased to 98.5 per cent at end- March 2009 from 91.6 per cent as at end-March 2008. The ratio, however, remained well below that of other Asian economies like Hong Kong and Korea as well as developed nations like the USA, UK and Switzerland (Chart 5.3).
5.8 The overseas presence of Indian banks and the scale of their operations are limited and have in fact, fallen in the last few years. As at end-March 2009, it comprised 4.4 per cent of total assets. The near absence of direct exposure to toxic assets insulated the Indian banks from the full adverse impact of the global crisis. 5.9 The annual growth rate of aggregate deposits of SCBs decelerated from 24.1 per cent in 2006-07 to 23.4 per cent in 2007-08 and further to 22 per cent in 2008- 09. Growth in bank credit also declined sharply to 19.8 per cent in 2008-09 from 23.1 per cent in 2007-08 and 28.5 per cent in 2006-07 (Chart 5.4). 5.10 With the impact of the financial crisis gradually affecting the global economy, credit off-take slowed down further and the year on year growth in bank credit during the first half year of 2009-10 stood at 12.3 per cent. During the same period, investments grew by 34.5 per cent (as compared to 6.3 per cent as on September 2008). However, there are early signs of credit growth recovering in line with the economy, on the back of fiscal and monetary measures. This trend is clearly shown by the movements in incremental credit-deposit (CD) and investment-deposit (ID) ratio in recent periods (Chart 5.5). Balance Sheet Structure and Changing Risk Profile Assets 5.11 A common size analysis of commercial bank assets revealed a directional shift in funds deployment from investments to credit until 2008 (Chart 5.6). Thereafter, the share of investments has grown. This reflected the slower credit off-take, increased risk aversions by the commercial banks (leading to preference for risk-free sovereign paper) as well as increased government borrowing to finance the fiscal stimulus measures. 5.12 Lending rates (as reflected by the banks’ Benchmark Prime Lending Rates (BPLRs)) fell, as credit growth slowed after September 2008, but the reduction in rates was not commensurate with the easing of monetary conditions during the same period. The Reserve Bank, in the Report of the Working Group on Benchmark Prime Lending Rate (2009), highlighted the asymmetric downward stickiness of lending rates.
Banks responded quickly during the monetary tightening phase (March 2004 – September 2008) through increases in BPLR, but were slow to reduce the BPLR when monetary policy was eased (Table 5.1). Some of the factors accounting for the downward stickiness of the lending rates according to the Report were, the cost of deposits being contracted at high rates in the past, administered interest rates for small savings which constrain reduction in deposit rates, the prevalence of concessional lending rates linked to BPLRs to some sectors and persistence of the large government borrowing programme. A more effective and speedier transmission of monetary policy during the monetary easing phase since September 2008 could have made the impact of the measures more effective. Liabilities 5.13 Deposits continue to be the main source of funds for SCBs and have maintained their share in total liabilities over the years. There has been a marginal increase in the share of capital in the liabilities of SCBs between end-March 2005 and end- March 2009 (Chart 5.7). 5.14 Public sector banks accounted for 79.8 per cent and 88.7 per cent of incremental deposits in end-March 2005 and end-March 2009 respectively (Chart 5.8). This was accompanied by a sharp fall in the share of new private sector banks which fell from 13.3 per cent to 3.7 per cent. This was largely attributable to the higher interest rates offered by public sector banks for wholesale and large-ticket deposits and possibly due to customers’ perception that in troubled times, the public sector banks act as safe havens.
5.15 In recent years, some deceleration in the growth rate of low cost, current and savings accounts (CASA) deposits is discernible. The share of such deposits in total deposits has declined to 32.9 per cent in December 2009 from 35.6 per cent in December 2006 (Chart 5.9). The corresponding increase in higher cost term deposits, could test the profitability of the banks. With effect from April 1, 2010, banks will be required to pay interest on a daily balance basis in savings accounts. This could impact the cost of funds for the banks and consequently their margins. Nonetheless, the cost of CASA deposits would continue to remain low relative to term deposits. 5.16 Amongst the various segments of commercial banks, the share of CASA deposits in total deposits is the highest for the foreign banks and the lowest for the old private sector banks (Chart 5.10). 5.17 Household deposits2 constitute more than 50 per cent of the total deposits, though these deposits are witnessing a declining trend. The share of top 20 depositors hovered between 10 and 14 per cent between March 2005 and September 2009. Also, the dependence of commercial banks, on inter-bank deposits and certificate of deposits, have been low at approximately six per cent to eight per cent taken together (Chart 5.11). 5.18 However, the share of large-ticket deposits (Rs 15 lakh and above) as a percentage of term deposits had seen an increasing trend and stood at a significant 65.8 per cent as at end March 2008. It reduced only marginally to 63 per cent as at end-September 2009 (Chart 5.12). Reliance on such bulk deposits, which are typically more volatile than retail deposits and also entail a higher cost, have implications for the profitability of banks, their liquidity and asset-liability management.
5.19 Deposit rates declined post September 2008 in line with the downward revision of policy rates and excess liquidity in the system (Chart 5.13). Sectoral Analysis 5.20 The asset growth of commercial banks in the last few years was mainly driven by the growth in credit to retail, real estate and infrastructure sectors (Chart 5.14). Retail Assets 5.21 The retail sector witnessed unprecented growth during the boom period in the economy. However, the adoption of counter-cyclical prudential norms since 2005, coupled with moderation in economic growth has restrained growth in the retail sector 3 and its share in total advances declined from 26.5 per cent in September 2006 to 19.8 per cent in December 2009. Infrastructure funding 5.22 The Eleventh Five-year Plan (2007-12) has projected an investment requirement of roughly Rs.20,00,000 crores towards physical infrastructure in India. The Reserve Bank has initiated a number of measures for promoting infrastructure funding (Box 5.1). With limited alternate funding sources, banks’ exposure to the sector has increased over the periods. The rate of growth in this sector has been very high and consistently above 30 per cent (Chart 5.15). Infrastructure funding by banks could pose a potential area of macroeconomic vulnerability, on account of the potential asset-liability mismatches associated with such financing. Real estate 5.23 The correlation between banks’ exposure to the real estate sector and financial crises has been validated by several historical episodes, the latest being the subprime crisis. Housing Loans 5.24 In India, bank credit to this sector grew strongly in recent years (significantly higher than the growth of total bank credit) with some moderation during the global crisis. Growth of housing loans, fell from a high of 31.2 per cent in December 2006 to a low of 4.1 per cent in March 2009. Given the high growth in housing loans and its sensitivity to asset price fluctuations, risk weights and provisioning norms for banks exposure to this sector were adjusted as a counter-cyclical measure. Moderation in housing prices in some centres, together with easing of provisioning norms to the earlier levels as a counter-cyclical measure, resulted in a pick-up in demand – the year on year growth rate recovered to 14.6 per cent in December 2009 (Chart 5.16).
5.25 Some concerns have emerged in recent times in respect of “teaser” rates for home loans offered by banks. These “teaser” home loans initially have a low fixed interest rate, which in later years increases to higher levels. There are, therefore, concerns about the borrowers’ ability to service such loans, if interest rates were to rise sharply and the consequent impact on the asset quality of the bank. Effective borrower education and awareness in this respect is of importance.
Box 5.1: Measures for Infrastructure Lending The Reserve Bank had initiated a number of regulatory measures / concessions for infrastructure lending. Some of the important measures are: • Banks have been allowed to enter into take out financing arrangement with IDFC/other Financial Institutions. • The existing capital adequacy treatment of take-out financing is in conformity with the capital adequacy treatment of forward asset purchases under both Basel I and Basel II. The issue was reconsidered and it was proposed to allow banks to build up capital for take-out exposures in a phased manner. An internal group in the Reserve Bank has been set up for introduction of plain vanilla OTC single-name CDS for corporate bonds for resident entities which would be subject to subject to appropriate safeguards. Source : Reserve Bank of India.
Commercial real estate 5.26 The growth in banks’ commercial real estate exposure decelerated since 2007 (Chart 5.17), which could be attributable to various factors including the impact of regulatory measures like increased risk weights and hikes in provisions for standard assets. It is widely recognised that downturns in prices and loan loss cycles in the commercial real estate markets are usually strong. However, for better monitoring of the sector, there is an urgent need for developing an appropriate database of commercial real estate prices in India, advances to which have been growing at a rapid pace in recent times. 5.27 In the wake of the global crisis, the Reserve Bank, inter alia, reversed some counter-cyclical prudential measures with respect to provisioning for standard assets and risk weights, including for commercial real estate exposures. However, on concerns on asset quality, given large increase in credit to the commercial real estate sector and the extent of restructured advances in this sector at 14 per cent (for select banks with high commercial real estate exposure), the provisioning for standard assets in this sector has been increased from 0.4 per cent to one per cent. NBFCs 5.28 Given the risk of contagion and the possibility of regulatory arbitrage, and also to address issues on concentration risk, banks exposures’ to NBFCs are subject to strict exposure norms. Risk weights and provisioning norms for this sector were also periodically increased until October 2008. The prudential requirements were reduced in November 2008 when the sector experienced liquidity shortages.
5.29 While the growth rates in this sector have been fluctuating, a longer term analysis shows that there has been a slight upward trend in the share of advances to the NBFC sector as a percentage to total bank credit (Chart 5.18). Unhedged exposures of corporates 5.30 Buoyed by the favorable economic environment, the corporate sector had been witnessing a fast paced growth. The easy liquidity conditions and depressed risk premia in global markets before the onset of the crisis prompted many corporates to explore cheaper sources of funding overseas, like ECBs and ADRs/GDRs. The resultant exposures, if unhedged, could expose the corporates to exchange rate risk and have an adverse impact on their domestic borrowings as well. As discussed in Chapter 4 of this Report, a tendency by corporates to leave foreign exchange exposures unhedged during the period of disturbance has been evidenced. Banks have been advised that their Board policy should explicitly recognise and take into account risks arising from unhedged foreign exchange exposures of all their clients. Further, for arriving at the aggregate unhedged foreign exchange exposure of clients, their exposure from all sources including foreign currency borrowings and ECBs should be taken into account. Banks have also been advised that foreign currency loans above US $ 10 million, or such lower limits as may be deemed appropriate vis-a-vis their portfolios of such exposures, can be extended only on the basis of a well laid out hedging policy of their Boards. Sharing of information about corporate credit history 5.31 The Reserve Bank has introduced various measures for effective sharing of information among banks about the credit history and the conduct of the borrowers, especially information on borrowers enjoying credit facilities from multiple banks. CIBIL, set up in 2001, provides objective credit information that helps the financial institutions manage credit risk and devise appropriate lending strategies. Credit concentration 5.32 An analysis of the exposure of banks to their top 20 borrowers, revealed that there were seven instances of large corporate group exposures exceeding 40 per cent of the net worth of the bank (Chart 5.19). In another 37 instances, the level of funding was between 30-40 per cent of the banks’ net worth. Loan syndication and loan sales would be useful in distributing the exposure more evenly.
Off-balance Sheet Exposure 5.33 Derivatives play a critical role in shaping the overall risk profile of banks. Over the years, banks in India had been increasingly using derivatives to manage risks and have also been offering these products to the corporates. The off-balance sheet exposures (OBS) of banks, which witnessed high growth in recent years, has decelerated since March 2008 (Chart 5.20). This partly reflected the onset of the global financial crisis and the consequent freezing of the international markets as well as the tightening of prudential norms by the Reserve Bank. Though the outstanding notional principal of OBS exposure is close to two times onbalance sheet assets for commercial banks in India, the credit equivalent (current exposure) was less than three per cent of total OBS exposures as at end December 2009. What could however be a cause for concern is the concentration of such off balance sheet exposures. In particular, foreign banks in India account for approximately three-fourths of the total OBS exposure in the Indian banking system while accounting for only ten per cent of the total on balance sheet bank assets. 5.34 In the aftermath of the global financial crisis, Indian banks suffered some MTM losses on their exposures on credit derivatives and other international investments, but they were not very significant. MTM losses have also shown a significantly declining trend since January 2009 with the narrowing of credit spreads (Chart 5.21). 5.35 In 2007-08, in the light of MTM losses and disputes on certain derivative products sold by the banks, the Reserve Bank reviewed the derivative transactions of select commercial banks and identified certain common irregularities that constituted violations of FEMA provisions and guidelines. The Reserve Bank has also tightened regulatory norms in this respect – computation of capital requirements on such exposures on the current exposure method (instead of the original exposure method), the introduction of provisioning requirements for derivative exposures as applicable to standard loan assets and extension of asset classification norms (including the principle of borrower-wise classification) as applicable to loan assets to derivative receivables. More stringent monitoring of such exposures has also been introduced.
Financial Soundness Indicators Capital Adequacy 5.36 Banks in India are well capitalised as reflected by their capital adequacy ratio which is well in excess of the minimum ratio of 8 per cent prescribed by the Basel Committee and 9 per cent by the Reserve Bank. The overall CRAR of commercial banks in India improved to 14.1 per cent at end-December 2009 from 13.2 per cent in end-March 2009 (Chart 5.22). Core CRAR of banks at 9.7 per cent as at end-December 2009, has also remained well above the 6.0 per cent norm prescribed4 by the Reserve Bank from April 1, 2010. 5.37 In the Indian case, the core Tier I5 component stands at healthy levels at close to 95 per cent of the total Tier I capital which is a source of comfort (Chart 5.23). Importantly, Tier I capital does not include items such as intangible assets and deferred tax assets that are now sought to be deducted. 5.38 The comfortable capital adequacy position indicates that there is no immediate concern about banks’ ability to fund credit expansion, once the growth momentum picks up. Nevertheless, the Government has decided to access a World Bank Banking Sector Support Loan of US$ 2 billion which will provide budgetary support to the Government of India for enhancing the capital of some public sector banks from a medium term perspective. The amount will be provided through a Development Policy Loan (DPL). A possible second DPL, for about US$1 billion, is likely to be provided by June 2010. 5.39 As at end-March 2009, all Indian banks had migrated to the Standardised Approach under Basel II. The time schedule for implementation of advanced approaches under Basel II has also been notified. The bank group-wise CRAR as at end-March 2009 is shown in Table 5.2.
5.40 Amongst the BRIC countries, the average CRAR of Indian banks remained below the average CRAR of Brazilian and Russian banks (Chart 5.24). Leverage 5.41 High leverage in the financial system has been considered as one of the major factors leading to the recent global turmoil. The leverage (ratio of assets and off balance sheet items (credit conversion factors) to capital) of the Indian banking system which stood at 16.3 times at end-September 2009, decreased marginally to 16.1 as at end-December 2009. Pertinent here is the fact that scheduled commercial banks in India are stipulated to hold a minimum of 25 per cent of their net demand and time liabilities in approved liquid securities. The system-wide leverage ratio, net of such approved securities, was considerably lower at 13.0 as at end- September 2009 and 12.9 as at end-December 2009. 5.42 An analysis of the CRAR and leverage of the top 60 banks in India (in terms of asset size) indicate that most banks were closely concentrated in the range of CRAR of 12-16 per cent and leverage between 13-20 times respectively as at end-September 2009 (Chart 5.25). There was only one outlier bank with a relatively high leverage and low CRAR which accounted for just 0.2 per cent of total bank assets and hence was not considered to be a source of significant risk /concern to stability. As at end- December 2009, no bank was in the high risk category of low CRAR and high leverage.
5.43 The ratio of bank capital to assets (an approximate inverse of leverage) of BRIC countries shows that India’s ratio, though comfortable, has been below that of Brazil and Russia (Chart 5.26). Asset Quality 5.44 Aided by the buoyant economic growth, NPA levels of the banks witnessed a declining trend till 2007-08. In 2008-09, some increase in NPA levels is, however, observed (Chart 5.27). The provision coverage ratio6 (Loan Loss Provision/Gross NPAs – LLP/GNPA in the chart) of commercial banks indicates a declining trend. However, no significant deterioration in the NPA ratios is observable. Stress tests for credit risk (as detailed in Chapter VII of this Review) also indicate a reasonable degree of resilience of banks to withstand unexpected deterioration in credit quality. 5.45 The Gross NPA ratio in India has consistently been low when benchmarked against the BRIC countries (Chart 5.28) though India’s provision coverage ratio does not compare favorably. 5.46 The very rapid credit growth prior to the onset of the current crisis and the subsequent downturn have put some pressure on the asset quality. The low and generally declining asset slippage ratio of commercial banks until 2008 has been showing an increasing trend since then. Post the crisis, the prudential norms on restructuring of standard advances (corporate workouts) were also modified as a one time measure, which could also further pressurise asset quality (Chart 5.29). The possibility of a significant increase in the slippage ratio in 2009-10 can therefore, not be ruled out (Chart 5.30). 5.47 The Reserve Bank has, now, as a counter-cyclical measure, announced that banks need to attain a provision coverage ratio of 70 per cent of their nonperforming assets by September 2010. The policy announcement comes in the wake of asset quality concerns on the one hand, and reasonable profits of the banking system, on the other. As in other countries, post the global crisis, the Reserve Bank also is working on appropriate counter-cyclical provisioning methodology along the lines of Spain’s ‘Dynamic Provisioning’ system. While the imposition of additional provisions would make the banks more resilient to credit losses, it could impact their profits, going forward.
Profitability Indicators 5.48 The Return on Equity (RoE) and the Return on Assets (RoA 7 ) ratios of commercial banks in India have remained stable over the last few years. An analysis of the derivation of RoA reveals that better asset utilisation has sustained the RoA ratios in 2008-09, despite some decline in profit margin (Table 5.3). However, if margins come under pressure due to slippages in asset quality, increase in provisions etc., it would be a challenge to the banking sector to maintain its existing RoA level, particularly in a growing balance sheet scenario. 5.49 The RoE of the banking system has remained relatively low, mainly on account of a declining equity multiplier. In the face of the reasonable growth in bank assets, a declining equity multiplier is a source of regulatory comfort as it implies that a larger portion of banks’ earnings are retained and transferred to loss absorbing common equity. 5.50 A decomposition of the sources of income shows that the dominant contribution is on account of interest income from traditional banking, which lends stability to profitability (Chart 5.31). However, in the current environment of heightened competition and increasing disintermediation, net interest margins could be squeezed. There is, therefore, a need to diversify towards other income sources which have been stagnant in the past few years. 5.51 Interest, especially interest on customer deposits, accounts for the largest share of expenses (Chart 5.32). The share of staff expenses to total expenses has declined reflecting rationalisation of staff and increasing outsourcing of banking operations. Provisions and taxes, which showed a declining trend, could strain profitability during the current fiscal year on account of the increased provisioning norms announced by the Reserve Bank and a possible rise in NPAs.
5.52 India’s RoE and RoA have been very stable over the last few years and even in the face of the global crisis as compared to that of other BRIC countries (Chart 5.33). Liquidity and Solvency 5.53 Banks in India have been actively managing their asset-liability mismatches based on regulatory guidelines which cover management of interest rate risk and liquidity risk. In terms of the guidelines, banks are required to monitor the cumulative mismatches across all time buckets in a statement of structural liquidity by establishing internal prudential limits. For the short term (up to 28 days), regulatory stipulations in terms of limits on mismatches as a percentage of cumulative cash outflows have been prescribed. The guidelines were fine-tuned in October 2007 by adopting a more granular approach to measurement of liquidity risk in the very short term. 5.54 A gap analysis of the short term time buckets (up to 28 days) indicates no major liquidity vulnerability at the system level with positive mismatches discerned in all the time buckets (Table 5.4). 5.55 From a longer term perspective, an analysis of the maturity profile of the deposits, advances and investments of banks, for December 2006, as compared to December 2009, for the periods less than one year and more than five years (Table 5.5) was conducted. The analysis indicates concentration of deposits at the shorter tenure and credit deployment in the medium to long term tenure, implying structural mismatches embedded in the balance sheet. Growing infrastructure financing may further widen the existing asset liability mismatches. However, the reduction in the maturity profile of investments during the period has offset the structural mismatches and resulting liquidity risk to some extent. The trade off is evidently between a more comfortable liquidity position and higher return. 5.56 The liquidity ratio analysis (Table 5.6) reveals an increasing reliance on volatile liabilities to support balance sheet growth. The share of core deposits to total assets has progressively declined over the years (except in the last two quarters of 2009). Despite a high ratio of temporary assets to total assets, the coverage of liquid assets in relation to volatile liabilities has remained less than one, indicating potential liquidity constraints. The dependence on purchased liquidity by the banks as seen from Ratio 4 ([Loans + Mandatory CRR + Mandatory SLR + Fixed Assets] / Core Deposits) however, has shown a marginal decline from 2008-09 levels. (Detailed definitions of liquidity ratios and their implications are in the Annex 1).
Outlook 5.57 Banks in India are well capitalized in terms of regulatory capital adequacy ratio. The existence of mandated liquid investments gives a further sense of regulatory comfort. Though there was a directional shift in funds deployment from investments to credit in recent years, which enhanced credit risk, of late the composition has witnessed a changed trend with increased allocation to credit risk free government securities. Though the present asset quality continues to give a sense of comfort, there are indications of asset quality coming under strain in view of the very rapid credit expansion prior to the downturn. 5.58 The imbalance in the maturity profile of loans and deposits of SCBs is mitigated to an extent by their increased reliance on short term investment assets. With an increasing importance of infrastructure financing in the bank loan portfolio, the higher concentration of short term deposits may further widen the existing asset liability mismatches. Despite a decline observed in recent periods, reliance on bulk deposits continued to remain high impacting the cost and stability of deposit base. A analysis of liquidity ratios reveals positive mismatch in the short term time buckets. However, increased dependence on volatile liabilities to support balance sheet growth is observed which needs corrective action. 5.59 The ratio of the credit equivalent of off balance sheet items to the balance sheet size of banks is low at around 3 per cent. However, such exposures, particularly those related to complex derivatives, are concentrated in a few foreign banks, which could be a cause for concern. With fast expanding corporate sector and extant exposure norms, the headroom available to banks is constrained and needs to be addressed through greater use of loan syndications.
5.60 Profitability as measured by RoA has remained fairly stable around one per cent over the past few years aided by favourable economic environment. Going forward, profitability may come under strain on account of possible deterioration in credit quality and increased provisioning requirements. In this scenario, sustaining RoA would crucially depend on optimal asset utilisation as profit margins may tend to suffer. 5.61 The positive outlook in respect of commercial banks in India also manifests itself in the improved rating outlook for the banks (Table 5.7). Regional Rural Banks 5.62 Regional Rural Banks (RRBs) were conceived as institutions that combined the local feel and familiarity of co-operatives, with the business organisation ability of commercial banks. The RRBs’ equity is held by the Central Government, concerned State Governments and the sponsor banks in the proportion of 50:15:35. Though accounting for just 1.8 per cent of financial system assets, with their deeper base, these institutions are ideally suited to promote financial inclusion in the rural areas. Though RRBs present minimal risk because of their small size, the risk of contagion always remains. 5.63 Until recently the financials of RRBs were less than adequate. In order to reposition RRBs as an effective instrument of credit delivery in the financial system and make them viable and profitable, a state level sponsor bank-wise amalgamation programme was initiated from September 2005, which reduced the number of RRBs from 196 to the current number of 86. Also, the implementation of a scheme of phased recapitalisation of 27 RRBs with negative net-worth has been completed. The improvement in the performance of the RRBs since amalgamation in recapitalisation is evident in the improvement in both asset quality and profitability indicators (Chart 5.34). Cooperative Sector 5.64 The cooperative banking sector in India constitutes approximately ten per cent of the total assets of the banking sector and seven per cent of the financial system assets. Hence the size of this sector remains small compared to the commercial banks. Its structure comprises of urban cooperative banks and rural co-operative credit institutions. Some of the major regulatory and supervisory issues in the sector are discussed below. Dual control 5.65 While incorporation/registration and management-related activities of cooperative banks are regulated in the States by the Registrar of Co-operative Societies or the Central Registrar of Co-operative Societies, banking-related activities are under the regulatory/supervisory purview of the Reserve Bank of India or NABARD. This duality of control affects the quality of supervision and regulation and the functioning of co-operative banks. The regulatory weakness fosters inefficiency and impedes the development of governance principles as well as burdening the banks with multiple levels of compliance and reporting requirements. In order to mitigate this problem, the Reserve Bank has entered into MoUs with State Governments on a voluntary basis by which a Task Force for Urban Co-operative Banks (TAFCUB), comprising representatives of the concerned government, federation of UCBs and the Reserve Bank has been formed. Similarly, in the case of rural cooperative banks, MoUs have been entered into by the majority of State Governments with NABARD, under a package recommended by the Vaidyanathan Committee.
Impairment in governance and management 5.67 A unique feature of the co-operative banking system in India has been that it is the borrowers who have a significant say in the management of the bank, as they contribute to the share capital of the banks. This is a cause for concern, as the Board members of the bank are elected by borrowers, resulting in the policies of the bank not always being in congruence with the interests of depositors. In view of the propensity of these banks to pursue borrower-oriented policies, rather than policies that should be in favour of protecting depositors’ interests, the involvement of depositors in the management of these banks needs to be enhanced by encouraging membership of depositors, on par with borrowers. 5.68 Another reason for impairment of governance in the co-operative banking structure (as well as Regional Rural Banks) is attributed to interference in matters related to appointment of directors on the basis of political affiliations rather than on merit. This manifests itself in a lack of professional expertise at the board level and interference in decision making, particularly in respect of loan sanctions which can eventually impact adversely their financial health. Unlicensed Banks 5.69 The Banking Regulation Act, 1949 was extended to co-operative banks with effect from March 1, 1966. Primary Co-operative Credit Societies which were existing and carrying on banking business as at March 1, 1966 were allowed to carry on banking business until licences was refused in terms of Section 22 (2) of the Act. Further, even after 1966, as and when the owned funds of a primary credit society reached Rs.1 lakh, it had to apply to RBI for a licence and pending issue of the licence, it could carry on banking business. As at December 2009, there were 313 unlicensed co-operative banks (Table 5.8).
5.70 It has been decided that all unlicensed UCBs having minimum CRAR of 2 per cent on the basis of inspection conducted with reference to financial position as at March 31, 2008 could be granted a licence. Licence applications of UCBs not complying with the above norm by March 2010 could be rejected. Similarly, in line with the CFSA recommendation, it was decided to draw up a non-disruptive roadmap for ensuring that only licensed co-operatives operate in the rural cooperative space. Accordingly, licences are to be issued to State Co-operative Banks and Central Co-operative Banks which had CRAR of 4 per cent and above as per the last inspection report of NABARD. Urban Cooperative Banks 5.71 The Primary (Urban) Co-operative Banks (UCBs) constituted just 2.4 per cent of the assets of the Indian financial institutions as at end-March 2009. UCBs exhibit a high degree of regional concentration, with five states (Andhra Pradesh, Gujarat, Karnataka, Tamil Nadu and Maharashtra) accounting for around 80 per cent of the total number of UCBs. 50 out of the 53 scheduled UCBs are in Andhra Pradesh, Gujarat, Karnataka and Maharashtra. In terms of size, their importance in the Indian financial sector has been diminishing, as the growth in this sector in recent years has been considerably less than the growth of commercial banks (Chart 5.35). However, they play an important role as financial intermediaries in the urban and semi-urban areas, catering to the non-agricultural sector, particularly small borrowers. 5.72 UCBs are divided into four grades on the basis of their performance to determine the frequency of supervision, based on select financial parameters.While Grades I and II can be categorised as stronger banks, Grades III and IV correspond with the weaker segments of the banks. 5.73 A draft Vision Document10 for UCBs by the Reserve Bank in March 2005 highlighted the problems of the sector and outlined the broad measures to be adopted to enable the UCBs to emerge as a sound and healthy network of banking institutions. Keeping their role and potential in mind, the Reserve Bank has taken several initiatives to develop the sector. Measures Taken to Enhance Viability of the Sector 5.74 In order to address the problem of dual control, the Reserve Bank has entered into MoU with 26 State Governments and with the Central Government (for multi state UCBs). Such MoU arrangements now cover over 99 per cent of the banks and they account for over 99 per cent of deposits in the sector. 5.75 Further, recognising the varied nature of UCBs, the Reserve Bank has devised a two-tier regulatory framework wherein some relaxation has been made in prudential norms in respect of smaller UCBs (Table 5.9). Also, various measures like consolidation of the sector, permitting restructuring of liabilities by converting a part of deposits of the large depositors into equity capital and Innovative Perpetual Debt Instruments have been encouraged. To overcome the difficulties in raising of capital funds and achieving the prescribed capital adequacy norm (CRAR) of 9 per cent, the Reserve Bank has permitted raising of capital by way of preference shares and long term deposits. 5.76 There has been a change in the profile of the sector due to measures taken in recent times as indicated above. The number of banks in Grade I or II has increased significantly from 61 per cent of the total banks as at March 31, 2005 to 77 per cent of total as at March 31, 2009 (Chart 5.36). The number of Grade III and Grade IV UCBs taken together has correspondingly declined from 39 per cent of the total as at March 31, 2005 to 23 per cent of total as at March 31, 2009. Scheduled UCBs – An analysis 5.77 Scheduled Urban Co-operative Banks (SUCBs), which are typically larger UCBs, account for around 44 per cent of total assets of the sector. There were 53 SUCBs as at end-March, 2009. An analysis of the annualised growth rates of various balance sheet parameters as given in Table 5.10 reveals that the decline in annual growth at end March 2009 on the items was due to lower growth in the first half of the year i.e. in the half year ended September 2008; also the lower growth in deposits resulted in the SUCBs taking recourse to borrowings in 2008-09 to fund their assets.
5.78 While the NPA ratios have been declining over time for SUCBs, the level of gross NPA ratio still remains high. (Chart 5.37). The high loan loss provisions (Chart 5.38) has resulted in a low net NPA ratio. Though this has the potential of impacting profits in the sector adversely, presently, the RoA has maintained a positive trend. 5.79 One source of comfort is that the sector is well capitalised. The reasonably high level of CRAR (12.8 per cent at end March 2009) is supplemented with a declining leverage ratio (Chart 5.39). Rural Cooperative Sector 5.80 The rural co-operative sector which constitutes 4.7 per cent of the financial system assets can be bifurcated into short-term and long-term. The shortterm structure is three tier with the State Co-operative Banks (StCBs) at the apex, followed by the District Central Cooperative Banks (DCCBs) at the intermediate level and the Primary Agricultural Credit Societies (PACS) at the village level. The long-term cooperative structure on the other hand is two tiered with the State Co-operative Agriculture and Rural Development Banks (SCARDBs) at the apex level followed by the Primary Co-operative Agriculture and Rural Development Banks (PCARDBs) at the district or block level. These institutions were conceived with the objective of meeting long-term credit in agriculture. The Reserve Bank is mandated to regulate the StCBs and DCCBs and their supervision is vested with NABARD. 5.81 This sector has a critical role in improving financial inclusion and catering to vital sectors, like agriculture and allied economic activities. However, it raises a number of challenges such as dual regulatory control, weak management information systems, poor internal controls, a low resource base, poor asset quality, low levels of profit and high accumulated losses. The sector is generally impaired financially and institutionally. Some of the banks have substantial deposit base (there are 12 StCBs having deposit base of more than Rs. 1,000 crore each as on March 2008 - Data NAFSCOB). The system level data for the rural co-operative institutions is available with a time-lag and this hampers an up-to-date analysis (Chart 5.40, Chart 5.41 and Chart 5.42).
5.82 Though the size of this sector is small, as it is a part of the payment and settlement systems, it is prone to the risk of contagion. Public policy, therefore, aims at keeping this sector viable and strong through various forms of active intervention. 5.83 A revival package spelling out the financial, legal and institutional measures for restructuring was announced by the Government of India for the shortterm rural co-operative credit structure and make it a well-managed and vibrant medium to serve the credit needs of rural India, especially the small and marginal farmers (Box 5.2). It is expected that after the revival package is implemented in full, the financial position of these banks and their resilience will improve. Non Banking Financial Companies 5.84 The non-banking financial companies (NBFCs) in India comprise of heterogeneous entities, of which broadly, the Reserve Bank regulates companies accepting public deposits and those non-deposit accepting entities involved in asset financing, providing loans and investments. Other non-banking entities such as housing finance companies, mutual funds,insurance companies, stock broking companies, merchant banking companies, venture capital funds, portfolio management etc. are regulated by the respective sectoral regulator and are exempted from the NBFC regulations.
Box: 5.2: Transfer of Assets and Liabilities of Urban Co-operative Banks Commercial Banks in Legacy Cases In view of the presence of a large number of weak urban cooperative banks(UCBs) and to facilitate their non disruptive exit from the sector, RBI had issued guidelines for merger / amalgamation of UCBs in Feb 2005, paving the way for amalgamation of weak UCBs with financially strong UCBs. As per these guidelines, the acquirer bank should protect the entire deposits of all the depositors of the acquired bank on its own or with financial support from the State Government, even when the net worth of the acquired bank is negative. Further, as a part of the measures to strengthen UCB sector, a scheme of amalgamation of weak UCBs with strong UCBs with DICGC support is considered by the Reserve Bank in cases involving UCBs having negative net worth as on March 31, 2007. However, in those cases, where proposal for amalgamation within the UCB sector are not forthcoming, it has been decided to provide DICGC support to scheme involving transfer of assets and liabilities (including branches) of legacy cases of urban cooperative banks to domestic scheduled commercial banks, provided the scheme ensures 100 percent protection to depositors and DICGC support is restricted to the amount as provided under Section 16(2) of the DICGC Act, 1961. Source : RBI. 5.85 The NBFCs regulated by the Reserve Bank are broadly classified into non-deposit taking (NBFC-ND), deposit taking (NBFC-D) and residuary non-banking finance companies (RNBCs). Their size is equivalent to approximately nine per cent of the total assets of the financial sector. NBFCs-ND have been further bifurcated into NBFC-ND-Systematically Important (SI), comprising companies with asset size of Rs. 100 crore and above and NBFC-ND-Others. 5.86 The NBFCs-ND-SI are the largest and fastest growing segment in the NBFC sector. The consolidated balance sheet size of NBFCs-ND-SI recorded a growth of 27.3 per cent in 2008-09. The significant increase in balance sheet size is mainly attributed to sharp increases in owned funds, debentures and other liabilities. The details of various types of NBFCs along with their respective regulators are given in Box 5.3.
Box 5.3: Various Types of Non-Banking Financial Companies (NBFCs) The heterogeneous nature of the non-banking financial companies sector is widely recognised. They perform diverse activities and are currently categorised under various sectors. Depending on their primary sphere of specialisation, the regulatory responsibility of these entities is distributed across regulators. A company is considered as an NBFC and is within the regulatory jurisdiction of the Reserve Bank if it carries on as its business or part of its business, any of the activities listed in Section 45 I (c) of the RBI Act, 1934. In other words, to be an NBFC, an institution has to be (i) a company under Companies Act; (ii) it should be engaged in financial activity; and (iii) its principal business should not be agricultural, industrial or trading activity or real estate business.
NBFC-ND-SI: Financial indicators 5.87 The NBFC-SI sector is well capitalised with an aggregate CRAR of 39 per cent as of March 31, 2009. There has, however, been an increase in the NPA ratios of the NBFCs-SI. The gross NPA as a per cent of total credit exposure increased sharply from 2.0 per cent as at end July 2008 to 4.6 per cent in July 2009. The net NPA as a percentage to total credit exposure during the same period also increased from 0.9 per cent to 2.7 per cent. Funding Issues 5.88 The major funding sources for NBFCs include debentures, borrowings from banks and FIs, Commercial Paper and inter-corporate loans (Table 5.11). 5.89 Banks are a major source of funding for NBFCs, either directly or indirectly. Besides advancing loans, banks also are major investors in bonds/debentures issued by NBFCs. This results in dependence of NBFCs on banks, raising the vulnerability to systemic risk in the financial system. Prudential norms have been tightened for bank lending to NBFCs in terms of bank exposure limits, higher provisioning requirement and higher risk weights of the borrowing NBFC. These measures limit the intermediation in the system. 5.90 As the recourse to bank financing is restricted, the NBFCs are dependent on other sources like debentures, commercial papers and inter-corporate deposits for funding their asset deployment. A significant portion of these instruments issued by NBFCs are being funded by mutual funds. Hence, NBFCs could be prone to asset liability mismatches, and consequently be exposed to liquidity risks. In the post- Lehman fallout, particularly in the third quarter of 2008- 09, there was a systemic liquidity crunch wherein the NBFC sector was stressed. Faced with withdrawal pressure, the mutual funds, which subscribed to the short term NBFC debt, were unable to either roll over or extend further credit. This caused a liquidity crisis for the sector and a potential crisis of confidence. The Weighted Average Discount Rate (WADR) for the Commercial Paper (CP) issued by NBFCs increased, reaching a high of 14.2 per cent in October 2008 (Chart 5.43). NBFCs were further stressed as bank loans to them had dried up and interest rates had increased in the money markets, leading to enhanced cost of borrowing, curtailing avenues for further growth in business. The fact that NBFCs relied more on short term borrowings also created an ALM mismatch for them.
5.91 A scenario of asymmetrical information and general risk aversion of banks was expected to strain the NBFC sector and potentially pose a systemic risk. Therefore, it was decided to provide liquidity to those NBFCs-SI facing temporary liquidity mismatches through an SPV. The key part was that the liquidity was provided to the SPV by the Reserve Bank through purchase of fully guaranteed government bonds. Further, this facility was only meant to tide over temporary liquidity mismatches and not to facilitate balance sheet expansion. The aggregate quantum for the facility was Rs. 20 crore and the interest rate was the LoLR rate for banks. Banks were also permitted, on a temporary basis, to use the liquidity support under the LAF window through relaxation in maintenance of SLR up to 1.5 per cent of their NDTL, exclusively for meeting the funding requirements of NBFCs and mutual funds. 5.92 Though the utilisation of these schemes has been low, the Reserve Bank along with the Government has helped build confidence in the sector with the launch of this ‘Last Resort’ facility. 5.93 There has been a significant decline in the WADR which was at a benign 4.7 per cent in June 2009, indicating that as a source of funds, the cost constraints of CPs issued by NBFCs are now lower. The number of issues also increased to approximately 100 from 20 in October 2008. However, in spite of banks being flushed with liquidity, the bank borrowings by NBFCs did not increase (Chart 5.44). This was probably due to risk aversion of banks, high cost of funds and a cautious approach and risk management by the NBFCs. 5.94 The balance sheet components of NBFCs-ND-SI did not exhibit any major structural changes as a response to the liquidity issues faced by them. However, the sector continues to be vulnerable to liquidity shocks as funding risk continues to be high with low diversification of sources available to fund the balance sheet growth. Thus, given the inter-linkages which the NBFCs have with the real sector and other players, the stability issues need to be addressed over time. In this context, while capping of bank lending to NBFCs has a prudential objective, the corporate bond market is an alternative financing source to enable their growth. The development of the corporate bond market could have an added benefit of increasing the NBFCs’ recourse to longer term funds and reduce their ALM mismatch.
Concluding Remarks 5.95 The duality of control of the co-operative banks affects the quality of their supervision and regulation and also their functioning. A cause for concern in the co-operative banking sector is that only borrowers, being members and shareholders of the co-operative banks, are eligible to elect Board members. This, in turn, results in connected lending to the members which is detrimental to the basic tenets of corporate governance in addition to being detrimental to depositors’ interests. 5.96 Though not as sound as commercial banks, the UCBs have generally showed an improvement in all performance indicators. This is seen in the increase in the categories of Grade I and II banks in the sector from 61 per cent of the total banks as on March 31, 2005 to 77 per cent of total as on March 31, 2009. 5.97 Notwithstanding the critical role played by the rural co-operatives in financial inclusion, their financial viability and soundness remain areas of concern. The revival package for the short-term rural co-operative credit structure, if implemented in full, is expected to improve the financial position of these banks as also their resilience. 5.98 The performance of the NBFC sector has been satisfactory though there is some concern on the credit quality. The business model of NBFCs should be based on the nature and tenor of liabilities raised by them. To the extent NBFCs do long term funding, they will need to rely on long term sources such as corporate bonds and debentures since their dependence on bank funding is prudentially capped. Going forward, the critical issue for NBFCs will be to bring their asset profile in line with the liability profile. Another aspect which will necessitate close monitoring are the interconnected flows between banks and NBFCs on the one hand, and the movement of funds between NBFCs and other group entities, especially those active in the capital market, on the other. _____________________ 1 Since increased by 75 basis points in the 3rd Quarter Review of the Monetary Policy 2009-10. 2 Household Sector comprises 1. Individuals (including HUF) i) Farmers ii) Businessmen, Traders, Professionals and Self-Employed Persons iii) Wage and Salary Earners iv) Shroffs, Money Lenders, Stock Brokers, 2. Trusts, Associations, Clubs etc 3. Proprietary and Partnership Concerns 4. Educational Institutions 5. Religious Institutions 6. Others 3 Retail credit includes individual housing loans. 4 The stipulation is higher than the Basel requirement of minimum 4 per cent Tier I capital. 6 Provision Coverage Ratio = (Provision for Credit Losses / Gross NPAs) * 100. This does not include technical write-offs. 7 RoA =Net profit/Asset=Net profit/Total income *Total income/Asset 8 Equity Multiplier = Total Assets / Total Shareholders’ Equity. 9 While the mandatory CRR/SLR are treated as illiquid assets for the purpose of analysis embedded in balance sheets, it is actually a source of liquidity, subject to regulatory intervention. 10/en/web/rbi/-/publications/reports/draft-vision-document-for-urban-co-operative-banks-437 Chapter VI The global financial crisis has shown that robust financial sector policies and secure financial infrastructure are pre-requisites for financial stability. Since the crisis, most countries, including India, are in the process of improving their financial regulation and supervisory infrastructure to prevent and remedy such large scale financial turmoil and contain the fall-out of any financial crisis in the event that it occurs. A number of global initiatives to improve financial sector regulation are under consideration. The crisis has also highlighted the importance of inter-regulatory co-ordination and co-operation for the prevention of systemic disturbances. The assessment of the strengths and weaknesses of the payment and settlement systems indicate certain vulnerabilities which could have an impact on financial stability. The legal infrastructure has been assessed with particular reference to pendency in the resolution process, which remains a major bottleneck in the Indian financial system. Safety nets in the form of deposit insurance also help promote financial stability, though a few vulnerabilities exist. Financial Sector Policies 6.1 In the pre-crisis framework, the three pillars of Basel II, namely capital adequacy, supervisory review process and market discipline were generally seen as adequate and appropriate. However, the crisis has revealed that many international banks needed higher and better quality capital, in part because there was an underestimation of risk. The supervisory review process for assessing capital adequacy and the overall supervisory frameworks for early identification of vulnerabilities also failed because of complex interconnectedness between financial institutions and markets which was difficult to understand without robust macroprudential supervision. The disclosures envisaged in Pillar 3 proved to be insufficient in the light of the complexity of financial instruments and information asymmetries were generated. In the postcrisis period, the emerging global consensus is increasingly in support of regulatory actions that will strengthen prudential regulation, both at the macro and micro level. This will need to be integrated appropriately into the national regulatory regimes over time. 6.2 Various initiatives are now underway, internationally, to review the policies relating to financial regulation and supervision in order to put into effect the lessons learnt during the crisis. A consensus on the directions that need to be taken has been achieved in the form of the agenda designed by the G20 for strengthening the global financial system. International bodies like the Financial Stability Board (FSB), the Basel Committee on Banking Supervision (BCBS), the International Accounting Standards Board (IASB) and the International Organisation of Securities Commissions (IOSCO) have been working on the evolution of fresh guidance to financial institutions including banks, in the light of shortcomings in various standards noticed during the global financial crisis. Some major global initiatives to strengthen policies related to financial regulation and supervision are discussed later in this Chapter. 6.3 The Indian financial system has been evolving and has stood the test of time during the recent global financial crisis. The inherent strengths that existed even prior to the crisis, as well as the reforms now being contemplated based on recommendations of international standard setting bodies, lend it resilience and have ensured that its stability has not been threatened. India has always remained committed to adoption of international best practices, though suited to local institutional, structural and operational underpinnings, to strengthen and enhance its regulatory and supervisory structure. In some aspects, India has gone ahead with the implementation of additional regulatory safeguards with respect to, inter alia, counter-cyclical provisions and risk weights and safeguards for securitisation. These initiatives have been detailed in Chapter II of this Report. 6.4 Requirements of capital adequacy under Basel II have been implemented in India for all commercial banks with effect from March 31, 2009. A time schedule (Box 6.1) has been provided for the migration of prepared banks to the advanced approaches. For the rest of the banking sector, a more gradualist approach has been favoured. The implementation of Basel II in India, however, presents significant challenges in respect of the possible increase in the overall regulatory capital requirements, the intensive data requirements and the need for banks to review and upgrade internal processes to be able to capture the information needed and requirements of skilled human resources. Penetration of external rating in India, though increasing, continues to be low and rating continues to be instrument-based instead of borrower-based. The implementation of the advanced approaches under Basel II would also cast an onerous responsibility on the supervisors in terms of guiding the banking system through the implementation phase and validating the internal models, system and processes adopted by the regulated banks. Box 6.1: Changing Composition of Regulatory Capital in India Capital adequacy has traditionally been regarded as a sign of strength of the financial system. Sections 11 and 12 of the Banking Regulation Act, 1949 provide for a requirement as to minimum paid-up capital and reserves and the regulation of capital. In 1992, the Reserve Bank of India introduced a capital to risk weighted asset ratio requirement for banks (including foreign banks) in India as a capital adequacy measure largely in conformity with then prevalent international standards, under which banks were required to achieve an 8 per cent capital to risk-weighted assets ratio. The pattern of assigning risk weights and credit conversion factors was also delineated, broadly in line with those in the Basel I Accord, which was the first internationally accepted framework for measuring capital adequacy and a minimum ratio to be achieved by the banks. Guidelines on market risk were introduced in March 2002. In June 2004, banks were advised to maintain capital against market risks in two phases over a two year period, as follows: a) Capital for market risks on securities included in the Held for Trading category, open gold position limit, open foreign exchange position limit, trading positions in derivatives and derivatives entered into for hedging trading book exposures by March 31, 2005; and b) in addition to (a) above, capital for market risks on securities included in the Available for Sale category by March 31, 2006. Over the years, the Basel I framework was found to have several limitations and a need was therefore felt to replace this Accord with a more risk-sensitive framework, to address these shortcomings. After a wide-ranging global consultative process, the BCBS released the “International Convergence of Capital Measurement and Capital Standards: A Revised Framework” in June 2004 which was further updated in November 2005. Keeping in view the Reserve Bank’s goal to have consistency and harmony with international standards, all commercial banks in India (excluding Local Area Banks and Regional Rural Banks) were required to adopt the Standardised Approach (SA) for credit risk, the Basic Indicator Approach (BIA) for operational risk and continue applying the Standardised Duration Approach (SDA) for computing capital requirement for market risks. Foreign banks operating in India and Indian banks having operational presence outside India migrated to the above selected approaches under the Revised Framework with effect from March 31, 2008. All other commercial banks migrated to these approaches under the Revised Framework by March 31, 2009. Banks proposing to migrate to advanced approaches are expected to undertake an objective and strict assessment of their compliance with the minimum requirements for entry and on-going use of those approaches. Keeping in view the likely lead time that may be needed by the banks for creating the requisite technological and risk management infrastructure, including the required databases, the MIS and the skill up-gradation, etc, the following time schedule has been announced for implementation of the advanced approaches for the regulatory capital measurement :
6.5 As part of its efforts to continuously benchmark itself against international best practices, India, through the Committee on Financial Sector Assessment had, inter alia, conducted a self assessment of its compliance with the Basel Core Principles in respect of commercial banks. The Committee concluded that the country was largely compliant with the Principles. Recent regulatory initiatives 6.6 Some of the major global initiatives in regulation and supervision on which work is in progress internationally are discussed below. Raising the minimum capital requirement 6.7 The global financial crisis revealed that the level of capital maintained by several institutions for their exposures, particularly exposures in the trading book, proved to be inadequate in the face of increasing losses. Accordingly, the Basel Committee has finalised various enhancements to increase capital requirements in respect of exposures which are essentially related to securitisation and resecuritisation activities of banks. Most of the proposed enhancements relate to the advanced approaches of the Basel II framework. Since commercial banks in India are presently following the simpler Basel II approaches, enhancements applicable to the Standardised Approach are being implemented at present. Improving the quality of bank capital 6.8 Another important area of work taken up by the Basel Committee is improving the quality of capital. Going forward, the focus will increasingly be on substance over form and on Tier I rather than Tier II capital, especially on common equity. The Basel Committee is developing specific eligibility criteria for inclusion of instruments and elements in Tier I capital. As discussed in Chapter V of this Report, the quality of capital in Indian banks does not pose any specific concern at this stage. Further, Tier III capital has not been permitted for banks in India. Operationalising a liquidity risk framework 6.9 Recognising that illiquidity of banks can threaten solvency as much as inadequate capital and also adversely impact the stability of the financial system, work is under way to develop an international framework for regulation and supervision of liquidity risk. This includes the implementation of the Basel Committee’s principles on sound liquidity risk management and supervision, the development of a global standard for liquidity regulation of cross-border banks, and strengthening information sharing on liquidity risk among home and host country supervisors. The Basel Committee is currently finalising its proposals for the introduction of a global liquidity standard that would help address liquidity requirements in stress situations. The standard will comprise a short-term liquidity coverage ratio and a longer-term structural funding ratio. The standard will also set out an internationally consistent definition of highly liquid assets that can form part of the liquidity buffer of a bank. Appropriate liquidity disclosure requirements will also be developed. 6.10 In India, ALM stipulations regarding liquidity risk management are already in place. Also, liquidity ratios focusing on funding and market liquidity are monitored on an ongoing basis. Indian banks are mandatorily required to keep a certain proportion of their net demand and time liabilities primarily in government securities (currently 25 per cent). An enhanced liquidity risk management framework is being worked out, taking into account the lessons from the crisis and the work undertaken by the international standard setting bodies. Restricting leverage 6.11 In addition to addressing capital requirements, the Basel Committee has also initiated a proposal to introduce a transparent and simple leverage ratio to measure and restrict balance sheet and off-balance sheet leverage of banks, as a supplement to risk based capital requirements. India has supported the initiative of developing the leverage ratio prescription to supplement the capital ratio, while indicating that the leverage ratio should exclude the statutory requirement of liquid assets comprising government securities. An assessment of leverage for Indian banks in March 2009 indicated that while the aggregate ratio was 16.83 times when SLR securities were included, it fell to 13.65 times on excluding the SLR securities. Securitisation 6.12 The complex and multi-layered securitisation market has been identified as one of the causes of the sub-prime turmoil. Post the crisis, the securitisation market has come to a virtual standstill. However, with a view to some critical economic functions being performed by securitisation, internationally, there continues to be an active interest in reviving this market, albeit subject to increasing regulatory safeguards. Predominant among these safeguards are elements related to risk retention by the originator and amortisation of profits arising out of securitisation. The focus is also on simplification of securitisation instruments and increased disclosures. 6.13 Regulatory instructions in force in India already prescribe safeguards such as restrictions on recognition of true sale and on up-front booking of profits. Further, the Second Quarter Review of Monetary Policy for 2009- 10, in an attempt to ensure that originators do not compromise on due diligence, had also proposed a minimum lock in period for securitised loans and a minimum retention of 10 per cent of the pool of assets securitised. 6.14 Covered bonds have emerged as a more secure alternative to securitisation in recent years and are extremely popular in European markets. Full recourse to an issuer, is a key difference between securitisation and covered bonds. In the case of covered bonds, a full recourse right, creates an unrestricted and unconditional obligation on the issuer to repay the debt, hence credit risk is not transferred. Covered bonds are being actively promoted in the wake of the disrepute that securitisation and the ‘originate-to-distribute’ model have endured during the financial crisis. However, covered bonds are not a cure all. They have some intrinsic issues which need to be resolved before they can be promoted as an adequate alternative to securitisation. In particular, covered bonds may result in preferential treatment of certain creditors and impounding of good quality assets leading to increase in risk to the deposit insurance funds and non-insured depositors. Sound compensation principles 6.15 Prior to the crisis, compensation policies in financial systems were viewed as being largely unrelated to risk management and risk governance. Short-term profits were rewarded with little regard to the longer-term risks taken to generate those profits. Such rewards fueled excessive risk-taking and this was considered as a factor that contributed to the global crisis. Post the crisis, compensation policies are increasingly being viewed as an integral part of the risk management system. The FSB has formulated principles for sound compensation practices which call for effective governance of compensation and for compensation to be adjusted for all types of risk, to be symmetric with risk outcomes and to be sensitive to the time horizon of risks. 6.16 In the Indian context, in terms of the Banking Regulation Act, 1949, private sector banks and foreign banks are required to obtain approval of the banking regulator, i.e. the Reserve Bank, for remuneration payable to their Chairman/CEO, to ensure that such remuneration is not excessive. In case of public sector banks, the remuneration of Chairman and Managing Directors is fixed by the Government of India. The Reserve Bank is also working on adopting the sound compensation principles outlined by the FSB, as announced in the Second Quarter Review of Monetary Policy 2009-10. It proposed to issue guidelines aligning the compensation policy with the risk management framework in banks and to make them applicable to all the risk takers in the bank and not just the Chairman/CEO. Regulating Credit Rating Agencies 6.17 The Basel Committee is considering options to mitigate the negative incentives arising out of the reliance of the Basel II framework on external ratings. An important proposal in this regard is to enhance the oversight of credit rating agencies and further strengthen the eligibility criteria for their accreditation under the Basel II framework. The Reserve Bank, in coordination with SEBI, will work to ensure enhanced oversight of credit rating agencies which are accredited / proposed to be accredited under Basel II (Box 6.2). Facilitating the adoption of international accounting norms 6.18 The global financial crisis highlighted the role of valuation of financial instruments and transparency in financial markets. Application of fair valuation techniques in illiquid markets was identified as a factor that exacerbated the crisis. With a view to enhancing sound regulation and strengthening transparency, the G-20 called on the accounting standard setters to work with prudential regulators to, inter alia, reduce the complexity of accounting standards for financial instruments, strengthen accounting recognition of loanloss provisions, improve accounting standards for provisioning, off-balance-sheet exposures, valuation uncertainty and to work towards a single set of highquality global accounting standards. 6.19 The International Accounting Standards Board (IASB) announced an accelerated timetable for replacement of IAS 39, which is the International Accounting Standard dealing with Financial Instruments: Recognition and Measurement. Exposure drafts in respect of classification and measurement of financial assets and on impairment have been published in November 2009. IASB and the US Financial Accounting Standards Board (FASB), jointly in consultation with other national standard setters, are working towards convergence between International Financial Reporting Standards (IFRS) and the US GAAP. However, the progress in this respect is slow on account of significant differences in areas such as classification, measurement and impairment norms. 6.20 The Institute of Chartered Accountants of India (ICAI) has announced the mandatory convergence of Indian Accounting Standards with IFRS from April 1, 2011. Subsequently the Ministry of Corporate Affairs has announced a roadmap regarding mandatory convergence of corporates in a phased manner commencing from April 1, 2011. A separate roadmap for convergence of banks and insurance companies is under preparation. Going forward, the convergence programme would be a major challenge for the Indian banking system in view of the rigorous requirements of skill upgradation, changes in IT systems, maintenance of parallel accounts during the transition period and implementation issues. Moreover, the slow progress in the convergence programme leaves limited time for India to assimilate and introduce these standards and appropriately amend prudential norms linked to them. Box 6.2: Credit Rating Agencies - Migration Matrix One of the methods used to assess the reliability and performance of credit ratings provided by credit rating agencies (CRAs) is through the analysis of credit migration matrices1. A migration matrix is based on the past changes in the credit quality of a rated entity or instrument and indicates the probability of rating migrations in various rating categories of the CRAs rating scale. The matrix is constructed by comparing ratings assigned by a CRA in various rating grades at the beginning of a reference period with those achieved at the end of the period for a given pool of issuers or issues. A migration matrix provides two important inputs to assess the rating performance of a CRA. It provides stability rates, which indicate the probability of a rating remaining stable or unchanged within the given time horizon and also provides the transition or mobility rates, which indicate the probability of a rating being upgraded or downgraded, including to the default grade, within the given time horizon. The diagonal of a migration matrix shows the stability rates and all other cells show the mobility or transition rates. Instability becomes apparent if a sizeable number of ratings in a rating category jump several categories up or down over a given time period. Default and transition rates from migration matrices can be used to validate rating scales and quantify rating stability of a CRA’s ratings. A one year migration matrix displays all rating movements between rating categories from the beginning of the year through the end of the year. Using migration matrices for several years, the past average stability rates, as well as the transition rates and default rates for various rating grades can be ascertained. These provide an indication of the performance of the CRA in terms of the reliability of its ratings. In addition to assessing rating stability of a CRA, migration matrices are also used for various other purposes and by other interested parties. They provide useful and relevant information to those investors that need to regularly mark their investments to market. Default and transition rates form critical inputs for the pricing of a debt instrument or loan. Structuring and pricing of credit-enhanced instruments also depend on default and transition rates of underlying borrowers and securities. Analysis of rating transitions, including transition to default is useful in estimating future credit losses and measuring credit risk. Default data and transition rates help identify the value distribution of the portfolio of their credit assets. The ratio of upgrades to downgrades provides information about the ‘drift’ in the ratings and can be indicative of deterioration or improvement in overall credit quality. Migration matrices also provide valuable insight into the impact of ageing on credit quality. The Committee on Comprehensive Regulations for Credit Rating Agencies set up by the HLCCFM, had commissioned a study on historical analysis of soundness and robustness of CRA predictions in India. Notwithstanding the fact that the rated universe is presently small in India, the study brought out the relative fragility of the rating methodology as reflected in the transition data which showed high degree of rating migration. References
Cross-border co-operation and bank resolution framework 6.21 The various initiatives taken post the current financial crisis underline the importance of cross border supervisory co-operation and information sharing as a measure to reduce the probability of recurrence of a crisis. The issue is also gaining importance in the Indian context with an increasing number of Indian banks opening branches overseas as well as the sizeable presence of foreign banks operating in India. 6.22 In the absence of any legal/formal arrangement entered into by the Reserve Bank with overseas supervisory authorities for cross-border supervisory cooperation, India had been assessed by CFSA as ‘materially non-compliant’ with the Basel Core Principles in relation to ‘home-host relationships’. While there exist informal systems of exchange of supervisory information on specific issues between the Reserve Bank and some overseas banking supervisors/regulators on a bilateral, ‘need to know’ basis, there have been some legislative issues in entering into formal arrangements in this respect. In substance, such arrangements meet the broad requirements of cross border supervisory co-operation even though India is technically non-compliant with the core principle. However, it has now been decided to enter into MoUs with overseas regulators for exchange of supervisory information within the available legal framework, while simultaneously pursuing the required legislative changes. 6.23 The crisis has also shown that the existing legal and regulatory arrangements across jurisdictions are not generally designed to resolve problems in a financial group operating through multiple legal entities, both cross-border and domestic financial groups. There is no international insolvency framework for financial firms at present and there are limited prospects of one being created in the near future. The Basel Committee has recently published a Report and recommendations of the Cross-border Bank Resolution Group. Dealing with Systemically Important Financial Institutions (SIFIs) 6.24 The global crisis has thrown up the importance of dealing with SIFIs. International initiatives in this respect encompass definitional and identification issues, issues relating to appropriate level of oversight/ regulation, additional capital charge for systemically important banks and those relating to the winding down and resolution of these entities. The focus is also on regulatory home-host co-operation and supervisory colleges are being proposed. 6.25 In the Indian context, the global operations of SIFIs, termed financial conglomerates in India, are not very significant and the need for supervisory colleges for such institutions may not be necessary at this juncture. Within the country, there already exists a monitoring and oversight framework of financial conglomerates where the three major regulators viz. the Reserve Bank, SEBI and IRDA are involved (Box 6.3). The ‘principal’ or ‘lead’ regulator holds periodic meetings (generally half-yearly) with the concerned sectoral regulators and the group entities. The oversight framework envisages monitoring by the ‘principal’ regulator, off-site monitoring and sharing of supervisory information with other regulators. Of the 12 identified financial conglomerates, the principal regulator is the Reserve Bank in eight cases, IRDA in three cases and SEBI in one case. In order to strengthen the microprudential oversight of financial conglomerates, the Reserve Bank, in consultation with other sectoral regulators is in the process of implementing an enhanced framework for regulation and supervision of financial conglomerates. Regulating private pools of capital 6.26 Internationally, a view is emerging that large, systemically important banking institutions should be restricted in undertaking proprietary activities that present particularly high risks and serious conflicts of interest. The Group of Thirty in its report ‘Financial Reforms – a Framework for Financial Stability’ argues in favour of more formal regulatory oversight and greater transparency in respect of private pools of capital. Sponsorship and management of private pools of capital by banks should ordinarily be prohibited and large proprietary trading should be limited by strict capital and liquidity requirements. Greater cognizance of the inherent risks in such activities, including reputational risks, is required along with norms to ensure that such exposures are commensurate with risk management capabilities and available capital. The Reserve Bank is working towards developing a prudential framework for banks’ management of private pools of capital. A paper on proposed prudential measures in this respect has been issued for eliciting public comments before finalisation of the regulatory guidelines. Regulation of Investment Banks 6.27 The global crisis is attributed to some extent to the lack of prudential regulation for the investment banks in USA. The Securities and Exchange Commission’s (SEC) laissez-faire regulation of investment banks is widely believed to have contributed to the depth of the crisis. ‘Investment banks’ is not a term formally used in India. However, it is synonymous with entities predominantly carrying out fee based services like trading in securities, or as portfolio managers, merchant bankers, underwriters, brokers and those offering advisory services. Box 6.3: Financial Conglomerates in India The quickening pace of technological innovations coupled with blurring of sectoral distinctions has enabled financial intermediaries to effectively compete in sectors beyond their domain by deconstructing and recombining risks. Financial liberalisation has led to the emergence of financial conglomerates, cutting across not only various financial sectors such as banking, insurance and securities but across geographical boundaries as well. These developments have also ushered in the attendant risks like that of contagion whereby the problems of different sectors and different geographies could have an adverse impact upon the balance sheets of parent regulated entity viz. the bank, insurance company or the securities company. Supervisors have realised the inadequacy of the sectoral regulations to deal with the complexities interwoven into operations of financial conglomerates. In order to address the limitations of the segmental approach to supervision, the Reserve Bank, in consultation with SEBI and IRDA, decided upon putting in place a special monitoring system for Systemically Important Financial Intermediaries (SIFIs) or Financial Conglomerates. Accordingly, a Financial Conglomerates (FC) Monitoring Mechanism has been in place in India since June 2004. For the purpose of monitoring of FCs, the three regulators are designated as the Principal Regulators to whom the identified FCs submit the FC Returns through their designated entities. The mechanism involves a quarterly reporting of relevant data by the identified FCs to their respective principal regulators with a focus on the extent of intra-group transactions and exposures of the identified groups. Primarily, the review of the intra-group transactions is conducted with a view to track build-up of large exposures to entities within the Group, to outside counterparties and to various financial market segments (equity, debt, money market, and derivatives markets), identify cases of migration/ transfer of ‘losses’ and detecting situations of regulatory/ supervisory arbitrage. The monitoring mechanism, thus, seeks to capture the ‘contagion risk’ within the group as also its cumulative exposure to specific outside entities, sectors and market segments. The identification of financial groups for specialised monitoring under the FC framework is incumbent upon the scale of their operations in respective financial market segments (banking, insurance, securities, and non-banking finance). The size of the off-balance sheet position of the entities is also being additionally included as a parameter for determining the size of operations of the entities in respective market segments. While a group having a significant presence in two or more of these financial market segments qualifies to be an ‘identified FC’, few other financial groups which are otherwise important from a ‘systemic’ standpoint (mainly on account of their size, involvement in specialised transactions like derivatives and securitisation and on account of market feedback), also get identified as FCs and are subjected to focused monitoring. Since the monitoring framework also covers the housing finance segment which falls under the jurisdiction of the National Housing Bank (NHB), it has been named as a specified regulator with the provision to co-opt PFRDA as another specified regulator at a subsequent date. The HLCCFM Technical Committee on RBI Regulated Entities has been designated as the inter-regulatory forum for having an overarching view of the FC monitoring mechanism and for providing guidance/directions on concerns arising out of analysis of FC data and for sharing of other significant information in the possession of the Principal Regulators, which might have a bearing on the Group as a whole. Thus, the FC monitoring framework endeavors to identify contagion like situations at the incipient stage, which could snowball into a systemic concern unless addressed promptly. The framework also aims at addressing market disruptions issues by undertaking assessments of sources of liquidity for the group which is quite critical from a financial stability angle. 6.28 Investment banks are regulated by SEBI. Their capacity to leverage is limited and hence, they are not a threat to financial stability. However, the risks arise from the linkages of other financial institutions, including their group companies, with these investment banks. 6.29 In order that investment banks are not considered a potential source of financial vulnerability going forward, it would be necessary for the Reserve Bank and SEBI to have access to information on their activities together with a higher level of risk transparency in case of financial products issued or brokered by them. If there are any instances of /scope for regulatory arbitrage, these need to be addressed. Financial Sector Infrastructure 6.30 Financial stability entails, inter alia, maintenance of a level of confidence in the financial system amongst all the participants and stakeholders. Critical to this end is the development of a robust financial sector infrastructure encompassing arrangements for regulation and supervision of all aspects of financial sector participants and markets, development of robust payment and settlement system architecture to ensure uninterrupted completion of financial transactions and a well-defined legal infrastructure to deal with bank insolvency in an orderly manner. Regulation of financial markets 6.31 Internationally, there has been no explicit or coherent policy framework for markets from a stability perspective. Indeed, the joint IMF-BIS-FSB paper on assessing the systemic importance of financial institutions, markets and instruments also acknowledges that the assessment of systemic importance of markets presents more conceptual challenges than for institutions. 6.32 The regulation of financial markets in most of the developed financial centres has been interpreted as regulation of the conduct of business on exchangetraded markets, leaving the OTC market almost totally out of the purview of regulation. Market regulation has, therefore, largely been concentrated around the operational aspects of trading i.e. the conduct of business, with the prudential focus being left to entity regulation. 6.33 However, post-crisis, it is widely accepted that even the most developed financial markets need to be regulated, not merely from a conduct of business perspective, but also from a financial stability perspective. in the context of emerging countries like India. In the context of emerging countries like India, this becomes particularly relevant for markets involving key macroeconomic variables such as exchange rates and interest rates. Regulatory Architecture for a Systemic Regulator 6.34 Financial stability as an explicit mandate is of recent origin. Pre-crisis, institutional arrangements in most of the countries were designed to serve the objective of policy co-ordination and derived from the evolving structure of regulatory framework. Post crisis however, the above arrangements are being revisited. In many of these countries, the responsibility for financial stability fell through the cracks during the crisis as either no agency or regulator was definitively mandated with it, or the requisite institutional processes and instruments were not in place. There are now moves to explicitly indicate which agency/agencies will be responsible for financial stability and to specify a protocol for addressing threats to financial stability. Various frameworks in this regard are being discussed and debated. 6.35 In the Indian context, the regulatory and supervisory infrastructure for addressing systemic risks presently consists of a co-ordination mechanism in the form of a High Level Co-ordination Committee on Financial Markets (HLCCFM). The Committee is chaired by the Governor, Reserve Bank, and has representation from the Ministry of Finance, SEBI, IRDA and the PFRDA. 6.36 Against this backdrop, a recent important development has been the announcement by the Government regarding the setting up of a Financial Stability and Development Council (FSDC) to monitor macroprudential supervision of the economy, including the functioning of large financial conglomerates, and to address inter-regulatory coordination issues. A key issue to be addressed would be the nature of the relationship of the FSDC with the existing HLCCFM. Payment and Settlement Systems 6.37 The smooth functioning of the payment and settlement systems is important for the stability of the financial system. In the wake of the crisis, several initiatives have been taken internationally to strengthen the financial system infrastructure to reduce the risk of contagion. The initiatives include a comprehensive review of the existing standards and guidelines for systemically important financial market infrastructure, strengthening of central counterparty (CCP) arrangements, improving customer asset protection and improving market practices in the tripartite repo market. 6.38 In India, with the introduction of the Payment and Settlement Systems Act in 2008, the Reserve Bank has the legislative authority to regulate and supervise payment and settlement systems in the country. Given the criticality of payment and settlement systems to the financial stability, the Reserve Bank has been initiating several measures to strengthen the payment and settlement infrastructure. These have been outlined in Chapter II of this Report. 6.39 The broad approach of the Reserve Bank towards strengthening the payment and settlement system infrastructure in the country has been to migrate an increasing number of payment transactions, especially large value/wholesale payment transactions to the electronic mode. Simultaneously, attempts have been made to migrate all inter-bank payment transactions under guaranteed settlements to a CCP. In recent times, several initiatives have been undertaken to mitigate the risks arising out of OTC transactions, for example, through collateralisation. A case in point is the unique CBLO mechanism in money markets. Operational risks in payment and settlement systems are sought to be addressed through robust disaster recovery arrangements. 6.40 In the area of payment and settlement infrastructure also, the Reserve Bank strives to adopt international best practices. As part of its efforts to continuously benchmark itself against such best practices, India, through the CFSA had, inter alia, conducted a self assessment of its compliance with Core Principles for Systemically Important Payment Systems and the recommendations for Securities Settlement Systems and CCPs. The Committee concluded that the country was broadly compliant with the principles/ recommendations. Large value payments - Mitigating risks inherent in paper mode 6.41 A Real Time Gross Settlement System for large value payment transactions was implemented in the country in 2004 to address systemic risks. Since then, continuing efforts have been made to phase out settlement of large value payments from paper based systems (MICR and high value paper clearing systems). Volumes of high value cheques cleared through paper clearing systems remain large which is to be expected given the size, complexity and diversity of the country. However, significant progress has been made in respect of value of high value payments settled through electronic systems with RTGS accounting for the settlement of nearly 90 per cent of large value payments in the country (Charts 6.1 and 6.2). Retail transactions are also sought to be brought within the ambit of electronic payments through a National Electronic Funds Transfer system (NEFT).
Risk mitigation through Central Counterparties 6.42 An important initiative to strengthen the core financial infrastructure and markets in recent years has been to bring an increasing share of settlements, especially of large value transactions, within the ambit of a CCP. CCPs, thus, serve an important role in reducing counterparty risks and also help in reducing the liquidity requirement by multi-lateral netting. Global regulatory efforts to reduce systemic risks include, inter alia, incentivising the move to guaranteed settlements through CCPs and, where appropriate, organised exchanges. CCP arrangements are sought to be put in place even in OTC markets. 6.43 In India, central counterparties are functioning in most financial markets. For the capital market, the major stock exchanges viz., NSE and BSE have their own CCPs (National Securities Clearing Corporation and Bank of India Shareholding Limited respectively). CCIL provides an institutional structure for the clearing and settlement of transactions undertaken in government securities, money market instruments (including the collateralised segments) and foreign exchange products (Chart 6.3). CCIL’s role is being gradually extended to the OTC interest rate and forex derivatives segments, initially as a reporting platform and, thereafter, to cover settlements. 6.44 In serving financial markets, CCPs are exposed to counterparty credit risk (pre-settlement or replacement cost risk), liquidity risk, settlement bank risk, custody risk, investment risk, operational risk and legal risk. The capacity to establish robust default management procedures by CCPs with the involvement of market participants is a precondition of their functioning. To protect against the default or insolvency of a participant, the risk management procedures of CCPs work on the principles of (i) reducing the probability of default by prescribing strict entry criteria (ii) safeguarding against defaults by prescribing margin requirements that collateralise future credit exposures and (iii) putting in place safeguards designed to cover losses that may exceed the value of the defaulting member’s margin collateral through supplementary resources such as capital, asset pools and guarantee funds or loss allocation procedures. 6.45 The cost of ensuring CCPs’ robustness needs to be borne by the market without impeding its efficient functioning. In this context, reliable MTM valuations which underpin the margin calls along with a liquid market for ‘close out’ is of paramount importance. At the same time, it is imperative that the payment system regulator ensures that the CCPs’ risk management systems are robust and have adequate capital backing. 6.46 The clearing and settlement facilities offered by CCIL incorporate these risk management processes. The CFSA had found that CCIL broadly complies with the CPSS-IOSCO Recommendations for Central Counterparties. Vulnerabilities, however, could arise from inadequacies in addressing any of these processes, in particular from (i) quantum of collateral; (ii) quality of collateral; and (iii) access to own funds.
6.47 An inadequate quantity of collateral could affect the ability of CCIL to address the risks due to defaults. The quality of collateral assumes importance as the response of the CCP to any default would depend on the marketability of the collateral. The broad process adopted by CCIL for computation of quantity and quality of collateral has been vetted and approved by the Reserve Bank. The implementation of these processes is assessed by the Reserve Bank through its offsite monitoring and onsite inspections. 6.48 Further, the investment of own funds by the CCPs could also be in instruments which are less volatile and easily marketable. While these investment decisions are taken by the Board of CCIL, any vulnerability in the process is flagged by the Reserve Bank during its monitoring processes. 6.49 The growing concentration of business at CCIL helps it to pool the risks and reduce overall transaction costs for the system. Given that CCIL is the single CCP in various financial markets, the existing lines of credit available to it need to be enhanced to make the security settlement system less risk prone. Therefore, the capital and liquidity needs of the CCIL need to be addressed so that the probability of failure of this entity, which would have significant systemic implications, can be reduced. Systemic risks in OTC markets 6.50 In the wake of the recent financial crisis, regulatory attention shifted to the large swathe of OTC cash and derivative products, which was perceived to be one of the major factors in perpetrating the financial crisis. The lack of transparency in such markets along with the relative complexity of the financial instruments that were traded (particularly in credit derivatives) resulted in an obfuscation of risk residence which in turn led to increased vulnerability of the financial system. To promote standardisation, transparency and simplicity in financial instruments, financial regulators across the globe turned their focus on enlarging the coverage of exchange traded financial instruments. Simultaneously, CCP arrangements for the settlement of OTC transactions were encouraged. 6.51 In India, the currency market trades mostly over the counter. Most transactions in the government securities market, however, are conducted through the Negotiated Dealing System (NDS) which is an anonymous order-matching system (Chart 6.4). The secondary market transactions are settled through DVP – III where both funds and securities are settled on a net basis. CCIL acts as the clearing house and CCP for both quote-based and order-matching systems. Trading in government securities through stock exchanges is not significant. Credit derivatives do not exist in the Indian financial markets currently. Foreign currency forwards and interest rate swaps, which are both OTC trades, have been popular in the Indian markets. While a guaranteed settlement mechanism for settlement of foreign currency forwards has been introduced, the latter is yet to be brought under CCP arrangements. 6.52 The Reserve Bank has been encouraging the extension of CCIL’s role to the OTC interest rate and forex derivatives segments, initially for reporting and gradually for novated settlement. Simultaneously, it has been making efforts, through introduction of exchangetraded products in the foreign currency and interest rate markets, to expand their coverage in such markets. A beginning in this direction has been made through the introduction of foreign currency futures and interest rate futures. 6.53 Currency futures trades have been gaining in popularity since their introduction with the share of such trades in total trading turnover increasing from a meagre 0.3 per cent in October 2008 to 6 per cent in September 2009 (Chart 6.5). As discussed in Chapter IV of this Report, volumes in interest rate futures are yet to pick up.
Disaster Recovery (DR) Drills 6.54 Managing business continuity has been perceived as a crucial component of the overall financial stability, more so in the context of increasing dependence on technology. Management of operational risk is, in fact, a key component of all international best practices for payment and settlement systems. In order to test the payment systems’ readiness to handle unforeseen disruptions, the Reserve Bank conducts Disaster Recovery drills2. To date, five drills have been conducted on various dates and the results have been encouraging. However, a number of smaller participants were not able to connect through offsite set ups to Reserve Bank’s offsite location during the drills for the three critical payment systems (Chart 6.6). The inability of one or more participants of a payment system, especially a critical payment system, to participate in the DR drills could be an issue in case of any instance of business interruption. Legal Infrastructure 6.55 The importance of a well-defined legal infrastructure to deal with bank insolvency in an orderly manner is well understood. A cross-country comparison on closing a business in the World Bank’s ‘Doing Business Report’ (2008) had concluded that India is an outlier in terms of the recovery rate and the average time for completing the winding-up process (Chart 6.7). Since the time taken for the winding-up process is a significant factor that influences the recovered proportion of assets under consideration, top priority needs to be given to improving and rationalising the recovery systems and resolution procedures.
6.56 In view of the growing presence of international conglomerates, cross-border crisis management and resolution assume importance. There are presently no provisions in law enabling cross-border insolvency proceedings. The CFSA had recommended that the United Nations Commission on International Trade Law (UNCITRAL) Model Law on Cross-border Insolvency with suitable modifications for India could be adopted. On adoption of UNCITRAL Model Law, the interest of regional depositors of banks may not get any protection over and above global depositors, as there would be pooling of assets of various countries belonging to the companies. Deposit Insurance 6.57 The global financial crisis has underscored the need for a credible and transparent deposit insurance system for maintaining public confidence in the banking system. Safety nets in the banking system aid in dissipating crises and thus contribute to financial stability. 6.58 In India, deposit insurance is provided by the Deposit Insurance and Credit Guarantee Corporation (DICGC), a wholly owned subsidiary of the Reserve Bank of India. Deposit insurance in India is mandatory for all banks (commercial/co-operative/RRBs/LABs)3. It covers all kinds of deposits except those of foreign governments, Central/State Governments, inter-bank, deposits received abroad and those specifically exempted by DICGC with prior approval of the Reserve Bank. 6.59 The steps taken by governments and deposit insurance systems around the world have helped in restoring stability in the system, but have also brought to the forefront some important issues, which are discussed below. Un-winding of enhanced deposit insurance measures 6.60 In the wake of the recent financial crisis, as many as 47 countries have adopted policies to enhance depositor protection. Their policy packages, however, differ in both scope and intensity of protection. While the majority of these countries have opted to rely on the existing framework of deposit insurance but increased coverage levels to strengthen private sector confidence, a few countries have introduced full deposit guarantees. A survey by the International Association of Deposit Insurers (IADI) and the IMF observes that plans for unwinding temporary deposit protection across countries consist almost exclusively of announced termination dates. The unwinding of the enhanced measures would require co-ordination strategies both at the national and international levels. 6.61 A review by DICGC in this regard vis-à-vis the goal of protecting the interest of small depositors indicated that the present cap of rupees one lakh worked out to 2.2 times the per capita GDP as of March 31, 2009. This compared well with international benchmark of 1-2 times per capita GDP. Further, although the percentage of fully covered accounts fell marginally from 92.6 per cent as on March 31, 2008 to 89.3 per cent as on March 31, 2009, it remained well above acceptable levels. Thus the need to enhance deposit insurance cover was not compelling in India even during the crisis period and hence the need for unwinding does not arise. Adequacy of the Deposit Insurance Fund (DIF) 6.62 The adequacy4 of the DIF measured through Fund Ratio / Reserve Ratio (Fund Size to Total Insured Deposits5), is an important issue for ensuring the solvency of the fund and maintaining public confidence. Due to the spurt in payouts to urban cooperative banks since 2001-02, the premium rates were increased in phases from 0.05 per cent to 0.10 per cent6 by 2006 to improve the reserves (Chart 6.8). However, the growth in reserves in absolute terms has not been yielding a commensurate growth in the reserve ratio. The reserve ratio adjusted for the actuarial liability (i.e. presuming historical trend in premium receipt and claim payments or normal ‘stresses’) on account of insurance claims for the years would fall about 10 basis points lower.
6.63 The compounded annual growth rate (CAGR) of assessable deposits and insured deposits in India over last 10 years has been 19.1 per cent and 16.1 per cent respectively, which implies a widening spread (Chart 6.9). 6.64 While in a low premium regime as presently prevalent in India, a lower Insured Deposit Ratio (i.e. Ratio of Insured Deposits to the Assessable Deposits) could signify the efficacy of the fund size as an effective safety net, an excessively growing size of non-insured deposits in the banking system could render deposit insurance to be less effective and adversely impact systemic stability. Cross Subsidisation 6.65 The trends in claim settlement as well as the premium received over the last few years suggest a significant element of cross subsidisation between commercial and co-operative banks (Charts 6.10 and 6.11). 6.66 One option to reduce cross subsidisation is to charge risk sensitive premia. While there are merits of such a risk sensitive assessment, cross-subsidisation also brings into focus the need for charging higher premium to large banks owing to their large financial externalities with possible domino effects, either direct or indirect. The cost of resolution for such banks is larger for both the explicit / implicit insurer in terms of direct losses from liquidating big banks and indirectly from externalities.
Recovery Performance 6.67 As enshrined in the DICGC Act, 1961 as well as incorporated in the Core Principles of Effective Deposit Insurance Systems of the BIS in June 2009 (Principle 19), the deposit insurer should share in the proceeds of recoveries from the assets of the failed bank. Since inception, the recovery share of DICGC vis-à-vis claim settlements has been a major bottleneck for regeneration and resilience of the fund. The position from inception until end-March 2009 is given in Table 6.1. Inter-relationship with other safety net players 6.68 In line with Principle 6 of Core Principles, a formal relationship with robust information exchange between the deposit insurer and other safety net participants, particularly with the bank supervisors, needs to be emphasised. While in practice there are a few informal modes of information exchange between DICGC and other regulators, the unsatisfactory recovery from the assets of resolved banks suggests a lack of effective postresolution supervision, particularly in case of cooperative banks, which needs to be addressed through mechanisms such as Memorandums of Understanding (MoUs) with the concerned State Governments. A new architecture in safety net for banks in India could be explored, including an integrated crisis management model, where DICGC plays a more active role. 6.69 Deposit insurance in India is currently a pay box system. Pay box systems are largely confined to paying the claims of depositors after a bank has closed down. Accordingly, they normally do not have prudential regulatory or supervisory responsibilities or intervention powers. 6.70 A deposit insurer responsible for loss or risk management is likely to have a relatively extended mandate and accordingly more powers. These powers may include the ability to control entry and exit from the deposit insurance system; the ability to assess and manage its own risks; and the ability to conduct examinations of banks or request such examinations. Such systems may provide financial assistance to troubled banks. Unlike in Japan or Korea, DICGC does not have an extended mandate. It does not act as a risk minimiser as is the case with Federal Deposit Insurance Corporation (FDIC), USA. A review of the public policy objectives of deposit insurance in India may thus be expedient in the context of the international experience and their efficacy to examine if the pay box mandate needs to be upgraded. Concluding Remarks 6.71 India’s initiatives in strengthening financial sector policies and regulation and supervision for banks have lent resilience to the economy in general, and to the financial sector in particular, during the recent global crisis. Going forward, the challenge will be to ensure that international recommendations are adopted while ensuring harmony with local considerations. The migration to higher approaches under Basel II also presents significant challenges.
6.72 The mandatory convergence of Indian Accounting Standards with IFRS from April 2011 will be a major challenge for the Indian banking system in view of the complexities involved in the process and the fact that there would be changes to the standard in the proposed path to its adoption. 6.73 While technically India may be ‘materially noncompliant’ with the Basel Core Principle on home–host relationship, in effect the informal arrangements are serving reasonably well. The Reserve Bank is working towards developing a prudential framework for banks to follow in their management of pools of capital. In order that investment banks are not considered a potential source of financial vulnerability going forward, a higher level of risk transparency of financial products issued by or brokered by them as well as some form of formal prudential regulation and supervision to assure appropriate standards for capital, liquidity, and risk management are necessary. 6.74 In India, various segments of the financial sector are regulated by different regulators. While the existing regulatory infrastructure has been able to withstand the global financial crisis, in the light of lessons learnt, various initiatives have been taken or are underway to review the policies relating to financial regulation and supervision and to inter-regulatory co-ordination. 6.75 The regulation of financial markets in most of the developed financial centres has been interpreted as regulation of the conduct of business on exchangetraded markets. Market regulation has, therefore, largely been concentrated around the operational aspects of trading. Post-crisis, it is widely accepted that even the most developed financial markets need to be regulated not merely from a conduct of business perspective, but also from a financial stability perspective. This becomes particularly relevant for markets involving key macroeconomic variables such as exchange rates and interest rates in the context of emerging countries like India. 6.76 Post-crisis, the arrangements for regulation and supervision of markets and of institutions are being revisited. There are now moves to explicitly indicate which agency/agencies will be responsible for financial stability and to specify a protocol for addressing threats to financial stability. Various frameworks are being discussed and debated. In the Indian context, the regulatory and supervisory infrastructure for addressing systemic risks presently consists of a coordination mechanism in the form of a HLCCFM. The Government has recently announced the setting up of a FSDC to monitor macroprudential supervision of the economy, including the functioning of large financial conglomerates, and to address inter-regulatory coordination issues. A key issue to be addressed in this connection is the nature of relationship of the FSDC with the existing HLCCFM. 6.77 There have been significant improvements in the payment system infrastructure. However, some issues warrant careful attention. 6.78 The clearing and settlement facilities offered by CCIL incorporate risk management processes which are vetted by the Reserve Bank. Given that CCIL is the single CCP in major financial markets, the capital and liquidity needs of the CCIL need to be addressed so that the probability of its failure, which would have significant systemic implications, can be reduced. 6.79 Exchange-traded instruments have been introduced in interest and foreign exchange markets. Simultaneously, the Reserve Bank has taken several initiatives like introduction of a CCP (CCIL) for clearing and settlement of transactions and reduction of information asymmetry through mandatory reporting of OTC trades to reduce the associated risks. 6.80 The insolvency procedure in the financial system remains a major concern. India is a rank outsider in respect of both recovery rate and time taken for resolution. There is an urgent requirement for legislative amendments to address this concern. 6.81 The deposit insurance coverage in India is comparable with the international standards. The ratio of insured to assessable deposits, however, has been declining over time implying an increase in the noninsured deposit. An excessively growing size of noninsured deposits in the banking system could render deposit insurance to be less effective and adversely impact the systemic stability. The efficacy of deposit insurance could be enhanced by upgrading the existing pay box mandate given to DICGC to an extended mandate with powers for least cost resolution. _____________________ 1 Other approaches used to assess the performance of external credit ratings include i) default studies - these help to assess the credit history of the instrument/issuer rated by a CRA and are used to assign an appropriate probability of default (PD) to various rating grades and ii) recovery rates - these help to analyse the recoveries that investors have realised after default has taken place and are used to identify the loss given default (LGD) that can be associated with different borrowers and facilities. 2 During the drill, participants were required to connect through their offsite centre to the Reserve Bank’s offsite or primary centre during the drills. The participants had been given more than adequate notice period for the start of the drill. 3 Deposit insurance is not applicable to co-operative banks where the Cooperative Societies Act under which they are registered does not comply with the provisions of Section 2 (gg) of the DICGC Act, 1961. Extension of the scheme to co-operative banks three Union Territories (Chandigarh, Lakshadweep and Dadra and Nagar Haveli) is pending as the concerned State Governments are yet to introduce necessary legislative changes in their respective Cooperative Societies Acts. There are no co-operative banks at present in Lakshadweep and Dadra and Nagar Haveli. 4 Source: An Evaluation of the Denominator of the Reserve Ratio FDIC Staff Study, February 12, 2007. 5 “Insured deposit” means the deposit or any portion thereof, the repayment of which is insured by DICGC under the provisions of the DICGC Act 1961. 6 There is a statutory ceiling on the premium at 0.15 per cent of assessable deposits. Chapter VII System level stress testing has increasingly emerged as an accepted mode for assessing the vulnerability of the financial system to exceptional but plausible stress events. In this Chapter, the vulnerabilities and resilience of commercial banks have been tested under various scenarios impacting their credit, interest rate and liquidity risks by calibrating the stress factors. A dynamic simulation analysis of the banking system based on an assumed macro-financial setting has also been performed. 7.1 Supervisory stress tests are conducted with the main objective of assessing the resilience of banks to potential risks and vulnerabilities, both at the level of individual banks and the banking system as a whole. Such stress testing facilitates strengthening of the information set and consequent refinement of the prudential supervisory process so that more in-depth analyses can be conducted on individual banks identified as outliers. This could assist in introduction of appropriate early preventive measures. The stress tests could also facilitate macroprudential surveillance by identifying potential vulnerabilities and overall risk exposures in the banking system that might lead to systemic problems. 7.2 Ideally, stress scenarios are required to be linked to a macroeconomic framework. The quantitative response models generally employ econometric techniques to estimate the relationship between the macroeconomic variables to study the impact of stress conditions. In India, conducting stress testing is a difficult exercise due to the lack of adequate and relevant past time-series data. For example, the data on asset prices are inadequate – no reliable system level data is available for commercial real estate prices – which would be the primary input to assess the impact of asset price inflation in the economy. 7.3 In the absence of adequate data to link macroeconomic scenarios with financial soundness indicators and also the lack of any major ‘stress events’ in the Indian financial system in the last 15 years, the stress testing undertaken by the Reserve Bank normally uses single factor sensitivity analysis to assess the resilience of the financial system to exceptional but plausible stress events. In formulating the quantum of shocks, judicious criteria on selected indicators based on the experience of the Indian financial system are applied. Based on the supervisory data, individual banks’ positions are examined by applying shocks in respect of a single key variable, which is then related to an important financial soundness indicator – typically the regulatory capital adequacy ratio. The same analysis is also carried out for the system as a whole by aggregating the impact across individual banks. 7.4 The Reserve Bank, as a part of its quarterly review of Macro Prudential Indicators (MPIs), conducts stress tests covering credit risk and interest rate risk for commercial banks. The Committee on Financial Sector Assessment (CFSA) also conducted stress tests as a part of its assessment. The stress tests currently being conducted by the Reserve Bank cover the following risks: • Credit risk, which estimates the impact on capital adequacy by stressing the Non-Performing Advances (NPAs) for the entire credit portfolio. Further, in response to the effects of the global crisis on certain segments of the domestic economy, the Reserve Bank conducted stress tests for certain identified segments (e.g. real estate, retail advances, specific industrial sectors, etc.). 7.5 In this Report, the resilience of the commercial banks in response to the above shocks has been studied from the above three perspectives. The methodology adopted for the stress tests in this Report is in line with the stress tests conducted for the CFSA. The methodology used in these stress tests are single factor sensitivity analysis and do not take into account the inter-linkages of macroeconomic variables with the financial soundness indicators. Development of macro stress test models is still in an evolving stage. 7.6 The Report aims firstly, to assess whether the resilience of the commercial banks to credit and interest rate shocks has increased over time; a trend analysis using single factor stress tests for credit and interest rate risks separately was undertaken. This exercise used the results obtained from the various MPI Reviews. The analysis covered all commercial banks. 7.7 Secondly, in order to ascertain how long a bank could be in a position to withstand a liquidity drain without resorting to any external liquidity support, an analysis was carried out in respect of the commercial banks, based on their March and December 2009 positions. 7.8 Thirdly, a scenario analysis for the commercial banking system was undertaken by taking into account the current macroeconomic and market conditions. This exercise included both baseline and stressed scenarios. Credit Risk 7.9 To ascertain the resilience of banks, the credit portfolio was shocked by increasing NPA levels, both for the entire portfolio as well as for specific sectors, along with a simultaneous increase in provisioning requirements. The estimated provisioning requirements so derived were first adjusted from the annualised profit of the banks and the residual provisioning requirements, if any, were deduced from banks’ capital. Portfolio Analysis 7.10 The analysis was carried out both at the aggregate level as well as at the individual bank level, based on quarterly supervisory data from March 2001 through December 2009. The length of the data series was selected to reflect the evolving asset quality of banks across dynamic economic cycle and in the light of phased implementation of prudential norms. The scenario assumed increase in the existing stock of NPAs by 100, 200 and 300 per cent and enhanced provisioning requirements of 1 per cent, 25 per cent and 100 per cent for standard, sub-standard and doubtful/loss advances, respectively. The assumed increase in NPAs was distributed across sub-standard, doubtful and loss categories in the same proportion as prevailing in the existing stock of NPAs. The additional provisioning requirement was applied to the altered composition of the credit portfolio. 7.11 The trend analysis of the stress test reveals that till March 2003, for an assumed rise in existing stocks of NPAs by 100 per cent (Chart 7.1), the CRAR of more than 50 banks accounting for more than 70 per cent of the assets of commercial banks would have fallen below the regulatory prescription of 9 per cent. In the subsequent years, and especially since 2006, more resilience is discernible among the banks, in terms of capacity to withstand unexpected stress on credit quality. This can be attributed to improvement in credit quality as well as augmentation of capital. In recent periods, especially after March 2007, the number of stressed banks (with CRAR falling below 9 per cent) works out to only around seven, accounting for about 6 per cent of total assets of all banks. As at end-March 2009, the CRAR of only three banks, accounting for 2.4 per cent of total assets, would have dropped below 9 per cent for the assumed rise in NPAs. A similar trend was seen when the existing stock of NPAs was enhanced by 200 and 300 per cent respectively. Under these scenarios, the number of banks falling under the 9 per cent CRAR level worked out to seven and 10, accounting for 8.0 and 11.9 per cent of total assets as at end-March 2009 respectively (Charts 7.2 and 7.3).
7.12 The stress test results, however, showed a marginal deterioration as at end-June 2009 over end- March 2009, with the CRAR of 5, 7 and 11 banks, accounting for 4.0, 8.3 and 13.7 per cent of total assets respectively, falling below 9 per cent for the assumed 100, 200 and 300 per cent rise in NPAs (Charts 7.1, 7.2 and 7.3). At end-September 2009, the stress test results impaired further, with the CRAR of 4, 9 and 13 banks, accounting for 3.8, 8.9 and 14.6 per cent of total assets respectively, falling below 9 per cent for the assumed levels of rise in NPAs. The stress test results at end- December 2009 remained almost the same as at end- September 2009. 7.13 Until September 2001, the CRAR at the system level was negative for an assumed rise in NPAs by 100 per cent (Chart 7.4). Although the stressed system level CRAR turned positive after September 2001, it remained below 9 per cent up to June 2003, reflecting the weak resilience of the banks until that time. Since September 2003, the system level stressed CRAR has remained above 9 per cent, reflecting the stronger resilience of banks. Even for an assumed increase by 200 and 300 per cent in NPAs, the system level stressed CRARs have remained above 9 per cent since March 2006 and March 2007, respectively. 7.14 The stress test findings indicate that the likely impact of an unexpected rise in credit defaults on banks’ capital position is not very significant. A secular improvement in the asset quality of the banks in recent years largely explains such results (Chart 7.5). A level of comfort from the results of the above stress tests could be derived. Notwithstanding, there is a need to monitor the situation closely to identify any incipient signs of stress building up in the system. 7.15 In the unexpected downturn in 2008-09, the prudential regulations for restructured accounts were modified as a one-time measure for a limited period of time as mentioned in Chapter 2 of this Report. Several accounts were restructured under this dispensation and the restructured accounts in standard category constituted 3.1 per cent of the gross advances as at end- December 2009. Even if, in a worst case scenario, it is assumed that all these restructured standard advances were to become NPA, the stress would not be significant. This is because, as discussed in paragraph 7.12 of this Chapter, the stress tests show that even if the NPAs increased by 300 per cent, the system would still be resilient with system CRAR remaining above 9 per cent and the CRAR of 13 banks accounting for only 14.6 per cent of total banking system assets going below 9 per cent.
Sectoral Analysis 7.16 The stress tests were also conducted at the sectoral level. Banks’ exposure to three important sectors, viz. retail, priority and industrial sectors were considered for the analysis. 7.17 The existing stocks of NPAs in the retail segment were assumed to increase by 100, 200, 300, 400 and 500 per cent, respectively. As in the case of the aggregate advance portfolio, the increases in NPAs were distributed among sub-standard, doubtful and loss categories in the same proportion as prevailing at present. The same additional provisioning requirements were also applied to the portfolio of standard and NPAs. The stressed CRARs were estimated after adjusting the additional provisioning requirements from the annualised profit and the residual provisioning requirements from the banks’ capital. 7.18 The stress analysis showed considerable resilience of banks to withstand these shocks. The system-level CRAR after adjusting the stress impact remained well above 11 per cent in all the quarters. The impact on CRAR was observed only at 500 per cent increase in NPA level (Chart 7.6). 7.19 The stress test results in the recent quarters pertaining to Priority and Industrial sectors also show comfortable positions from the standpoint of financial stability (Charts 7.7 and 7.8). Interest Rate Risk 7.20 The duration of equity (DoE) or the net-worth duration approach in stress tests could help in calculating the erosion in capital due to unit increase in interest rates. The analysis takes into account the interest rate sensitive items in balance sheet of the banks’ portfolio and also the banks’ exposure to interest rate sensitive off balance sheet items. Subject to certain limitations, DoE captures the interest rate risk and helps in moving towards the assessment of risk based capital. The higher the duration of equity, more is the interest rate risk and accordingly greater the requirement of capital. Under this approach, the duration of equity of a bank’s portfolio is computed under two scenarios: the savings deposits are assumed to be withdrawn in the first time band viz. 1 to 28 days (scenario I); the savings deposits are assumed to be withdrawn in 3 to 6 months time band (scenario II). The time band-wise rate sensitive liabilities have been accordingly adjusted under the two scenarios.
7.21 Under scenario I, at the system level, the DoE works out to 8.0 years, 8.7 years, 8.9 years and 9.9 years as on March 2009, June 2009, September 2009 and December 2009, respectively. Under scenario II, at the system level, the DoE comes out to 7.1 years, 7.9 years, 8.0 years and 9.1 years as on March 2009, June 2009, September 2009 and December 2009, respectively. The distribution of DoE under the two scenarios shows that 51 banks (under scenario I) and 52 banks (under scenario II) have DoE of less than or equal to 10 years as at end March 2009, whereas the number of banks having DoE upto 10 years under the two scenarios are marginally less at 47 and 49 in June 2009; and at 48 and 49 in September 2009; and at 47 and 49 in December 2009 (Charts 7.9 and 7.10). Though there has been some increase in banks’ duration of equity in recent months, the same is relatively low. The low DoE is a pointer to active interest rate risk management by banks and this suggests that the banks’ vulnerability to interest rate increase will not be very significant under normal conditions. Though banks’ exposures to long term assets (e.g. infrastructure loans) are on the increase, most of the loans are priced on floating terms implying that the assets are re-priced more frequently, which reduces their modified duration. 7.22 Currently, banks’ investment portfolios are divided into three categories, viz., held to maturity (HTM), held for trading (HFT) and available for sale (AFS). The Reserve Bank’s decision in September 2004 permitting banks to shift securities from HFT and AFS categories to HTM to the extent of their mandated SLR has resulted in an increase in the HTM portfolio of banks. As per extant accounting norms, banks are required to mark-to-market only their AFS and HFT portfolios. The investments of banks held in the HFT and AFS have progressively declined in recent periods from 39.5 per cent in March 2008 to 33.7 per cent of their total rate sensitive investments as at end- December 2009. As a result, a significant portion of banks’ investment portfolios is not marked-to-market.
7.23 Moreover, the modified duration of the AFS and HFT portfolios is much lower than that of the securities under HTM. The size and higher modified duration of the HTM portfolio thus exposes banks to potential interest rate risk. In this context, the low DoE of the commercial banking system which takes into account the rate sensitive assets, liabilities and off-balance sheet items, provides a degree of comfort. 7.25 Scenario I depicts different proportions (depending on the type of deposits) of unexpected deposit withdrawals on account of sudden loss of depositors’ confidence and assesses the adequacy of liquid assets available to fund them. The deposit run is assumed to continue for five days. 7.26 Scenario II attempts to capture separately the unexpected withdrawal of insured and uninsured deposits. Experience has shown that uninsured depositors are the first to adopt ‘flight to safety’ as soon as they sense the bank to be in trouble. On the other hand, for insured deposits, depositors adopt a wait and watch policy, partly on account of deposit insurance comfort and lack of information about market developments. Methodologies 7.27 The methodologies used for the liquidity stress scenarios are as under: Scenario I • The objective is to capture the ability of the bank to meet unexpected withdrawal of deposits for five days through sale of its available liquid assets without any outside support.
• The stressed withdrawal is assumed to take place in a span of five days as 40, 30, 15, 10 and 5 per cent from first day to fifth day respectively. • The bank is assumed to meet stressed withdrawal of deposits through sale of liquid assets. • The objective is to capture differential withdrawal of uninsured and insured deposits and the adequacy of liquid assets to sustain repayment of withdrawals without any outside support for five days. • 1 per cent of total insured deposits are assumed to be withdrawn on each of the five days. Results: Scenario I 7.28 For March 2009, all banks, except three banks whose deposits and assets share are about 4.0 per cent, were able to meet their stressed withdrawal of deposits on the first day. On the second day, 16 banks having deposits and asset share of 40.0 per cent, faced deficit to meet the withdrawal of deposits and liquidity conditions deteriorated progressively (Chart 7.11). 7.29 The stressed results as of December 2009 showed marginally improved liquidity position with all banks, other than a small bank having deposits and assets share of about 0.1 per cent, meeting the stressed withdrawal of deposits on the first day through their liquid assets (Charts 7.12). However, the liquidity conditions deteriorated progressively from the second day onwards. Results: Scenario II 7.30 In this stress scenario, only two small banks were unable to meet their stressed repayment obligations on the first day as at the end of March 2009 (Chart 7.13). On the second day, nine banks, with deposits and assets share of 8.5 and 7.6 per cent respectively, were unable to meet the stressed withdrawal. The number of banks facing deficit increased from the third day. 7.31 The stressed results as of December 2009 showed improved liquidity position, with only few very small banks being unable to meet the stressed withdrawal of deposits on the first and second day.through their liquid assets. However, the number of deficit banks increased progressively from the third day (Charts 7.14).
7.32 The liquidity stress test results show that some banks face liquidity constraints under the stress scenarios. Though the scenarios developed have very stringent assumptions, nevertheless, the results of the stress test suggest that banks need to continuously monitor their contingency liquidity plans while also strengthening systems for management of liquidity risk. The stress tests assume that assets available to meet the funding gaps are those maturing within one year. However, as banks maintain a minimum of 25 per cent of their net demand and time liabilities (NDTL) in SLR securities, it would be possible to raise additional liquidity when required. Scenario Analysis 7.33 The economic environment in which banks are operating is challenging, with deep uncertainty created and fueled by the global financial crisis and the subsequent global recession. The growth in real activity in India has decelerated while inflation has started to increase. The government borrowing requirements remain high. This macroeconomic environment could be expected to put some strain on the financials of the banking system. 7.34 On one hand, the downturn in the real sector could adversely impact the loan portfolio of the banks, both in terms of growth and asset quality. On the other, banks’ cost of funding is likely to increase, given the high inflation and the expected future path of the interest rate cycle. This could put pressure on banks’ net interest margin (NIM). The provisioning requirements may increase on account of more stringent regulatory norms coupled with the likely increase in NPAs and higher rises in mark-to-market losses due to likely increase in sovereign yields because of increased government borrowings. This could put pressure on banks’ bottom-line and overall financial indicators. The lower profits, in turn, will impact reserve accretion and therefore the CRAR, going forward. Based on the above base line settings, the balance sheet and profit and loss account of the banks are projected for March 2010. Plausible shocks are administered on the projected financials of the banks to gauge the impact and resilience of the system.
Methodology 7.35 The analysis is carried out both at the aggregate level as well as at the individual bank level based on supervisory data for March 2009. Two baseline scenarios are assumed. In both cases, the growth projection for balance sheet as well as profit and loss components are computed by applying compound growth rates as well as by using March 2009 proportions and applying adverse impact factors on them. The regulatory capital growth is assumed to remain at the minimum by assuming minimum mandated transfer of twenty five per cent of the profit to the reserves account. The total NPA as at end-March 2010 increases by 65 per cent under both the baseline scenarios. Rate of investment depreciation provision is also increased, given the existing upward pressure on yield due to increased government borrowing. The first baseline assumes that the existing loan loss provisioning coverage ratios remain intact. 7.36 The Second Quarter Review of Monetary Policy 2009-10 proposes augmenting provision coverage ratios for the banks to 70 per cent of NPAs by September 2010. Taking into account this development, the second baseline scenario, the adverse baseline, is constructed. This scenario assumes that each bank has a minimum of 70 per cent loan loss provisioning coverage ratio as at end-March 2010. 7.37 The results thus obtained in the two baseline scenarios are subjected to increase in NPAs by 50 per cent, 100 per cent and 150 per cent at the aggregate loan portfolio level for each bank. The systemic impact of such shocks is also worked out. The results of the stress tests are given in Tables 7.1 and 7.2. 7.38 Under the first baseline scenario (Table 7.1), there is a relatively muted impact and the banking system is able to withstand an adverse NPA shock reasonably easily. The system CRAR remains at 13.07 and all banks maintain the CRAR above 9 per cent at end-March 2010. The percentage of gross NPAs to total advances increases to 3.44 as at end-March 2010 from 2.44 as at end-March 2009, while RoA of 7 small banks, having a share of 0.92 per cent in total assets, becomes negative. Under the most stringent credit quality shock of 150 per cent on the baseline, when the NPA level increases by 313 per cent, the system CRAR remains comfortable at 10.89 per cent. This is because the estimated profits recorded by the banks in 2009-10 significantly absorb the loss arising due to the NPA shock. However, the system level profitability is adversely affected under very extreme deterioration of asset quality, where RoA of 32 banks, with share of 49.26 per cent in total assets, becomes negative. For a stressed gross NPA level at 8.49 per cent to the total advances, at 147 per cent NPA shock on the baseline, the systemic RoA becomes zero, though CRAR at system level continues to remain well above the threshold nine per cent at 10.97 per cent. 7.39 Under the adverse baseline scenario (Table 7.2), CRAR of two small banks, with 0.30 per cent share in total assets, falls below stipulated 9 per cent and RoA of 14 banks becomes negative. The impact gets compounded when the NPA shocks are imparted to the adverse baseline scenario. The system level RoA turns negative if the quantum of gross NPA increases by around 161 per cent, at 58 per cent NPA shock on the adverse baseline, effecting 28 banks having a share of 46.87 per cent in total assets. The system level CRAR also touches 9 per cent if the NPA levels are stressed to 129 per cent on the adverse baseline, where CRAR of 25 banks, having 44.60 per cent share in total assets, falls below stipulated 9 per cent. 7.40 It could, therefore, be concluded that the banking system is comfortably resilient at the current levels of provisions. It is also able to significantly withstand the impact of increased provisioning coverage norms of 70 per cent under a relatively adverse scenario. However, the systemic resilience could be tested if there is an extraordinary deterioration in credit quality under this adverse baseline scenario. Concluding Remarks 7.41 The various scenarios used to stress test the credit risk exposure of banks reveal a reasonably comfortable position and resilience of banks to withstand unexpected deterioration in credit quality. The steady and secular improvement in asset quality spread across banks and the balance sheet cleaning done by banks over the last few years, prior to the onset of the recent global crisis, explain the muted impact of the stress scenarios. However, the global economic slowdown has increased the downside risks, having potential to impair the asset quality of banks in the near future. 7.42 The extant accounting norms reduce the propensity of the banks’ to incur a very high mark-tomarket loss in an increasing interest rate scenario as most of their investment portfolio is not marked-tomarket. The modified duration of the AFS and HFT portfolios is also at a very low level. The low DoE indicates that although the modified duration of the HTM portfolio is higher, the interest rate risk arising out of this higher duration is not very significant. 7.43 The liquidity stress test results show that some banks face liquidity constraints under the stress scenarios. Though the scenarios developed have very stringent assumptions, nevertheless, the results of the stress test suggest that banks need to continuously monitor their contingency liquidity plans while also strengthening systems for management of liquidity risk. The stress tests assume that assets available to meet the funding gaps are those maturing within one year. However, as banks maintain a minimum of 25 per cent of their NDTL in SLR securities, it would be possible to raise additional liquidity when required. 7.44 While the slowdown in the real sector could adversely impact the loan portfolio of the banks, both in terms of growth and asset quality, the NIM may come under pressure given that banks’ cost of funding could increase in view of rising inflationary pressure. The provisioning requirements could increase on account of increase in NPAs and higher rise in mark-to-market losses due to increase in sovereign yields, thereby pressurising banks’ bottom-line and overall financial indicators. Based on the above base line settings, plausible credit quality shocks were administered on the projected financials of the banks to gauge the impact and resilience of the system. The results revealed that the banking system is comfortably resilient at the current levels of provisions and is able to significantly withstand the impact of increased provisioning coverage norms of 70 per cent under a relatively stringent provisioning scenario. However, the systemic resilience could be tested if there is an extraordinary deterioration in credit quality.
|
|||||||||||||||||||||||||||||||||||||||||||||||||||||||||||||||||||||||||||||||||||||||||||||||||||||||||||||||||||||||||||||||||||||||||||||||||||||||||||||||||||||||||||||||||||||||||||||||||||||||||||||||||||||||||||||||||||||||||||||||||||||||||||||||||||||||||||||||||||||||||||||||||||||||||||||||||||||||||||||||||||||||||||||||||||||||||||||||||||||||||||||||||||||||||||||||||||||||||||||||||||||||||||||||||||||||||||||||||||||||||||||||||||||||||||||||||||||||||||||||||||||||||||||||||||||||||||||||||||||||||||||||||||||||||||||||||||||||||||||||||||||||||||||||||||||||||||||||||||||||||||||||||||||||||||||||||||||||||||||||||||||||||||||||||||||||||||||||||||||||||||||||||||||||||||||||||||||||||||||||||||||||||||||||||||||||||||||||||||||||||||||||||||||||||||||||||||||||||||||||||||||||||||||||||||||||||||||||||||||||||||||||||||||||||||||||||||||||||||||||||||||||||||||||||||||||||||||||||||||||||||||||||||||||||||||||||||||||||||||||||||||||||||||||||||||||||||||||||||||||
പേജ് അവസാനം അപ്ഡേറ്റ് ചെയ്തത്:


