 IST,
IST,
V. Financial Markets
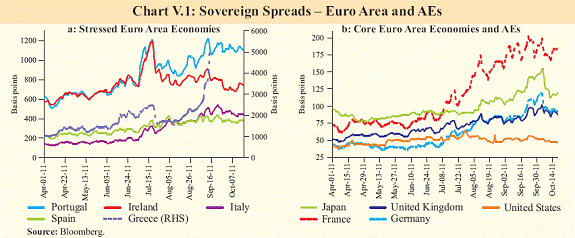
Indian equity and foreign exchange markets, unlike the debt and money markets, showed greater volatility in Q2 of 2011-12 than in the previous quarter. This mainly reflected risk aversion arising out of the deepening euro area sovereign debt crisis. Going forward, domestic growth and inflation outlook, resilience of the banking sector and the nature and depth of global uncertainty will shape the developments in the financial markets. The global markets will primarily track the international policy actions to address the problem of euro area sovereign debt crisis and slowdown in advanced economies (AEs). Risk aversion, volatility back in global markets driven by sovereign debt crisis V.1 The downgrade of US sovereign debt rating by S&P and deteriorating sovereign debt problems in the euro area resulted in renewed volatility in global financial markets during Q2 of 2011-12. The credit default swaps (CDS) spreads of stressed euro area economies like Portugal, Italy and Greece widened since August 2011, reflecting market perception of worsening sovereign debt sustainability of these economies. AAA rated sovereigns, such as Germany and France, were also impacted in the absence of credible measures to contain the pervasive impact of the worsening sovereign crisis (Chart V.1). Several periphery and core European countries including Italy and Spain were downgraded by the credit rating agencies following the debt concerns, slackening economic activity and weakening financial systems.
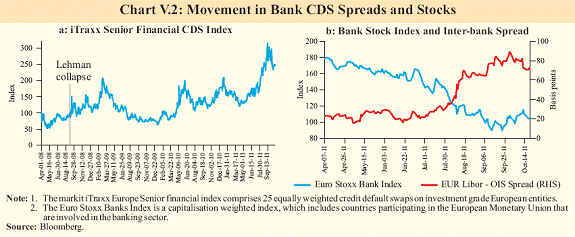
Debt overhang causing significant spillover risks V.2 There is a growing threat that financial stability concerns would get transmitted to the real economy as sovereign debt problems translate into a deterioration of the balance sheets of banks holding these sovereign bonds, mainly in Europe. The stocks of European banks, particularly those with high exposure to the sovereign debt issued by the periphery countries, faced broad-based sell-offs. The CDS spreads of banks widened to levels higher than those during the US sub-prime crisis, partly reflecting the risk perception arising from lack of progress in deleveraging in euro area banks (Chart V.2).
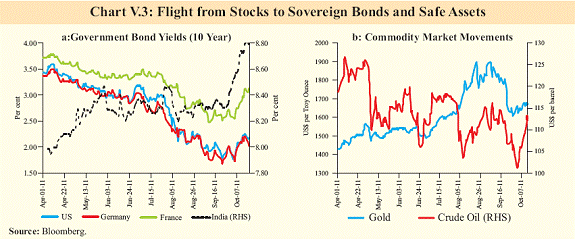
Debt resolution deadlock adds to market uncertainties V.3 One of the main policy tools to deal with the 2008 crisis was fiscal stimulus. AEs raised public expenditure and pared down some tax burden expecting thereby to boost private demand. Nonetheless, reflecting deleveraging by households, tight bank lending and deflation in house prices, private demand decelerated, muting the fiscal multiplier. Presently, while unemployment continues to remain at elevated levels, the option of fiscal stimulus is largely unavailable on account of concerns over debt sustainability. The governments of AEs are striving to find a balance between the need for a fiscal stimulus in the short-term against sustainable fiscal adjustment in the mediumterm. V.4 Reacting to the growing uncertainties in the policy outlook, global financial markets declined despite an assurance in the euro area summit (July 2011) to increase the flexibility of the European Financial Stability Facility (EFSF). That assurance failed to inspire confidence underlining the challenge of keeping a monetary union intact even without a fiscal union. The policy announcement by the US Fed to keep the longer-term interest rates low through its maturity extension programme (“operation twist”) on September 21, 2011 has received limited response so far. Search for safe heaven assets continues V.5 There has been a shift in investor preference towards perceived safe haven assets (Chart V.3). This has triggered global selloffs in the equity markets and portfolio rebalancing in favour of gold as a safe asset has caused gold prices to touch a historical high of US $1900 per troy ounce on September 5, 2011. The slowdown in growth of AEs led to the decline in the crude oil prices in the quarter.
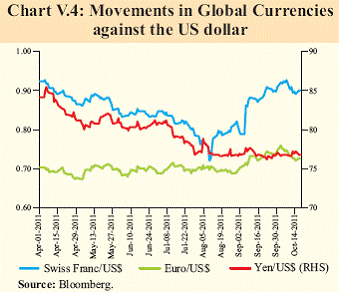
V.6 International currency markets turned volatile during Q2 of 2011-12. The US dollar appreciated vis-a-vis the euro (Chart V.4).
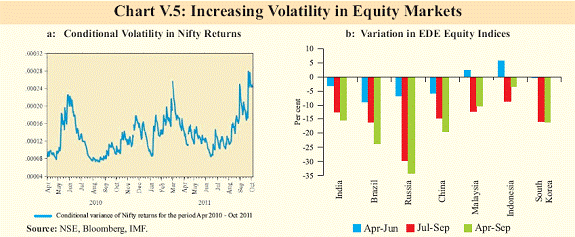
Spillover pressures witnessed in Indian equity and currency markets V.7 Taking cues from the global turmoil, Indian financial market segments that have a high degree of cross-border linkages turned volatile, while the other segments without strong linkages remained orderly. As a result, increased volatility was evidenced in the equity and currency markets since September 2011 (Chart V.5a). V.8 In line with the global markets, the Indian equity prices continued their declining trend in Q2 of 2011-12. The rise in equity indices at the beginning of Q2 due to FII inflows could not sustain the momentum owing to global developments and net sales by FIIs ensued. The two key Indian equity indices, Sensex and Nifty, declined (y-o-y) by about 14.5 per cent and 14.7 per cent, respectively, as on October 19, 2011. Nonetheless, the decline in Indian equity markets was relatively less than that in many emerging and developing economies (EDEs). P-E ratio of Indian equities remained higher than other EDEs as at end September 2011 (Table V.1, V.2 and Chart V.5b).
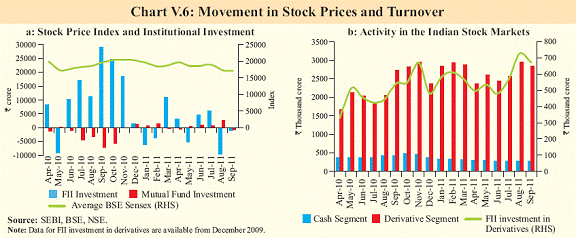
FII investments decline V.9 FII investments declined during Q2 of 2011-12. FIIs made net sales in the equity segment while making net purchases in the debt segment. Mutual funds (MFs) made net purchases in both equity and debt segments. The turnover in equity derivatives segment increased substantially over the year. FII investments in equity derivatives increased significantly during Q2 as compared to the previous quarter (Chart V.6). V.10 Resource mobilisation in the primary segment of the domestic capital market was lower during 2011-12 (up to September) (Table V.3). Dampened secondary market conditions and poor performance of the IPOs after their listing also affected investor and promoter sentiment. Resource mobilisation by MFs, however, improved.
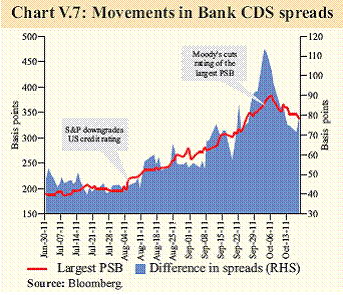
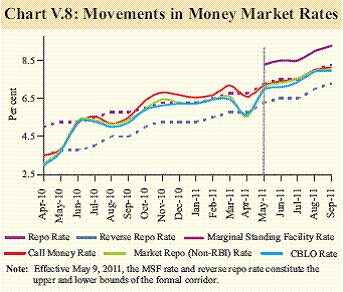
Bank CDS spreads widen following the downgrade of the largest PSB V.11 Credit rating agency Moody’s downgraded the largest public sector bank (PSB) on October 4, 2011 on account of the asset quality and capital adequacy concerns. CDS spreads of that bank, which had started to widen sharply from early August, widened further by 10 bps that day. The difference in spreads between the largest private and public sector banks, which had seen range bound movements for most part of the previous quarter, widened in September 2011, partly reflecting investor concerns about contagion risk (Chart V.7). Money market tracks monetary policy signals V.12 The monetary policy stance continued to favour deficit liquidity conditions in Q2 of 2011-12 for effective monetary policy transmission. Against the backdrop of tight liquidity conditions in the system, the call rate rose at the beginning of Q2 and firmed up thereafter, in line with the 75 bps hike in the policy rate. The call rate generally hovered around the policy (repo) rate during Q2. The money market remained orderly without exhibiting signs of stress (Chart V.8, Tables V.4 and V.5).
V.13 The collateralised segment (i.e. CBLO and market repo) accounts for more than 80 per cent of the overnight money market volume and constitutes the bulk of money market. Reflecting active market conditions, the transaction volumes in this segment remained high. Banks and primary dealers continued to be the most significant borrowers, while the MFs continued as the major group of lenders followed by banks in this segment. However, the share of MFs in the total lending declined significantly to below 50 per cent in Q2.
V.14 In the absence of credit funding pressures and given reasonable retail deposit mobilisation in Q2, banks’ issuance of certificates of deposits (CDs) declined. Consequently the rate of interest on CDs declined. V.15 The average fortnightly issuance of commercial paper (CP) declined in Q2 of 2011-12 (up to August) as compared to that of the previous quarter. ‘Leasing and finance’ and ‘manufacturing companies’ continued to be the major issuers of CPs. V.16 Primary yields on Treasury Bills (TBs) firmed up consistent with the spurt in overnight rates during Q2 of 2011-12 (Table V.6). The upward movement in rates reflected the marked increase in Government short-term borrowing through issuance of TBs and cash management bills (CMBs) to finance unanticipated cash-flow mismatches coupled with tight liquidity conditions.
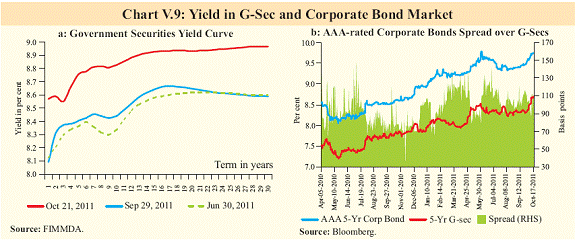
Additional market borrowing puts pressure on yields V.17 Yield movements, which remained generally range bound during July 1- September 28, 2011 rose thereafter, factoring in the announced increase in the Government’s market borrowings by `52,872 crore over and above the amount budgeted for 2011-12 (Chart V.9a). The hardening of primary yields was associated with an increase in the weighted average maturity during 2011-12 so far (Table V.7). V.18 Reflecting the impact of the unanticipated increase in Government market borrowing, the spread of 5-year corporate bonds over comparable G-secs decreased (Chart V.9b).
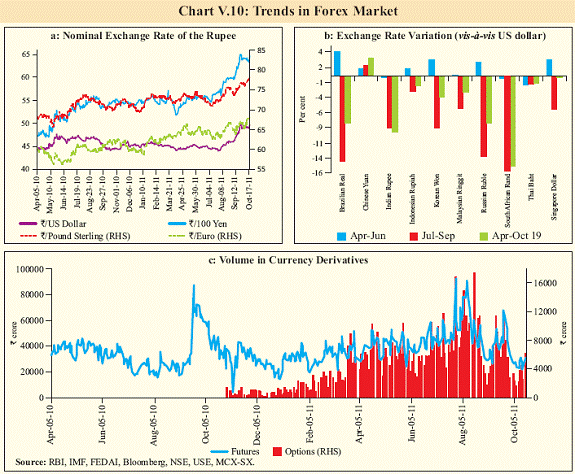
Monetary transmission strengthens with rates hardening in the credit market V.19 During Q2 of 2011-12, banks increased their deposit rates across all maturities, with the sharpest rise in maturities up to 1 year for all categories of banks. The increase in modal deposit and base rates for the quarter was about 40 bps and 75 bps, respectively (Table V.8). The rupee depreciated significantly reflecting global uncertainty V.20 During April-July 2011, the Indian rupee exhibited two-way movement. However, since August 2011, it witnessed depreciation against all four major international currencies, reflecting prevailing global market sentiment led FII-sell-offs (Chart V.10a). Nevertheless, in comparison to some of the EDEs, the depreciation in the Indian rupee during Q2 of 2011-12 has been less stark (Chart V.10b).
V.21 The average daily turnover in the merchant segment as well as interbank segment of the forex market was lower than that in the preceding quarter. The volume in value terms in the currency derivative market - both options and futures - which increased up to August 2011, showed some deceleration in September 2011 (Chart V.10c).
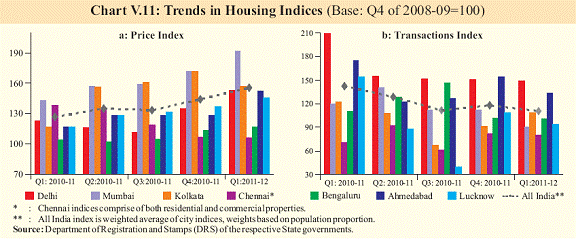
Housing prices rise amidst falling transaction volumes in Q1 of 2011-12 V.22 Despite falling volumes, property prices, as captured by the Reserve Bank’s Quarterly House Price Index (HPI), firmed up in Q1 of 2011-12. The price index increased by about 8 per cent for the second successive quarter at an all-India level, while the transactions volume index that had fallen sharply in Q2 and Q3 of 2010-11 dipped by about 7 per cent in Q1 of 2011-12 negating the increase in the preceding quarter. V.23 House prices increased in five of the seven major cities on a quarter-over-quarter basis in Q1 of 2011-12, but declined in Kolkata and remained flat in Chennai (Chart V.11a). On the other hand, the data on volume of transactions show that the number of transactions have fallen in six cities, except Kolkata (Chart V.11b). On a y-o-y basis, there has been a rise in housing prices and fall in housing transactions in Q1 of 2011-12 in six cities, barring Chennai. More financial volatility likely ahead V.24 The Indian financial markets will continue to be conditioned by the evolving macroeconomic developments, both global and domestic. Weak outlook for the US economy, and possible spillover effect from global contagion of the euro area crisis through the extremely interconnected European banking and financial market channel, among others, pose near-term risks to the financial markets. Persistence of domestic inflation with a plausible moderation in growth could impact corporate earnings, which may affect equity valuations. On the other hand, with substantial correction having occurred and limited investment opportunities globally, markets could see a recovery. However, the asset quality of Indian banking sector, the risk exposure and the challenge of public sector bank recapitalisation in the face of fiscal pressures are issues which require attention. |
|||||||||||||||||||||||||||||||||||||||||||||||||||||||||||||||||||||||||||||||||||||||||||||||||||||||||||||||||||||||||||||||||||||||||||||||||||||||||||||||||||||||||||||||||||||||||||||||||||||||||||||||||||||||||||||||||||||||||||||||||||||||||||||||||||||||||||||||||||||||||||||||||||||||||||||||||||||||||||||||||||||||||||||||||||||||||||||||||||||||||||||||||||||||||||||||||||||||||||||||||||||||||||||||||||||||||||||||||||||||||||||||||||||||||||||||||||||||||||
പേജ് അവസാനം അപ്ഡേറ്റ് ചെയ്തത്:


