VI. Outstanding Liabilities, Market Borrowings and Contingent Liabilities of State Governments - ആർബിഐ - Reserve Bank of India
VI. Outstanding Liabilities, Market Borrowings and Contingent Liabilities of State Governments
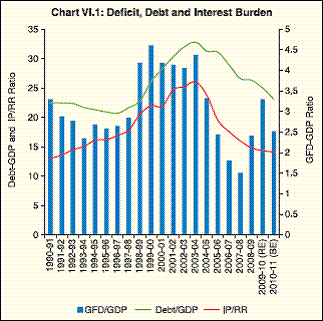
The expansionary fiscal measures undertaken by some State governments to mitigate the adverse impact of the global economic slowdown led to a higher consolidated gross fiscal deficit in 2008-09 and 2009-10. Even with slippages in 2008-09 and 2009-10 on fiscal deficit targets and consequent higher market borrowings, the overall debt of States at 25.0 per cent of GDP in 2009-10 (RE) has remained well above the recommended target of the Twelfth FC. The Centre allowed incremental market borrowings to the extent of 0.5 per cent of GSDP each in 2008-09 and 2009-10. A number of States resorted to higher incremental market borrowings. In general, States continued to accumulate cash surpluses during 2009-10 and 2010-11 and their dependence on WMA/OD remained relatively moderate during this period. 1. Introduction 6.1 In the wake of counter-cyclical stimulus measures undertaken by several governments across countries in the past two years, rising public debt levels have emerged as the latest threat to fiscal and macroeconomic stability, leading to increased concerns about growing sovereign risk. In India, although the Central government debt- GDP ratio rose due to fiscal stimulus measures, a notable feature was that the consolidated debt-GDP ratio of the States continued to decline during 2008- 09 and 2009-10. Against this backdrop, this chapter analyses the outstanding liabilities, market borrowings, contingent liabilities and ways and means advances-overdraft (WMA-OD) of the State governments. 2. Outstanding Liabilities 6.2 An inter-temporal comparison shows that the consolidated outstanding liabilities of States as a ratio to GDP steadily increased from 1997-98 to 2003-04. With the debt relief mechanism prescribed by the Twelfth FC, which incentivised adherence to a rule-based fiscal regime, the States were able to contain the magnitude of outstanding liabilities to 26.6 per cent of GDP by 2007-08. The declining trend in the debt-GDP ratio persisted from 2008-09 to 2010-11 (Table VI.1 and Chart VI.1).
Magnitude 6.3 The additional expenditure obligations emanating from revised pay structures and expansionary fiscal policy measures announced by a number of State governments led to higher levels of debt in 2008-09 and 2009-10, which grew by 10.7 per cent and 11.4 per cent in 2008-09 and 2009-10, respectively, compared with an increase of only 7.0 per cent in 2007-08. In spite of higher levels of outstanding debt in 2008-09 and 2009-10 (RE), the aggregate debt-GDP ratios of States recorded a decline during the same period. Importantly, the aggregate debt-GDP ratio at 25.0 per cent in 2009-10 (RE) was well below the level of 30.8 per cent recommended by the Twelfth FC. In 2010-11 (BE), the outstanding debt-GDP ratio of the States is likely to decline further to 23.1 per cent. 6.4 States were allowed to raise additional market borrowings to the extent of 0.5 per cent of GSDP each in 2008-09 and 2009-10 which were to be utilised for undertaking capital investment. Accordingly, the GFD-GSDP target was relaxed from 3.0 per cent to 3.5 per cent in 2008-09 and further to 4.0 per cent in 2009-10. States seem to have resorted to this additional provision of borrowings in 2008-09 with incremental market borrowings at the consolidated level relative to GDP turning out to be higher at 0.8 per cent. Although the incremental market borrowing-GDP ratio at the consolidated level declined slightly during 2009-10, the incremental market borrowings were higher in absolute terms. The State-wise position shows that incremental market borrowings as a ratio to GSDP exceeded the stipulated limit of 0.5 percentage point of GSDP in 16 States during 2008-09 and in 11 States during 2009-10. Notwithstanding the increase in market borrowings in 2008-09 and 2009-10, the consolidated debt-GDP ratios of State governments declined as the share of other debt components fell and nominal economic growth turned out to be higher than that in outstanding debt. Composition of Debt 6.5 The composition of States’ outstanding liabilities has witnessed a noticeable change in recent years. With the increasing emphasis on financing GFD through market borrowings, its share in outstanding liabilities of State governments has increased gradually, while the dependence on loans from the Centre declined sharply from 1999-2000 onwards. In 2009-10 (RE), market borrowings emerged as a dominant component with a share of 31.5 per cent in total outstanding liabilities of the State governments, which is expected to further increase to 35.6 per cent in 2010-11 (BE). In contrast, the share of the National Small Savings Fund (NSSF) has declined persistently since end-March 2008. The NSSF is expected to account for around one-fourth of the total outstanding liabilities as at end-March 2011 (Table VI.2). The share of high-cost debt instruments, i.e., public account items like ‘small savings’ and ‘State provident fund’ in total outstanding liabilities has remained in the range of 12.1-12.3 per cent since 2005-06. Considering the burden arising as a result of the high effective rate of interest on NSSF loans taken by States till 2006-07, the Thirteenth FC has recommended interest relief on these NSSF loans, with a precondition relating to the enactment of the FRL. The detailed composition of outstanding liabilities of State governments from 1990-91 to 2010-11 (BE) is presented in Appendix Tables 19 and 20, while the State-wise composition of outstanding liabilities is provided in Statements 26-28. 3. State-wise Debt Position 6.6 The overall debt-GDP ratio of States improved in 2008-09 and 2009-10 (RE). Despite the extra expenditure obligations emanating from the implementation of revised pay structures and fiscal stimulus measures, the impact in terms of debt-GSDP ratios remained muted in most States. The State-wise debt-GSDP position is presented in Table VI.37. Non-Special Category States 6.7 In 2008-09, all non-special category States, except Jharkhand and Tamil Nadu, registered lower debt-GSDP ratios compared with 2007-08. In 2009- 10 (RE), 10 out of 17 non-special category States recorded lower debt-GSDP ratios than in 2008-09. A marked improvement in debt-GSDP ratio was observed in the case of Uttar Pradesh, followed by Orissa and Punjab. However, Uttar Pradesh continued to be the State with the highest debt- GSDP ratio of 43.5 per cent, followed by West Bengal. The debt-GSDP ratio was the lowest at 15.2 per cent for Chhattisgarh, followed by Haryana and Karnataka. 6.8 The debt-GDP ratio has implications for interest payments relative to revenue receipts. Since interest payments are committed expenditures, revenue deficits are bound to increase if the burden on account of higher interest payments is not fully offset by higher revenue receipts. Eventually, it would reflect in higher fiscal deficit. Therefore, from the debt sustainability point of view, the trend in interest payments as a ratio to revenue receipts (IP-RR) assumes critical importance. State-wise data show that 11 States were able to align their IP-RR ratios with the Twelfth FC’s target of 15 per cent by 2009-10. Gujarat, Kerala, Maharashtra, Punjab, Rajasthan and West Bengal, however, could not achieve this target. While West Bengal used 33.6 per cent of its revenue receipts for interest payments, the IPRR ratio was the lowest at 5.9 per cent in the case of Chhattisgarh. In 2010-11 (BE), 11 non-special category States are expected to record lower debt- GSDP ratios than that in 2009-10 (RE), while the debt-GSDP ratios would be higher in the case of Andhra Pradesh, Chhattisgarh, Karnataka, Madhya Pradesh, Maharashtra and Uttar Pradesh.
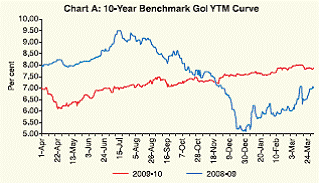
Special Category States 6.9 Special category States exhibit higher aggregate expenditure-GSDP ratios vis-à-vis nonspecial category States as they play a major role in delivering various services to the public. Despite higher grants from the Centre that mute the impact of relatively higher expenditure vis-à-vis the resource base of special category States, their debt-GSDP ratios are generally higher. However, their share as a group in total outstanding debt of all States during 2005-06 to 2009-10 (RE) was only about 8.0 per cent. In 2009-10, the debt-GSDP ratio declined in six special category States, while it increased in the case of Manipur, Mizoram, Nagaland, Sikkim and Tripura. Arunachal Pradesh recorded the highest debt-GSDP ratio of 115.9 per cent, followed by Mizoram. The reduction in debt- GSDP ratio is expected to be more widespread in 2010-11 (RE), as all special category States, except Sikkim and Tripura, are expected to record lower debt-GSDP ratios (Table VI.3). 4. Market Borrowings Consolidated Position 6.10 As already mentioned, there has been greater reliance on market borrowings by State governments to meet their resource requirements. This was evident during 2008-09 and 2009-10 when States had to undertake counter-cyclical measures in the wake of the impact of the global economic downturn on domestic economic activity. The higher amount of market borrowings raised during this period was facilitated by additional provisions allowed by the Centre. As a result, the outstanding stock of State Development Loans (SDLs) recorded an increase of 34.6 per cent and 28.6 per cent in 2008-09 and 2009-10, respectively, compared with an increase of 23.0 per cent in 2007-08. The interest rate profile of outstanding stock of SDLs shows that the share of high-cost market loans (interest rate over 10 per cent) declined further during 2009-10. The share of outstanding stock of SDLs with interest rates of 10 per cent and above declined sharply from 10.1 per cent as at end-March 2009 to 4.7 per cent as at end-March 2010 (Table VI.4). However, the share of outstanding SDLs with interest rates ranging between 8-10 per cent increased from 34.4 per cent at end-March 2009 to 44.8 per cent at end-March 2010, which indicates that incremental debt was raised at somewhat higher cost in 2009-10 (Table VI.4). Allocation of Market Borrowings during 2008-09 and 2009-10 6.11 The level of gross market borrowings of the State governments was 74 per cent higher in 2008-09 over 2007-08. In 2009-10, the level of market borrowing requirements continued to be high, as certain States implemented fiscal stimulus measures during the year. However, the State governments were able to complete their market borrowing programmes smoothly, given the comfortable liquidity position in the market. In 2009- 10, the gross amount raised by State governments was 8.1 per cent higher than the gross allocation for the year and it was 11.0 per cent higher than the gross borrowings in 2008-09. Orissa was the only State that did not participate in the market borrowing programme in 2009-10, like in the previous year when Orissa and Chhattisgarh had abstained. Five States raised less than their sanctioned amounts in 2009-10 as against 15 States in 2008-09. The market borrowing programme was evenly spaced throughout the year. Reflecting the sheer size of issuances, the weighted average yield of SDLs issued during 2009-10 was higher than that in the previous year. The spread between the benchmark Central Government securities and the SDLs, however, stood lower during 2009-10, reflecting a more evenly spaced distribution of market borrowings during the year (Box VI.1). Box VI.1 : Efficient Management of State Market Borrowings - Cost and Spread The year 2009-10 witnessed robust activity in the issuance of both Central and State government securities. The issuance of Government of India dated securities increased by 65.2 per cent to `4,51,000 during the year. In addition, treasury bills of 91-day, 182- day and 364-day maturities were raised for a notified amount of `3,77,000 crore on a gross basis. On top of this, the issuances of State Development Loans (SDLs) increased by 11.0 per cent to `1,31,122 crore during 2009-10 compared to `1,18,138 crore raised during 2008-09. In fact, market borrowings have become a dominant source for financing the fiscal deficit of State governments. The cost of borrowing generally depends upon the prevailing secondary market yield on the securities. Despite huge primary issuances of government securities during 2009-10, the yield on the 10-year benchmark Government of India security ruled at lower levels up to mid-November 2009, before firming up thereafter (Chart A). The transmission of lower policy rates to long-term government bonds was significant during the first half of the year. The yields started firming up from December 2009, reflecting the general market conditions, and ranged between 7.04 per cent and 8.58 per cent for 2009-10 as a whole. The weighted average yield of SDLs during 2009-10 was 8.11 per cent compared with 7.87 per cent during 2008-09. Though the cut-off yield of SDLs firmed up during the fourth quarter of 2009-10, the spread between the 10-year benchmark Government of India securities and SDLs narrowed significantly and was in the range of 45-129 basis points during the year compared with 21-236 bps during 2008-09. Consequently, the weighted average spread during 2009-10 turned out to be lower at 86 basis points compared with 122 basis points during 2008-09.
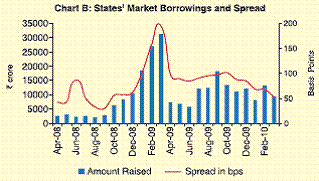
Spread movements depend upon various factors, which, inter alia, include the liquidity condition at the time of accessing the market, the tradability of the SDLs and the size of issuance of individual States as also the size of aggregate issues in a tranche, in addition to the fiscal strength of the concerned State. The cost of borrowing is also a function of market liquidity. Given this, the release of an indicative calendar, along the lines of Government of India securities, could be an efficient tool to plan State borrowings. An indicative calendar for SDLs would provide benefits in terms of market predictability, proper spacing of the auctions and the resultant cost effectiveness to the issuers. Investors would also benefit in terms of operational efficiency and better planning. The lower spreads in 2009-10 reflected, apart from others, the impact of proper planning and even distribution of the States’ borrowing programmes throughout the year, while there was a bunching of SDLs towards the second half of 2008-09, particularly in the fourth quarter. During 2009-10, about 48.2 per cent of the market borrowings were raised during the first half of the year compared to only 13.4 per cent raised during the comparable period of 2008-09 (Chart B). Notably, the initiatives taken during 2009-10, such as the introduction of non-competitive bidding in the SDL auction, have received a good response from retail investors. In addition, three tranches of SDLs were issued with a put option for a State Government, which benefited in terms of lower borrowing cost. Proper planning of the issuances with appropriate policy initiatives to improve tradability of the SDLs in the secondary market would go a long way towards efficient debt management.
6.12 The available data shows that the weighted average yield of State government securities was lower at 7.87 per cent and 8.11 per cent during 2008-09 and 2009-10, despite a significant increase in the level of market borrowings by State governments which perhaps reflected a softer interest rate environment during this period. During 2010-11 (up to March 23, 2011), 27 tranches of auctions were conducted under the market borrowing programme of the State Governments. Twenty-five State Governments have raised an aggregate amount of `1,03,910 crore on a gross basis compared to `1,31,122 crore raised by 28 State Governments (including Puducherry) during the corresponding period in the previous year. In 2010-11, so far the cut-off yields have ranged between 8.05 and 8.58 per cent (as against 7.04-8.58 per cent during 2009-10). The yield spread between the State and Central Government securities of 10-year tenor has narrowed to 31-69 basis points compared to 45- 129 basis points during the corresponding period of the previous year. The weighted average yield of gross borrowings of States during 2010-11 so far works out to 8.39 per cent, i.e., marginally higher than the 7.87 per cent during 2008-09 and 8.11 per cent for 2009-10 (Table VI.6).
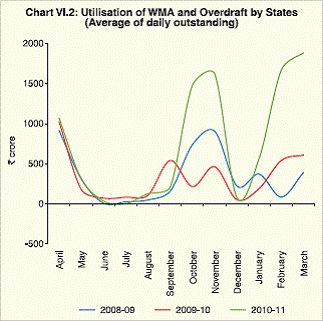
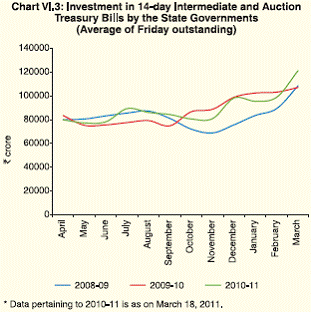
Maturity Profile of State Government Securities 6.13 Since 2005-06, all issuances of SDLs have a maturity of 10 years. The significant increase in market borrowings of the State governments in 2008-09 and 2009-10 could lead to large repayment obligations from 2017-18 onwards. The maturity profile of the outstanding stock of SDLs as at end-March 2010 shows that the majority were in the maturity bucket of 7 years and above (Table VI.6). 5. Contingent Liabilities 6.14 The Reserve Bank maintains the consolidated sinking fund (CSF) on behalf of the State Governments from contributions made by them. The CSF aims to provide a cushion for amortisation of all liabilities. As at end-March 2010, 20 States had notified under this scheme and the aggregate outstanding investments in CSF stood higher at `30,209 crore compared with `24,031 crore at the end of March 2009. In addition to the budgetary support through loans, subsidies and equity, State governments also facilitate the financing of State PSUs and other institutions by issuing guarantees and letters of comfort; in this way, States incur contingent liabilities which do not form part of their debt obligations. Based on information available for 19 State governments, the total outstanding guarantees of State governments as at end-March 2009 were lower at 2.8 per cent of GDP than 3.3 per cent as at end-March 2008 (Statement 43). In the event of default by borrowing entities, the States are required to meet the debt service obligations. In order to contain the fiscal risks associated with guarantees, 18 States have put in place ceilings (statutory or administrative) on the guarantees (outstanding or incremental). Similarly, Guarantee Redemption Funds (GRFs) have been set up in 14 States. As per information available with the Reserve Bank on 10 GRFs, the aggregate outstanding investments in GRF by these States stood at `3,357 crore as at end-March 2010 compared with `3,082 crore at end-March 2009. 6. Liquidity Position and Cash Management 6.15 Keeping in view the cash surplus position of the State governments, the WMA limits of State governments have been left unchanged since 2006-07. Accordingly, the extant State-wise normal WMA limit was fixed at `9,925 crore for 2009-10 and the limit has been retained for 2010-11. The rate of interest on normal and special WMA and OD continue to be linked to the repo rate. Most State governments have accumulated sizeable cash surpluses in recent years, which reflected, inter alia , the fiscal consolidation process undertaken since 2005-06. The temporary setback to fiscal consolidation in the wake of the global crisis, however, did not impact the cash surplus position of the States, as the liquidity pressures remained confined to a few State governments. The position in respect of outstanding WMA/OD remained relatively comfortable during 2009-10 (Chart VI.2). Although the dependence of most of the States on WMA/OD has remained moderate in 2010-11, two chronic revenue-deficit States, viz., West Bengal and Punjab, depended heavily on WMA/OD to meet their temporary resource gaps in the months of October and November 2010. 7. Investment of Cash Balances 6.16 Since the middle of 2004-05, most States have tended to accumulate sizeable cash surpluses. Despite expenditure pressures on account of pay revisions and fiscal stimulus measures undertaken in 2008-09 and 2009-10, most States continued to accumulate surplus cash balances which they invested in 14-day Intermediate and Auction Treasury Bills (ITBs and ATBs), although temporary dips were observed in some months (Chart VI.3). Monthly data shows that a major portion of cash surpluses is carried forward by the State governments into the next year. As on March 18, 2011, the investment in 14-day ITBs by the State governments stood at `1,20,318 crore, which has significant implications for monetary policy. Importantly, since mid-June 2010, States’ investments in ATBs have shown substantial increases, reflecting its positive return differential over ITBs.
8. Debt Consolidation and Relief 6.17 Since 2005-06, the Debt Consolidation and Relief Facility (DCRF) has resulted in considerable relief to the States in terms of debt write-off and interest relief on outstanding Central loans. From 2005-06 to 2009-10, Central loans amounting to `1,13,601 crore have been consolidated and an amount of `22,343 crore had been written off by the end of 2009-10, while interest relief obtained by the States amounted to `21,634 crore during the same period. The impact of the DCRF and other reform measures was also evident from the significant reduction in the average interest rate on outstanding debt since 2004-05 compared to earlier years (Table VI.7). Under the DCRF, all States, with the exception of West Bengal and Sikkim, have benefited. Among the non-special category States, Uttar Pradesh, Gujarat and Andhra Pradesh have benefited the most in terms of debt consolidation, while Assam and Himachal Pradesh were the major beneficiaries in the category of special category States. In terms of the Thirteenth FC’s recommendations, the DCRF should be extended to States that have not availed of the benefit of consolidation, subject to the enactment of the FRBM Act. It may be noted that non-beneficiary States, viz., West Bengal and Sikkim, enacted the FRBM Act in 2010-11. 9. Conclusion 6.18 Given the significant increase in expenditure, which was witnessed across States during 2008-09 and 2009-10, the aggregate market borrowings of State governments recorded a sharp increase. Nonetheless, the debt-GDP ratio of States continued to show a declining trend as the sharp increase in market borrowings was partly offset by a reduction in other components of debt and nominal GDP grew at a faster rate relative to that in overall debt. Under the recommendations of the Thirteenth FC, States were eligible to get benefits under the DCRF subject to the enactment of the FRBM Act. With the recent enactment of the FRBM Act, West Bengal and Sikkim are expected to benefit in terms of debt consolidation and interest relief. States have continued to accumulate surplus cash balances during 2009-10 and 2010-11 to date, which is also reflected in the relatively moderate recourse to WMAs/OD by the State governments. 7 The detailed State-wise and component-wise break-up of outstanding liabilities is provided in Statements 26-28. The outstanding liabilities as at end-March 2000 of the three bifurcated States (Bihar, Madhya Pradesh and Uttar Pradesh) have been apportioned to the three newly formed States (Jharkhand, Chhattisgarh and Uttarakhand), respectively, on the basis of their respective proportion of the population. |
|||||||||||||||||||||||||||||||||||||||||||||||||||||||||||||||||||||||||||||||||||||||||||||||||||||||||||||||||||||||||||||||||||||||||||||||||||||||||||||||||||||||||||||||||||||||||||||||||||||||||||||||||||||||||||||||||||||||||||||||||||||||||||||||||||||||||||||||||||||||||||||||||||||||||||||||||||||||||||||||||||||||||||||||||


