 IST,
IST,
VI. Price Situation
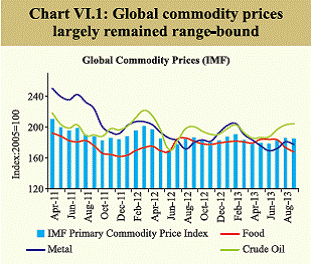
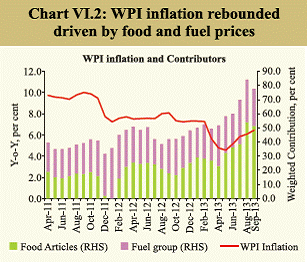
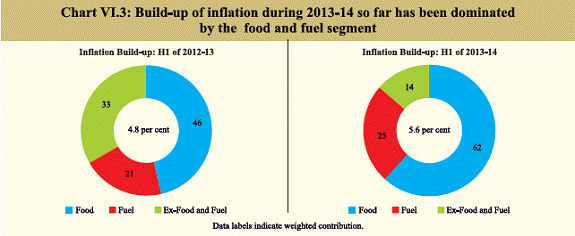
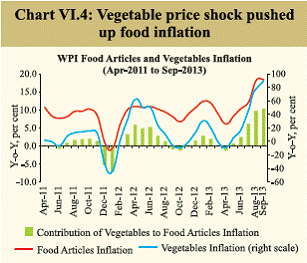
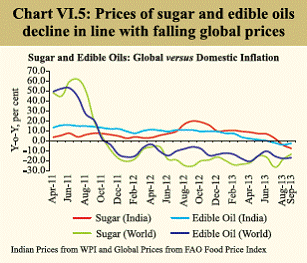
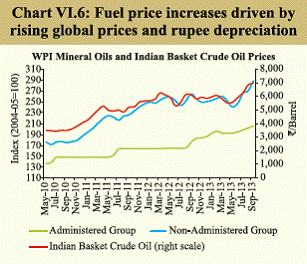
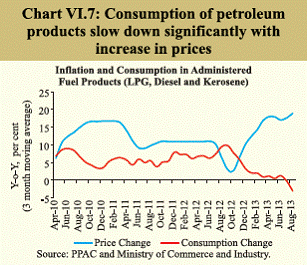
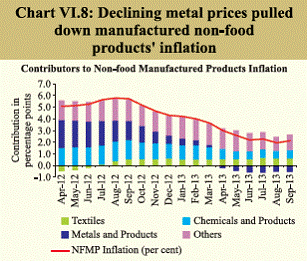
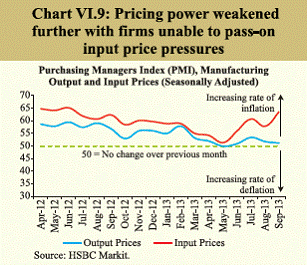
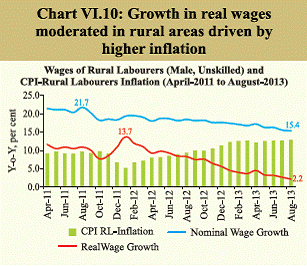
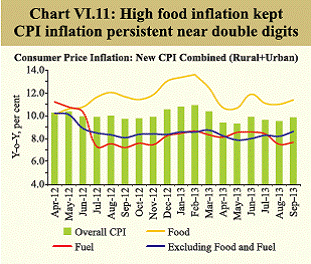
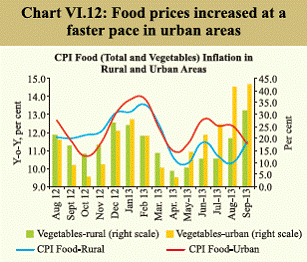
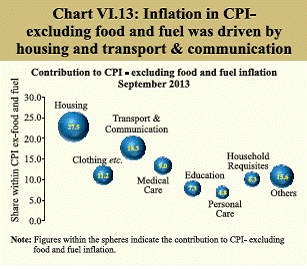
On an average basis, headline WPI inflation has declined significantly over the past two years, though it has edged up since May 2013. Food articles inflation reached a three-year high largely due to a sharp rise in vegetable prices. Exchange rate depreciation and the rise in crude oil prices led to a rebound in fuel inflation to double-digit levels. As a result, headline inflation increased even though manufactured non-food inflation remained subdued. Going forward, the good monsoon should have a salutary effect on food inflation, but second-round effects from already high food and fuel inflation could impart upside pressures on prices of other commodities and services. Concerns about inflation emanate not just from high and persistent CPI inflation but also from rising WPI inflation. inflation and exchange market pressures prompted many EMDEs to tighten their monetary policies while inflation remained benign in Advanced Economies VI.1 Owing to weak demand conditions and benign inflation, Advanced Economies (AEs) persisted with their exceptionally accommodative unconventional monetary policies (Table VI.1). Consumer price inflation in the OECD area was 1.7 per cent, year-on-year, in August 2013, down from the 2.0 per cent recorded in July. As inflation in AEs is likely to remain moderate in the near-term given the current commodity price cycle and slack labour market conditions, normalising monetary policy in AEs may take a long time. VI.2 In contrast, monetary policy was tightened in many key Emerging Markets and Developing Economies (EMDEs), such as Brazil, India and Indonesia during Q3 of 2013 as they faced inflation and exchange rate pressures, amidst large and volatile capital outflows following the Fed’s indication on May 22, 2013 that prompted expectations about the global interest rate cycle reversing. Inflation risk for some EMDEs is likely to persist from exchange rate pass-through given that the pace and timing of withdrawal of monetary accommodation in AEs could keep capital flows volatile. Global commodity price inflation likely to stay subdued in the near term VI.3 Global commodity price increases have been moderate for some time now though their levels continue to remain elevated in relation to the demand-supply balance. The IMF’s primary commodity price index for Q3 of 2013 was 3.2 per cent higher than the level in Q2 (Chart V1.1). Prices, especially of crude oil have not declined commensurate with improved supply prospects, due to abundant global liquidity and geo-political uncertainties in the Middle-East region. At the same time, the growth deceleration in EMDEs has led to some correction in global metal prices. With prospects of a strong recovery in global growth remaining dim in the near-term, the global commodity price inflation may stay subdued for now. Risks to global commodity prices, however, remain from volatile exchange rate movements and supply disruptions. Domestic WPI headline inflation rebounded driven by food and fuel segments VI.4 Headline inflation in India, measured by year-on-year (y-o-y) changes in the wholesale price index (WPI), which had declined to a 42 month low of 4.6 per cent in May 2013 increased to 6.5 per cent (provisional) in September 2013 driven by a rebound in food and fuel prices (Chart VI.2). The average inflation during H1 of 2013-14 at 5.5 per cent, however, remained considerably lower than 7.7 per cent during the corresponding period of the previous year. VI.5 So far, the build-up of inflation during 2013-14 has been dominated by the food and fuel group which together contributed to about 87 per cent of the increase in the index during April-September 2013 (Chart VI.3). Vegetable price shock took food inflation to a three-year high VI.6 Food articles inflation was largely driven by significant increases in vegetable prices (Chart VI.4). Excluding vegetables, WPI inflation was at 4.7 per cent in September. High food inflation on account of a number of factors, including high input costs, rising wages and inelastic supply responses could have a destabilising impact on overall inflation expectations. VI.7 Despite a significant increase in the prices of primary food articles, inflation in manufactured food products declined to a low of 1.6 per cent in September 2013. This could be attributed to negative inflation in sugar and edible oils which together account for about half of the weight in the manufactured food products group. For over a year now, there has been a significant decline in global prices for both these products (Chart VI.5). The decline has been significant enough to exert a downward pressure on domestic prices despite depreciation of the rupee. Rupee depreciation pass-through and higher global crude prices pushed up fuel price inflation VI.8 Rupee depreciation and an increase in crude oil prices led to a rebound of fuel inflation to double-digit levels. Apart from the increase in prices of freely priced products, administered price revisions also contributed to an increase in fuel prices. However, the increase in administered prices did not keep pace with the rise in crude oil prices (in rupee terms) leading to greater suppressed inflation (Chart VI.6). The Indian basket’s crude oil prices in rupee terms reached a record high of `7,263 per barrel during the first fortnight of September 2013, which was about 35 per cent higher than the low levels recorded during the second fortnight of April 2013. Some decline in global crude prices in recent weeks as well as the reversal in the trend of rupee movement helped ease part of the pressure. The price of crude oil consequently declined to `6,544 per barrel as on October 24, 2013. Further hike in fuel prices needed; may help dampen demand VI.9 There have been concerted efforts to reduce the extent of suppressed inflation in the fuel segment. With the increase in fuel prices, there has been a significant slowdown in consumption in the recent period (Chart VI.7). Given the still large under-recoveries, there is need for further upward adjustment in fuel prices which would also dampen demand and restrain the twin deficits-fiscal and external. Such demand adjustments are also desirable for energy conservation and efficiency in the use of a scarce and costly resource. Inflation in non-food manufactured products continued to moderate amidst slack demand VI.10 Non-food manufactured products inflation at 2.1 per cent (y-o-y) in September 2013 continued to remain muted (Chart VI.8). Three product groups viz., of chemicals, metals and machinery and machine tools, which account for about 58 per cent of the non-food manufactured products group, exhibited significantly lower inflation as compared to the rest. Negative inflation in metals during the current financial year so far, which is in line with declining global metal prices, was one of the key factors pulling down overall inflation in this segment. VI.11 The slowdown in growth has led to a significant decline in pricing power as is evident from the trend available from purchasing manager index (PMI) (Chart VI.9). Though there was a pick-up in both input and output price indices in PMI in recent months, the gap between the two widened indicating that the firms are unable to pass on the full increase in input prices to output prices. Real rural wage growth moderated due to higher inflation VI.12 Though the growth in wages in rural areas declined in recent months, it continued to remain high in nominal terms and was in double-digits (Chart VI.10). High inflation, however, resulted in significant moderation of real wage growth. The level of real wages remained stagnant during the first eight months of calendar year 2013. Rising food prices caused persistent high CPI inflation VI.13 Though WPI inflation has moderated in 2013-14 so far, CPI inflation, as per the new CPI, continued to remain near double-digit levels driven by high food inflation (Chart VI.11). Given the higher weight of food in CPI as compared with WPI, the food group contributed significantly to overall CPI inflation and divergence between WPI and CPI inflation. The food group, which has a weight of 47.6 per cent in the new CPI (combined) contributed about 56 per cent of the inflation in September 2013. VI.14 Food prices increased at a faster rate in urban areas as compared to rural areas in recent months, driven largely by higher inflation in vegetables in urban areas (Chart VI.12). It is also seen that vegetable prices are more volatile in urban areas as compared to rural areas. While trade and transport costs could explain part of the divergence in inflation between rural and urban areas, such large swings in prices could also indicate that the supply chain is not efficiently integrated. VI.15 Excluding food and fuel, the new CPI inflation remained high at 8.6 per cent in September 2013 as compared to 2.3 per cent in WPI. The composition of the basket for excluding food and fuel differs significantly across CPI and WPI. CPI includes housing for which inflation is in double-digits. It also includes a miscellaneous group comprising of a number of services. The contribution of housing and transport communication has been significant in CPI-excluding food and fuel inflation (Chart VI.13). High inflation in transport and communication reflect pass-through of increase in fuel prices to transport costs. Persistent contribution from services, such as education and medical care, which are more labour-intensive, also indicate that sustained increases in wages (both in nominal and real terms) in the recent period fed into generalised inflation. This could partly explain the sticky inflation at the consumer level even in the midst of a growth slowdown. Risks to inflation largely in balance, though second-round effects may come into play VI.16 Risks to inflation ahead are largely in balance from here on, though second-round effects from already high food and fuel inflation in CPI inflation could continue. A good kharif crop could partly mitigate the pressure on food prices, both at the wholesale and retail levels. Still, upside risks remain from short-term domestic supply-side disturbances, the possibility of unforeseen global oil price spikes and possible adverse currency movements. |
പേജ് അവസാനം അപ്ഡേറ്റ് ചെയ്തത്:


