 IST,
IST,
VI. The External Economy
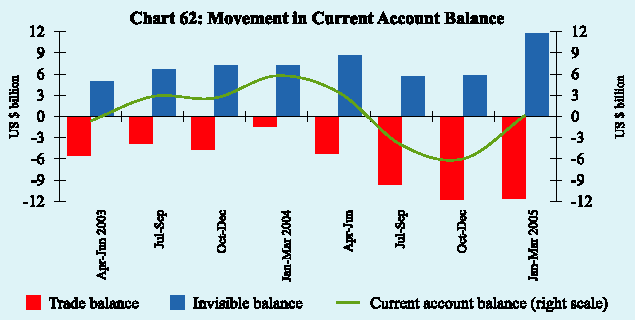
Provisional data on India’s balance of payments (BoP) relating to the quarter January-March 2005 and to the full financial year 2004-05 were released at the end of June, 2005 on the Reserve Bank’s website. These data pointed to significant developments in India’s external sector. First, notwithstanding a small surplus in January-March 2005, a current account deficit of a modest order reappeared in 2004-05, after a gap of three years, driven by a burgeoning merchandise trade deficit. Second, both merchandise exports and invisible earnings were buoyant but were outstripped by a massive expansion of imports, powered by soaring international crude prices as well as strong domestic demand. Third, within an upsurge of capital flows, debt flows have risen alongside foreign investment flows, but essentially for financing imports.
Available indicators suggest that these movements have strengthened in Q1of 2005-06. Merchandise export growth remained robust during the first quarter of 2005-06. Non-oil imports recorded a sharp increase indicative of rising investment demand in the economy. High and volatile international crude oil prices have translated into a large expansion in the POL import bill. These developments were reflected in near doubling of the trade deficit. In the capital account, foreign direct investment (FDI) flows picked up alongside various types of debt flows, while institutional portfolio flows significantly moderated in April-May, 2005 as in other emerging markets. India’s foreign exchange reserves at US $ 137.6 billion on July 15, 2005 were sufficient to finance about 14 months of imports.
International Developments
Global economic activity continued to slow down for the third consecutive quarter, reflecting weakening of activity in a number of advanced economies. According to The Economist, world GDP grew by 3.8 per cent during January-March 2005 as compared with 4.4 per cent in the previous quarter. Sustained domestic demand in the United States, albeit at a lower pace, continued to propel global activity. This was supported by strong growth in emerging Asia led by the Chinese economy, fuelled by fixed investment and external demand. The Japanese economy rebounded in the first quarter of 2005 mainly on account of private consumption and non-residential investment. On the other hand, growth faltered in much of the euro area as a result of weakening of consumption demand (Table 31).
|
Table 31: Growth Rates |
||||||
|
(Per cent) |
||||||
|
Country |
2004 |
2004-Q1 |
2004-Q2 |
2004-Q3 |
2004-Q4 |
2005-Q1 |
|
1 |
2 |
3 |
4 |
5 |
6 |
7 |
|
Advanced Economies |
||||||
|
US |
4.4 |
5.0 |
4.8 |
4.0 |
3.9 |
3.7 |
|
UK |
3.1 |
3.0 |
3.7 |
2.1 |
2.9 |
2.1 |
|
Euro Area |
2.1 |
1.4 |
2.5 |
1.8 |
1.6 |
1.3 |
|
Japan |
1.9 |
4.5 |
3.2 |
2.6 |
0.6 |
1.3 |
|
Emerging Economies |
||||||
|
China |
9.5 |
9.8 |
9.6 |
9.1 |
9.5 |
9.4 |
|
Malaysia |
7.1 |
7.6 |
8.0 |
6.8 |
5.6 |
5.7 |
|
Indonesia |
5.1 |
4.5 |
4.3 |
5.0 |
6.7 |
6.4 |
|
South Korea |
4.6 |
5.3 |
5.5 |
4.6 |
3.3 |
2.7 |
|
Thailand |
6.1 |
6.5 |
6.3 |
6.0 |
5.1 |
3.3 |
|
Brazil |
5.2 |
2.7 |
5.7 |
6.1 |
4.9 |
2.9 |
|
Argentina |
9.0 |
10.7 |
7.0 |
8.3 |
8.4 |
8.0 |
|
India |
6.9@ |
8.4 |
7.6 |
6.7 |
6.4 |
7.0 |
|
Memo : |
||||||
|
World GDP Growth* |
5.3 |
5.4 |
4.6 |
4.4 |
3.8 |
|
|
@ : FY 2004-05. |
||||||
Despite higher oil prices, inflationary pressures remain relatively contained globally, partly aided by the reversal of the accommodative monetary policy stances by a number of central banks. Less than full pass-through of high international oil prices to domestic oil prices in a number of emerging economies has also contributed to keeping inflation relatively low. Notwithstanding the measured increases in the targeted federal funds rate by the US Federal Reserve, long-term yields in major markets have remained surprisingly low during 2005 so far.
Balance of Payments: 2004-05
There were significant shifts in underlying constituents of balance of payments during 2004-05 (Table 32). Despite some moderation in merchandise
|
Table 32: India’s Balance of Payments |
||||||
|
(US $ million) |
||||||
|
Item |
Jan.-March |
April-June |
July-Sept. |
Oct.-Dec. |
Jan.-March |
2004-05 |
|
2004 |
2004 |
2004 |
2004 |
2005 |
(April-March) |
|
|
1 |
2 |
3 |
4 |
5 |
6 |
7 |
|
Exports |
20,329 |
17,840 |
18,875 |
20,888 |
23,228 |
80,832 |
|
Imports |
21,799 |
23,014 |
28,514 |
32,673 |
34,760 |
1,18,961 |
|
Trade Balance |
-1,470 |
-5,174 |
-9,639 |
-11,785 |
-11,532 |
-38,130 |
|
Invisibles, net |
7,225 |
8,564 |
5,138 |
6,304 |
11,691 |
31,699 |
|
Current Account |
5,755 |
3,390 |
-4,501 |
-5,481 |
159 |
-6,431 |
|
Capital Account* |
4,316 |
4,180 |
3,867 |
12,075 |
12,470 |
32,590 |
|
Change in Reserves# |
||||||
|
(- Indicates increase) |
-10,071 |
-7,570 |
634 |
-6,594 |
-12,629 |
-26,159 |
|
*: Including errors & omissions |
||||||
export growth during January-March 2005, India’s export growth at 24.9 per cent during 2004-05 remained above the annual target of 16 per cent set by the Government of India and was higher than that recorded during 2003-04.
Total import payments recorded a rise of 48.4 per cent during 2004-05, attributable to escalation in both oil and non-oil import payments. Non-oil import payment growth, led primarily by imports of capital goods and industrial inputs, was even higher at 49.5 per cent in 2004-05. Some moderation in growth of import payments in January-March 2005 in relation to the previous quarters restrained the trade deficit to the October-December 2004 level. Notwithstanding this, the trade deficit for the year as a whole reached a historic peak of US $ 38.1 billion amounting to 5.5 per cent of GDP, up from an average of a little below 3.0 per cent of GDP during 1990-2004.
Invisible receipts were at their intra-year peak during January-March 2005, driven primarily by remittances and business and professional services. During 2004-05, invisible receipts grew by 45.8 per cent due to significant growth in travel, transportation, software exports and other professional and business services. Travel receipts increased reflecting the impact of a rise of 25.0 per cent in international tourist traffic to India. Software exports at US $ 17.3 billion were up by 35.0 per cent in 2004-05. Private transfers, comprising primarily remittances from Indians working overseas, although lower than in 2003-04, were sizeable at US $ 20.8 billion in 2004-05 (Chart 61).
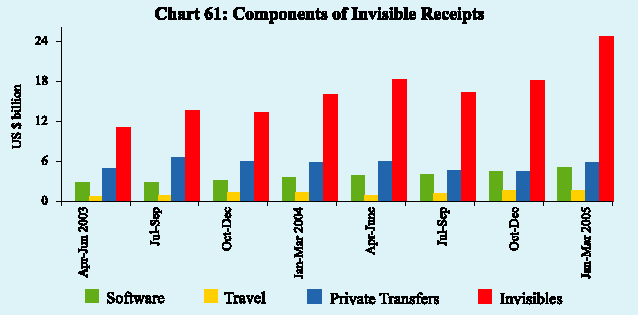
Total invisible payments grew sharply by 69.8 per cent in 2004-05 on account of a surge in outbound tourist traffic and in payments for transportation and business services (Table 33). Invisibles (net) at US $ 31.7 billion or 4.6 per cent of GDP financed the trade deficit to the extent of 83.0 per cent and contained the current account deficit at 0.9 per cent of GDP.
Net capital flows were buoyant, particularly during the second half of 2004-05, with total flows aggregating to US $ 32.2 billion for the year as a whole (Table 34). The year 2004-05 was marked by surge in both debt and non-debt flows. Net FDI into India increased in response to the favourable and liberalised investment climate while outward FDI surged as the liberalised investment regime spurred search for new markets, takeovers and natural resources.
|
Table 34: Net Capital Flows: 2004-05 |
||
|
(US $ million) |
||
|
Components |
April-March |
April-March |
|
2003-04 |
2004-05 |
|
|
1 |
2 |
3 |
|
Foreign Direct Investment |
3,420 |
3,037 |
|
Portfolio Investment |
11,356 |
8,907 |
|
External Assistance |
-2,742 |
1,922 |
|
External Commercial Borrowings |
-1,526 |
5,947 |
|
NRI Deposits |
3,642 |
-1,067 |
|
Other Banking Capital |
2,589 |
5,069 |
|
Short-term Credits |
1,420 |
3,792 |
|
Others |
2,383 |
4,568 |
|
Total |
20,542 |
32,175 |
|
Note :FDI consists of equity under Government (SIA/FIPB) and RBI routes, Portfolio investment consists of net inflow of funds on account of investment by FIIs and amount raised by Indian companies through ADRs/GDRs. |
||
FII inflows (net) amounted to US $ 8.3 billion in 2004-05 (US $ 10.9 billion in 2003-04), backed by positive growth outlook, improved corporate performance and attractive valuations. Notwithstanding this surge for the second year in succession, valuations of Indian stocks remain attractive vis-à-vis other EMEs (Table 35). NRI deposit outflows during the year were more than offset by banks’ overseas borrowings and use of nostro balances. With a surplus of US $ 12.6 billion in overall balance in January-March 2005, the total change in overall balance amounted to US $ 26.2 billion during 2004-05.
|
Table 35: Foreign Portfolio Investment Flows |
|||||
|
(US $ billion) |
|||||
|
Portfolio Inflows |
Price Earnings Ratio $ |
||||
|
(Per cent) |
|||||
|
Country |
2002 |
2003 |
2004 |
||
|
1 |
2 |
3 |
4 |
5 |
|
|
Chile |
1.0 |
2.1 |
1.1 |
16.6 |
|
|
Hong Kong |
-1.1 |
1.4 |
4.6 |
14.4 |
|
|
India |
1.1 |
8.2 |
8.8 |
13.5 |
|
|
Philippines |
1.6 |
0.9 |
1.9 |
18.5 |
|
|
South Korea |
5.4 |
2 2.7 |
19.0 |
14.0 |
|
|
Thailand |
-0.7 |
0.3 |
0.2 |
9.8 |
|
|
$ : March 2005. |
|||||
|
Note : Data for the Philippines for calendar year 2004 are up to September and |
|||||
External Sector Developments: Q , 2005-061
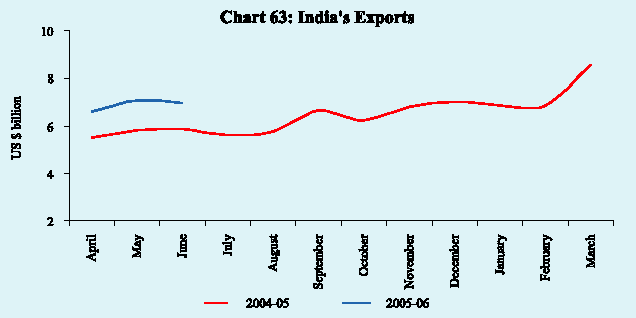
Merchandise export growth remained robust in Q1 of 2005-06. According to the Directorate General of Commercial Intelligence and Statistics (DGCI&S), exports registered a growth of 19.5 per cent during April-June 2005 on top of 34.0 per cent during the comparable period of the previous year (Chart 63).
Commodity-wise data for April 2005 show that the export performance was broad-based. Primary product exports – including tea, coffee, rice and cashew –maintained positive growth, with ores and minerals exports posting a 30.3 per cent growth in April 2005 on top of the 119.8 per cent jump a year ago, reflecting strong external demand (Chart 64). Engineering goods (40.4 per cent) and
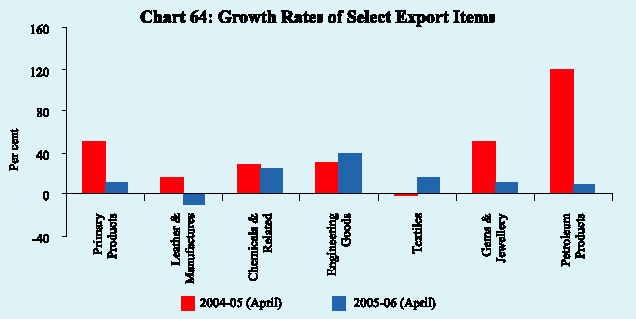
chemicals (25.5 per cent) remain key drivers of export growth in the manufacturing segment. In contrast to the decline recorded in the previous year, textiles recorded a positive growth in April 2005 with the pick up in ready-made garments benefiting from the phasing out of the Multi-Fibre Agreement. Exports of gems and jewellery and petroleum products slowed, attributable to the high base in the previous year.
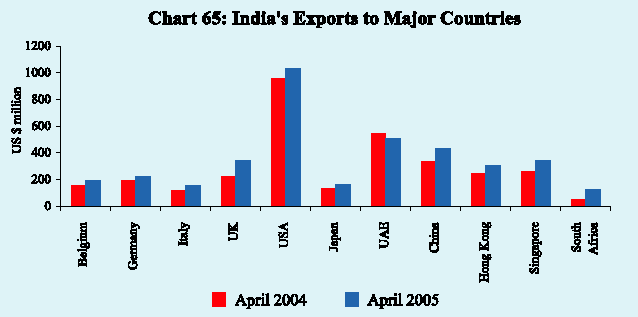
Destination-wise, Africa was the fastest growing region for India’s exports followed by Latin America, Europe, and East Asia during April 2005. France, Belgium, United Kingdom, China, Singapore, Korea, and Hong Kong remained the major markets for India’s exports (Chart 65).
Imports at US $ 32.4 billion increased by 38.0 per cent during April-June 2005, driven up by oil as well as non-oil imports. POL imports increased by 33.2 per cent in April-June 2005, reflecting the further hardening of international crude oil prices. The average crude oil price (Indian basket) firmed up to US $ 52.2 per barrel by end-June 2005 from about US $ 39 per barrel during 2004-05. In volume terms, oil imports increased by 10.0 per cent during April 2005 as against a decline (-3.5 per cent) in April 2004.
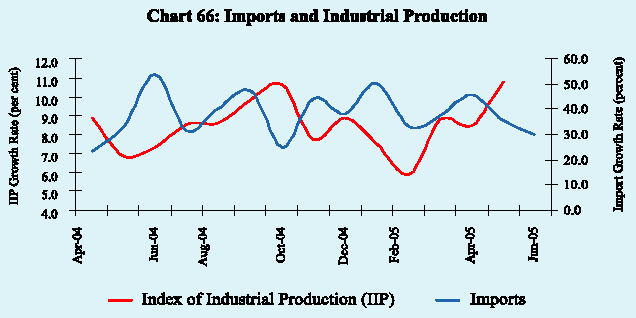
Non-oil imports maintained high growth of 40.2 per cent during April-June 2005 (28.8 per cent previous year) due to sustained industrial demand (Chart 66). Non-oil imports excluding gold and silver increased sharply by 62 per cent during April 2005 as compared with 8.1 per cent growth in April 2004. Imports of mainly industrial inputs (non-oil imports net of gold and silver, bulk consumption, manufactured fertilisers and professional instruments) increased
In view of the sharp increase in imports, the trade deficit nearly doubled to US $ 11.5 billion during April-June 2005 from US $ 6.0 billion in April-June 2004 (Table 36).
|
Table 36: India’s Merchandise Trade |
|||
|
(US $ million) |
|||
|
Item |
2004-05 |
2004-05 |
2005-06 |
|
(April-June) |
|||
|
1 |
2 |
3 |
4 |
|
Exports |
79,247 |
17,483 |
20,900 |
|
(24.1) |
(34.0) |
(19.5) |
|
|
Imports |
1,07,066 |
23,446 |
32,360 |
|
(37.0) |
(36.4) |
(38.0) |
|
|
Oil |
29,844 |
7,208 |
9,598 |
|
(45.1) |
(57.5) |
(33.2) |
|
|
Non-Oil |
77,222 |
16,238 |
22,762 |
|
(34.1) |
(28.8) |
(40.2) |
|
|
Trade Balance |
-27,819 |
-5,962 |
-11,460 |
|
Figures in parentheses show percentage change over the |
|||
Capital flows to India remained steady during Q1 of 2005-06, despite subdued FII activity in the major part of the quarter. A surge in foreign direct investment into India, which more than doubled during 2005-06 from the level a year ago, dominated capital flows in Q1 . Industry-wise classification reveals that FDI inflows were concentrated mainly in cement, sugar, plastic, synthetic and rubber industries and hotels. Mauritius and the US continued to remain the dominant sources of FDI to India.
Although FII activity remained subdued in the first two months of Q1 , there was a resumption of interest in the Indian stocks in June with a net inflow of US $ 1.2 billion. With a series of India-centric funds being floated overseas, FII inflows are likely to remain robust in the near term. The number of FIIs registered with the SEBI increased from 658 at end-March 2005 to 731 by end-June 2005 with the registration of FIIs from Australia, Austria, Canada, Denmark, Ireland, Italy, Sweden and Taiwan, providing a diverse FII base for investment in India. American depository receipts (ADRs)/global depository receipts (GDRs) issuances remained buoyant during the first two months of Q1 as booming stocks are offering corporates the opportunity to issue equities abroad.
Net flows of external assistance in Q1 of 2005-06 were higher than in the corresponding quarter of 2004-05. External commercial borrowings (ECBs) approvals at US $ 1.3 billion in April-May, 2005 are indicative of plans by Indian corporates for significant recourse to ECBs in 2005-06 in the upturn of the investment cycle. Indian corporates of diversified size indicated a preference for foreign currency convertible bonds (FCCBs) as these bond issuances are attractive due to lower spreads and conversion reduces the debt-servicing burden.
Non-Resident Indian deposit accounts recorded net outflows during the first two months of 2005-06. Non-Resident (External) Rupee Account [NR(E)RA] scheme continued to record net inflows in April-May 2005 responding to the revision in interest rates on NRE deposits to LIBOR/SWAP rates of US dollar plus 50 basis points on October 26, 2004 (Table 37).
|
Table 37: Net Capital Flows |
|||
|
(US $ million) |
|||
|
Item |
Period |
2004-05 |
2005-06 |
|
1 |
2 |
3 |
4 |
|
Foreign Direct Investment |
April-May |
434 |
922 |
|
FII Investment |
April-June |
-88 |
435 |
|
ADRs/GDRs |
April-May |
170 |
360 |
|
External Assistance, Net |
April-June |
72 |
180 |
|
NRI Deposits |
April-May |
-397 |
-62 |
|
ECBs (Approvals) |
April-May |
1,910 |
1,266 |
Foreign Exchange Reserves
During Q1 of 2005-06, the surplus in the invisible account and net capital flows
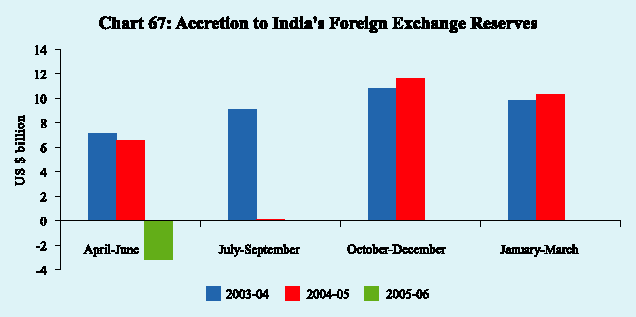
In terms of trade-related reserve adequacy indicators, at end-March 2005, India’s foreign exchange reserves at about 14.3 months of imports were higher than those of several other EMEs in Asia (Table 38). India’s ratio of reserves to
|
Table 38: Reserve Adequacy Indicators |
||||
|
(Per cent) |
||||
|
Criterion |
India |
Korea |
Singapore |
Hong Kong |
|
1 |
2 |
3 |
4 |
5 |
|
Trade-related Indicators |
||||
|
Import cover (months) |
14.3 |
10.9 |
8.0 |
5.5 |
|
Current payment cover (months) |
10.3 |
8.2 |
6.1 |
4.3 |
|
Debt-related Indicators |
||||
|
Reserves to external debt |
114.8 |
111.8 |
51.2 ++ |
28.5 |
|
Reserves to short-term external debt |
1880.8 |
229.6* |
68.8++ |
40.5 |
|
Reserves to total external liabilities |
76.7 + |
45.2@ |
24.9 |
13.0 |
|
Money-based Indicators |
||||
|
Reserves to broad money |
27.3 |
21.8 |
86.9 |
28.0 |
|
Reserves to reserve money |
131.9 |
531.0 |
844.1 |
325.7 |
|
Macro Indicators |
||||
|
Reserves to GDP |
19.9 |
25.7@ |
105.6 |
75.0 |
|
@ : as at end December 2003. *: as at end March 2005. |
||||
short-term debt comfortably satisfies the adequacy criterion vis-à-vis other comparable countries. The level of reserves exceeds India’s overall external debt. In terms of total external liabilities, which include portfolio liabilities, India’s reserves are broadly adequate.
The overall approach to the management of India’s foreign exchange reserves in recent years reflects the changing composition of the balance of payments and the ‘liquidity risks’ associated with different types of flows and other requirements. The policy for reserve management is, thus, judiciously built upon a host of identifiable factors and other contingencies. Taking these factors into account, India’s foreign exchange reserves continued to be at a comfortable level and consistent with the rate of growth, the share of external sector in the economy and the size of risk-adjusted capital flows.
External Debt
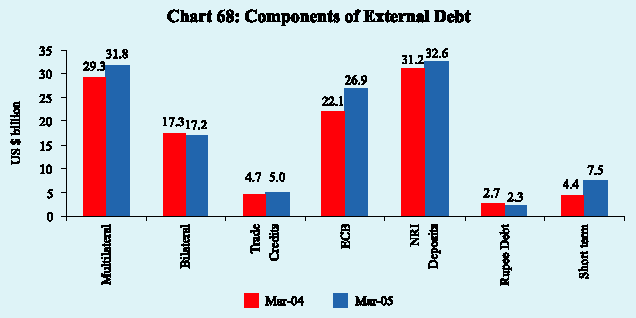
India’s total external debt was placed at US $ 123.3 billion at end March 2005. In nominal terms, the external debt stock increased by US $ 11.6 billion (10.4 per cent) during 2004-05 - the highest accretion in any single year starting from 1990-91. This was driven by ECBs, trade credits (short-term and long-term), multilateral debt and NRI deposits (Chart 68). Short-term debt recorded the highest growth (69.8 per cent) during the year reflecting a sharp rise in both POL and non-POL imports. The US dollar continued to dominate the currency composition of India’s external debt.
|
Table 39: Indicators of Debt Sustainability – end-March |
||
|
(Per cent) |
||
|
Indicator |
2004 |
2005 |
|
1 |
2 |
3 |
|
Concessional debt/Total debt |
36.1 |
33.5 |
|
Short-term/Total debt |
4.0 |
6.1 |
|
Short-term debt/Reserves |
3.9 |
5.3 |
|
Reserves/ Total debt |
101.1 |
114.8 |
|
External Debt / GDP |
17.8 |
17.4 |
foreign exchange reserves exceeded the external debt by US $ 18.2 billion providing a cover of 114.8 per cent to the external debt stock at the end of March 2005. India was the eighth largest debtor country in 2003; however, among the top 20 debtor countries, India had the lowest debt-GDP ratio, next only to China. The short-term debt to total external debt ratio was also among the lowest for India and was placed at 6.1 per cent at March 2005 as against an average of 14.5 per cent for the developing countries as a group.
Reform of China's Exchange Rate Regime
A public announcement issued by the People's Bank of China (PBC) on July 21, 2005 has stated: 'Starting from July 21, 2005, China will reform the exchange rate regime by moving into a managed floating exchange rate regime based on market supply and demand with reference to a basket of currencies. RMB will no longer be pegged to the US dollar and the RMB exchange rate regime will be improved with greater flexibility.' The announcement also specifies: 'The People's Bank of China will announce the closing price of a foreign currency such as the US dollar traded against the RMB in the inter-bank foreign exchange market after the closing of the market on each working day, and will make it the central parity for the trading against the RMB on the following working day… within a band of ±0.3 percent.' Towards this end, the exchange rate of RMB was adjusted to 8.11 yuan per US dollar on July 21, 2005. It may be noted that prior to this development, RMB was pegged at 8.2765 yuan per US dollar and, thus, the revaluation works out to be around 2.1 per cent.
It is envisaged that the RMB exchange rate will be more flexible based on market condition. The PBC has indicated that it would be 'maintaining the RMB exchange rate basically stable at an adaptive and equilibrium level, so as to promote the basic equilibrium of the balance of payments and safeguard macroeconomic and financial stability.'
The initial reaction of the markets has been reflected in the yuan gaining against the US dollar and the yen firming up against the other major currencies
In a statement issued soon after the announcement by the PBC, Bank Negara Malaysia announced that it will no longer peg its currency to the US dollar and let it float instead, in a tight band against a basket of foreign currencies. The Malaysian Central Bank has also stated that it will monitor the ringgit exchange rate against a currency basket.
In recent years, China has emerged as an important trading partner for India. Trade between the two countries has increased significantly, especially after the signing of the Bilateral Agreement in February 2000. In 2004-05, the total trade turnover between the two nations amounted to US $ 11.3 billion, with a surplus of US $ 2.2 billion in favour of China. Bilateral trade between India and China increased by 63 per cent in the first quarter of 2005-06. India's exports to China have been rising at an annual average rate of 52 per cent during 2000-05. In fact, China's share in India's exports has gone up from 0.1 per cent in the early 1990s to 6.1 per cent in 2004-05. China has turned out to be the largest source of India's imports, surpassing the US. It is envisaged that the bilateral trade target of US $ 20 billion set for 2008 would be achieved well-ahead of schedule and both countries have evinced interest in closer bilateral trade agreements.
The Reserve Bank of India has noted this important development relating to the reform of China's exchange rate regime and has reiterated the continuation of its current exchange rate policy which has been enunciated in the Annual Policy Statement for the year 2005-06:
'The exchange rate policy in recent years has been guided by the broad principles of careful monitoring and management of exchange rates with flexibility, without a fixed target or a pre-announced target or a band, coupled with the ability to intervene if and when necessary. The overall approach to the management of India's foreign exchange reserves takes into account the changing composition of the balance of payments and endeavours to reflect 'liquidity risks' associated with different types of flows and other requirements'.
പേജ് അവസാനം അപ്ഡേറ്റ് ചെയ്തത്:


