 IST,
IST,


VI. The External Economy
|
India’s external sector has continued to register robust performance during 2006-07 so far. Merchandise exports have exhibited strong growth, notwithstanding some deceleration. Non-oil imports recorded a deceleration mainly on account of decline in imports of gold and silver, and pearls, precious and semi-precious stones; imports of capital goods, however, remained buoyant. Growth in oil imports remained high, albeit lower than last year. Sustained growth in exports of services and remittances continued to provide buoyancy to the surplus in the invisibles account, which enabled financing a large part of the deficit on the merchandise trade account. Although, the current account deficit widened in the wake of higher oil imports, it was easily financed by normal capital flows. Foreign exchange reserves have increased by US $ 26.5 billion during 2006-07 (up to January 19, 2007). International Developments The global economy continued to expand at a robust pace in the third quarter of 2006, albeit with some moderation in the growth momentum (Table 43). Real GDP growth in the US slowed further in the third quarter, primarily on the back of drop in residential investment, acceleration in imports and deceleration in consumer spending for services. The Japanese economy also witnessed a deceleration in growth in the third quarter, attributable to a fall in domestic demand. Economic activity in the euro area, on the other hand,
Continued to expand, led by strong domestic demand. Amongst emerging economies, economic activity in China continued to exhibit double-digit growth in the third quarter of 2006, though with some moderation from the pace recorded in the first half of 2006. According to the International Monetary Fund (IMF), global economic activity will remain buoyant in 2007, led by emerging economies. In terms of exchange rates based on purchasing power parities, global economy will expand by 4.9 per cent in 2007, marginally lower than that of 5.1 per cent in 2006 (Table 44). Growth prospects, however, remain subject to downside risks from uncertainties regarding the persistent global macroeconomic imbalances, the underlying inflationary pressures on account of limited spare capacity, emerging wage pressures, possibility of renewed rise in crude oil prices and possibility of re-pricing of risks in global financial markets. Global trade exhibited a modest deceleration during 2006, mainly on account of slowdown in developing countries (Table 45). World exports in US dollar terms grew by 14.1 per cent in the first nine months of 2006 as compared
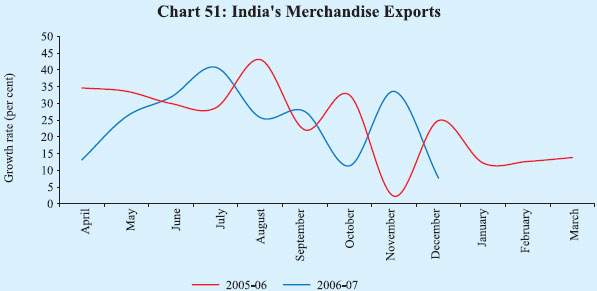
with 15.5 per cent in the corresponding period of 2005. Exports of industrial countries, on the other hand, accelerated, led by the US. Merchandise Trade According to the provisional data released by the Directorate General of Commercial Intelligence and Statistics (DGCI&S), India’s exports recorded a growth of 22 per cent during April-December 2006 as compared with 30 per cent registered a year ago (Chart 51).
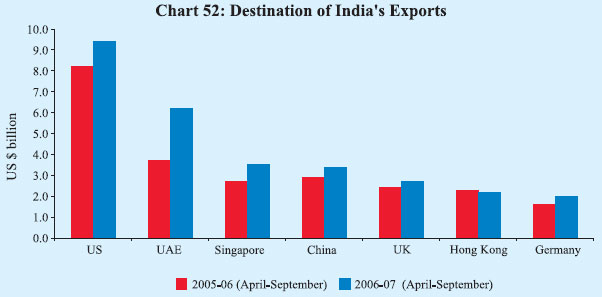
Commodity-wise data available for April-September 2006 reveal that exports of all major groups, with the exception of petroleum products and engineering goods, recorded deceleration (Table 46). Exports of petroleum products registered substantial growth reflecting the increase in both price and quantity. In volume terms, exports of petroleum products increased by 60 per cent during April-September 2006. The deceleration in primary products was mainly due to decline in exports of iron ore. However, exports of agriculture and allied products maintained the growth momentum on the back of large increase in exports of raw cotton and sugar. Among the traditional agricultural products, exports of tea, coffee, tobacco, spices and oil meals recorded a strong growth, while that of rice, wheat, cashew and marine products posted a decline/ low growth. Within manufactured products, exports of engineering goods, basic chemicals and pharmaceuticals maintained their growth momentum. On the other hand, exports of gems and jewellery and handicrafts recorded a decline while those of ‘leather and manufactures’ and textiles exhibited a deceleration. Destination-wise, the US was the largest export market for India during April-September 2006 with a share of 15.3 per cent in India’s total exports followed by the UAE (10.1 per cent) and Singapore (5.8 per cent) (Chart 52). Amongst major markets, India’s exports to the Organisation of Petroleum Exporting Countries (OPEC) recorded a growth of 56 per cent with exports to the UAE growing by 65 per cent. Exports to the US, Singapore, Germany, UK and China recorded a deceleration, while exports to Hong Kong declined.
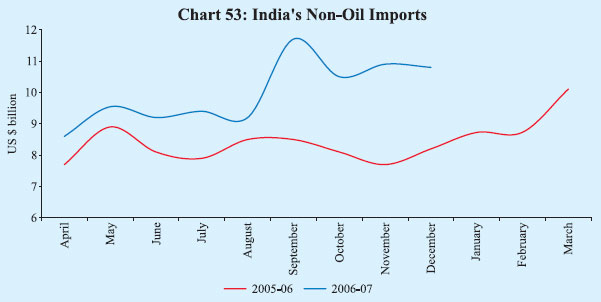
Growth in India’s merchandise imports decelerated during April-December 2006 to 25 per cent from 38 per cent a year ago. Imports of petroleum, oil and lubricants (POL) increased by 39 per cent during April-December 2006, reflecting both higher prices and volumes. In volume terms, oil imports increased by 18 per cent during April-September 2006 as against a decline of 0.4 per cent a year ago. Non-oil imports, after remaining subdued in the beginning of current fiscal year, have picked up since September 2006 (Chart 53). Nonetheless, the overall growth in non-oil imports at 19 per cent during April-December 2006 was substantially lower than that of 34 per cent
recorded during the corresponding period of the previous year, mainly reflecting the decline in the imports of gold and silver, and pearls, precious and semiprecious stones (Table 47). Imports of capital goods remained buoyant, posting a growth of 39 per cent during April-September 2006 on top of 48 per cent in the corresponding period of 2005 in consonance with strong investment activity in the economy. Country-wise, China was the largest source for India’s imports during April-September 2006 with a share of 9.2 per cent in India’s total imports, followed by Saudi Arabia (8.2 per cent), the US (5.8 per cent) and the UAE (5.1 per cent). Region-wise, developing countries (including OPEC) accounted for 66 per cent of India’s imports; OPEC countries alone accounted for 33 per cent of India’s total imports during April-September 2006. The trade deficit widened to US $ 41.6 billion during April-December 2006 from US $ 31.7 billion a year ago (Table 48). The trade deficit on the oil account increased by US $ 3.7 billion during April-September 2006, while the non-oil trade deficit declined by US $ 0.3 billion.
Current Account Earnings from exports of services and inflows under remittances remained buoyant during the second quarter (July-September) of 2006-07. Amongst major services, net surplus under software services amounted to US $ 6.1 billion during the quarter ended September 2006, an increase of 23 per cent from a year ago (Table 49). Private transfers at US $ 5.5 billion during
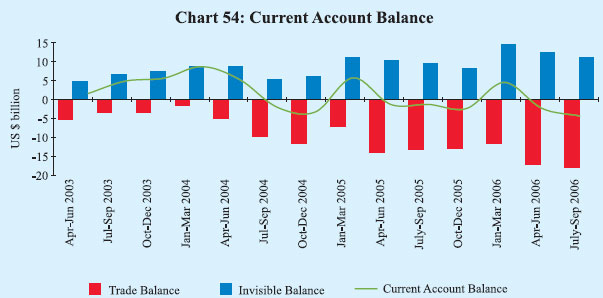
July-September 2006 were nine per cent higher than a year ago. Investment income deficit narrowed from a year ago, on account of higher earnings on India’s external assets. On balance, the net surplus under invisibles (services, transfers and income taken together) increased from US $ 9.6 billion during July-September 2005 to US $ 11.0 billion during July-September 2006. The cumulative surplus increased to US $ 23.5 billion during the first half of 2006-07 from US $ 19.9 billion a year ago. The net invisible surplus financed 61 per cent of the merchandise trade deficit during July-September 2006. However, in view of the large expansion in the merchandise trade deficit, the current account deficit widened to US $ 6.9 billion from US $ 3.6 billion a year ago. The current account deficit during the first half of 2006-07 (April-September 2006) at US $ 11.7 billion was also higher than that of US $ 7.2 billion a year ago (Table 50 and Chart 54).
Capital Flows Capital flows, both debt and non-debt, during 2006-07 so far have been higher than a year ago, reflecting growing investor interest in the Indian economy on the back of strong growth prospects and buoyant investment demand. Within non-debt flows, foreign direct investment (FDI) inflows at US $ 8.6 billion during April-November 2006 were almost twice the inflows in the corresponding period of the previous year (Table 51). FDI was channelled mainly into financial services, manufacturing, banking services, information technology services and construction. Mauritius, the US and Singapore remain the dominant sources of FDI to India. As regards portfolio equity flows, foreign institutional investors (FIIs) made large purchases in the Indian stock market during August-November
2006, more than offsetting the outflows witnessed during May-July 2006. During December 2006, however, FIIs registered outflows against the backdrop of volatility in Asian equity markets subsequent to the tightening of capital controls by Thailand. On the whole, net FII inflows during 2006-07 so far (up to January 12, 2007) amounted to US $ 2.5 billion. Resources mobilised through the issuances of American depository receipts (ADRs)/global depository receipts (GDRs) abroad were also higher during April-November 2006. Amongst debt flows, demand for external commercial borrowings (ECBs) continued to remain strong in consonance with buoyant domestic investment activity. Net inflows under various NRI deposits during April-November 2006 were substantially higher than a year ago, partly attributable to higher interest rates on various deposit schemes. The ceiling interest rate on NRE deposits was raised by 25 basis points each in November 2005 and April 2006 to “LIBOR/SWAP rates of US dollar plus 100 basis points”. The ceiling interest rate on FCNR(B) deposits was also raised by 25 basis points to “LIBOR/SWAP rates for the respective currency/ maturity” in March 2006 from “LIBOR/ SWAP rates minus 25 basis points”. Foreign Exchange Reserves India’s foreign exchange reserves have increased by US $ 26.5 billion during 2006-07 so far (up to January 19, 2007) to US $ 178.1 billion, mainly due to an increase in foreign currency assets (Table 52). India holds the fifth largest stock of reserves among the emerging market economies. The overall approach to the
management of India’s foreign exchange reserves in recent years reflects the changing composition of the balance of payments and the ‘liquidity risks’ associated with different types of flows and other requirements. Taking these factors into account, India’s foreign exchange reserves continued to be at a comfortable level and consistent with the rate of growth, the share of external sector in the economy and the size of risk-adjusted capital flows. External Debt India’s total external debt was placed at US $ 136.5 billion at end-September 2006, an increase of US $ 4.3 billion over end-June 2006. The increase during the quarter was mainly on account of higher external commercial borrowings, NRI deposits and short-term trade credits. Higher commercial borrowings and short-term credits could be attributed to increased investment and import demand, while the rise in NRI deposits was, inter alia, on account of the upward revision in interest rates on these deposits. Sustainability indicators such as the ratio of short-term to total debt and short-term debt to reserves recorded a modest rise during the quarter but are still placed at quite low and comfortable levels (Table 53). Foreign exchange reserves remain in excess of the stock of external debt.
|
|||||||||||||||||||||||||||||||||||||||||||||||||||||||||||||||||||||||||||||||||||||||||||||||||||||||||||||||||||||||||||||||||||||||||||||||||||||||||||||||||||||||||||||||||||||||||||||||||||||||||||||||||||||||||||||||||||||||||||||||||||||||||||||||||||||||||||||||||||||||||||||||||||||||||||||||||||||||||||||||||||||||||||||||||||||||||||||||||||||||||||||||||||||||||||||||||||||||||||||||||||||||||||||||||||||||||||||||||||||||||||||||||||||||||||||||||||||||||||||||||||||||||||||||||||||||||||||||||||||||||||||||||||||||||||||||||||||||||||||||||||||||||||||||||||||||||||||||||||||||||||||||||||||||||||||||||||||||||||||||||||||||||||||||||||||||||||||||||||||||||||||||||||||||||||||||||||||||||||||||||||||||||||||||||||||||||||||||||||||||||||||||||||||||||||||||||||||||||||||||||||||||||||||||||||||||||||||||||||||||||||||||||||||||||||||||||||||||||||||||||||||||||||||||||||||||||||||||||||||||||||||||||||||||||||||||||||||||||||||||||||||||||||||||||||||||||||||||||||||||

ഈ പേജ് ഷെയർ ചെയ്യുക:


റിസർവ് ബാങ്ക് ഓഫ് ഇന്ത്യ മൊബൈൽ ആപ്ലിക്കേഷൻ ഇൻസ്റ്റാൾ ചെയ്ത് ഏറ്റവും പുതിയ വാർത്തകളിലേക്ക് വേഗത്തിലുള്ള ആക്സസ് നേടുക!
ഞങ്ങളുടെ ആപ്പ് ഇൻസ്റ്റാൾ ചെയ്യാൻ QR കോഡ് സ്കാൻ ചെയ്യുക


പേജ് അവസാനം അപ്ഡേറ്റ് ചെയ്തത്:


