 IST,
IST,


Economic and Financial Developments in Uttarakhand
Shri Deepak Mohanty, Executive Director, Reserve Bank of India
delivered-on ഓഗ 31, 2012
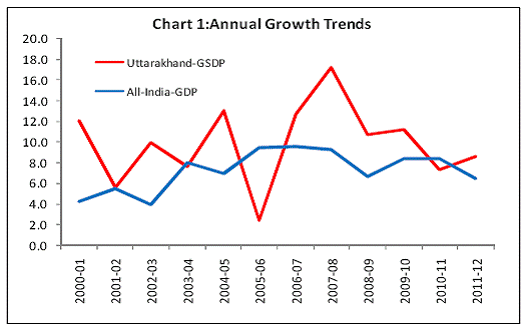
I thank Professor Murthy for inviting me to share my thoughts with a young audience in an institution which has a formidable reputation in agricultural research as having pioneered the “Green Revolution”. In my talk today, I propose to briefly outline the economic and financial structure of the State as well as highlight various financial inclusion initiatives taken by the Reserve Bank. I will then indicate a few policy challenges in sustaining the growth momentum. I conclude with some thoughts on the agricultural economy. I will trace the economic development starting from the early 2000s mainly because Uttarakhand was instituted in 2000 as the 27th State of the Republic of India. The State known as the abode of gods is truly a paradise for nature lovers and adventure sports endowed with the natural bounty of glaciers, rivers and forests. It is one of the thinly populated States accounting for 1.6 per cent of the total geographical area of the country and 0.8 per cent of the national population. Located in the foothills of the Himalayas, Uttarakhand’s terrain and agro-climatic conditions obviously provide unique challenges as well as opportunities for growth and development. Macroeconomic Trends In the 2000s, the Indian economy witnessed acceleration in economic growth. It is noteworthy that the State registered even higher growth thus emerging as one of the fastest growing states in India (Chart 1).
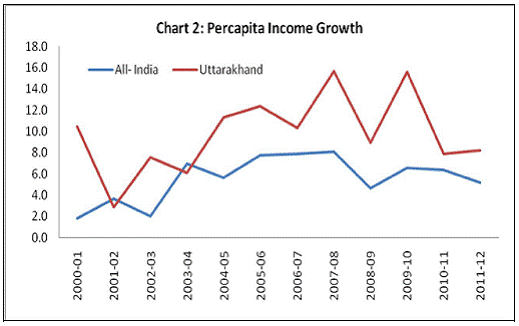
The growth acceleration in the State was also reflected in the per capita income which increased by 168 per cent from `19,457 in 2001-02 to `52,125 by 2011-12. The increase in the State per capita income was much sharper as compared to the all- India per capita income which increased by 81 per cent from `20,943 to `37,851 during the same period (Chart 2). This enabled the State to significantly improve its rank among the 28 states from 17th to 10th during the same period.
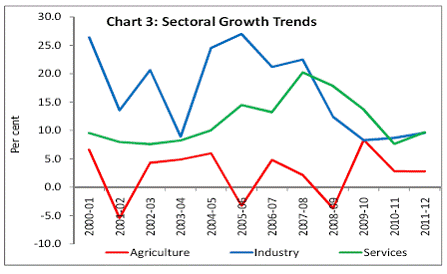
The growth impulses in the initial phase during 2001-08 emanated mainly from industry and services. In the latter phase of 2009-12, growth was driven by the services sector. However, in both the phases agricultural growth remained low and volatile (Chart 3).
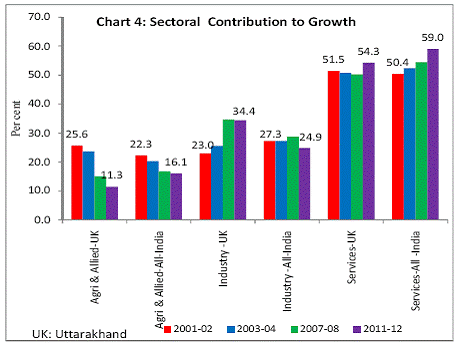
Reflecting the divergence in sectoral growth trends, the contribution of agriculture to the gross state domestic product (GSDP) declined while that of industry and services sectors rose (Chart 4). It is noteworthy that the growth of industrial sector in the State has been significant despite the constraints of the terrain and topography.
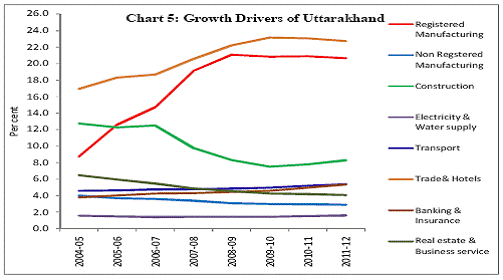
An analysis of the trends at a more disaggregate level suggests that growth was led by manufacturing, construction and trade & hotels (Chart 5).
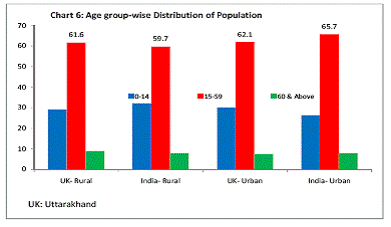
The composition of the labour force mirrored the composition of GSDP. The share of employment in agriculture at 33 per cent remained significantly lower than the national average of around 52 per cent. The share of construction, trade and manufacturing in the labour force remained higher compared to the national average (Table 1). However, labour force participation rate at around 47 per cent in 2010-11 was lower than the labour participation rate of 53 per cent at the national level indicating higher level of unemployment in the State. Socio-economic Indicators The State has the potential to achieve faster growth by harnessing the large proportion of working age population by encouraging quality vocational and professional education (Chart 6).
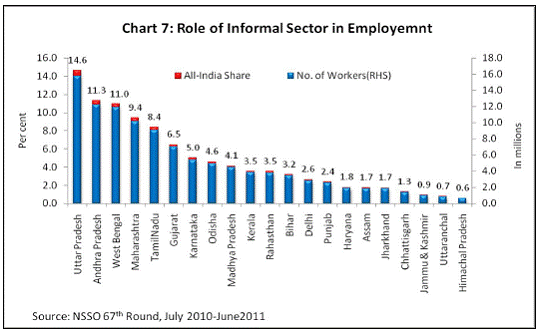
The share of informal sector in employment generation in the State is very minimal as compared with other states (Chart 7). Hence, the development of the informal sector is important as it could help harness the demographic dividend bestowed on the State. The informal sector can also play a significant role in improving credit absorption.
The standards of life indicators for the State compare favourably with the national average. The share of households having access to basic civic amenities such as safe drinking water and electricity was relatively high compared to the national average. Similarly ownership of household assets such as television, telephone and mechanised personal transport was higher than the national average. The population of households having banking facility was also higher than the national average (Table 2).
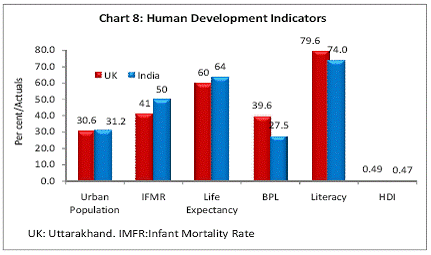
Notwithstanding the economic growth and better access to amenities, the State lags behind in certain human development aspects. Despite high literacy and high per capita income, there is high incidence of poverty and life expectancy rate is lower as compared with the national average. The State ranked 14 among the 23 States1 in terms of Human Development Index 2007-08 (Chart 8).
Fiscal Trends The State has initiated various fiscal reforms which include implementation of VAT, enactment of fiscal responsibility legislation, introduction of a new pension scheme, imposition of ceiling on guarantees and constitution of consolidated sinking fund and guarantee redemption fund. Under the rule based fiscal framework, fiscal position of the State witnessed improvement and the State achieved revenue surplus in 2006-07. Gross fiscal deficit as a ratio to GSDP also declined to 2.4 per cent in 2006-07. However, declining trend in revenue receipts coupled with increase in expenditure turned revenue account into deficit during 2009-10. With the improvement in overall macroeconomic conditions, the State has resumed the process of fiscal correction. While revenue account turned surplus during 2011-12 (RE), GFD-GSDP ratio has increased due to higher capital outlay (Table 3).
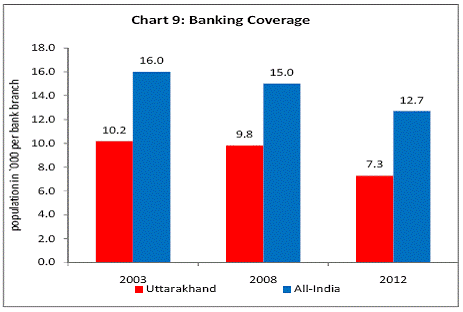
Financial Indicators The level of financial development is critical for driving higher economic growth.The formal financial system in India is dominated by banks and same is the case with Uttarakhand. The average population per bank branch in the State was favourable at 7,300 in March 2012 as compared to all-India average of 12,700.Though the banking penetration is relatively high compared to all- India, there is considerable scope for increasing coverage given the dispersed nature of villages (Chart 9).
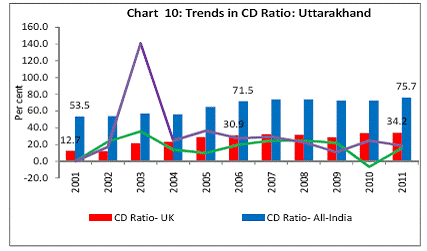
The credit deposit (C-D) ratio of the State at 34.2 per cent in December 2011was significantly lower than the C-D ratio at the all-India level of 75.7 per cent. Though the C-D Ratio of the State has shown signs of improvement in recent years, it still significantly lags behind the all-India average underscoring the scope for further credit penetration (Chart 10).
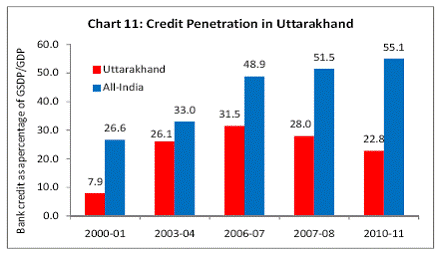
Another measure of credit intensity is the ratio of bank credit to the GSDP which is low in the State compared to all-India level indicating the need for further credit expansion (Chart 11).
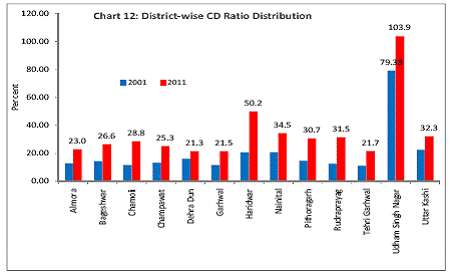
Not only is the overall C-D ratio low but also there is considerable variability across districts (Chart 12). The wide disparities in the distribution of credit indicate that greater attention is needed to enhance availability of financial services in the hill regions of the State.
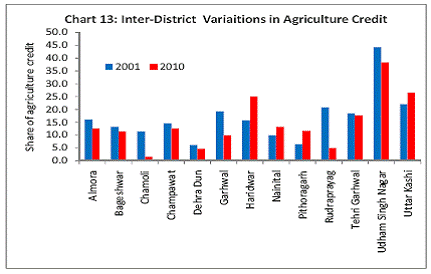
At the disaggregated activity level, the share of agricultural credit was relatively low with considerable inter-district variability (Chart 13). Agriculture being the main livelihood for the hill districts, the uneven distribution of credit across the districts is not conducive to inclusive growth.
Financial Inclusion Against this background, let me now turn to the financial inclusion strategy of the Reserve Bank and what are the specific steps taken for Uttarakhand? It is important to bring the poor and under-privileged sections of the society within the banking fold for inclusive growth. In this context, our recent financial inclusion drive has four key elements. First, provision of a set of basic financial products and services for the vulnerable and financially excluded sections. This includes a savings cum overdraft product in the form of no-frills account, and entrepreneurial credit in the form of Kisan Credit Card (KCC)/General Credit Card (GCC) (Table 4). Second, spread of financial literacy across all sections of the society by creating awareness about financial products and services among the population. Third, greater regulatory incentives through liberalisation of interest rates and branch licensing. Banks have been given complete freedom to price their advances so that lending in the rural areas could be a commercial proposition. Given the lower penetration of formal credit and recourse to money lenders what matters is the availability of credit rather than the cost. Banks have also been given the freedom to open branches in centres with population of less than 1,00,000. Fourth, use of technology and innovative delivery models so that the cost for providing large quantum of small-ticket transactions could be brought down. This initiative included putting in place a system of Business Correspondent (BC) Model to provide door-step delivery of financial products and services by authorized agents of banks; and Electronic Benefit Transfer (EBT) for routing of payments of the central and state government welfare schemes like social security pensions, Mahatma Gandhi National Rural Employment Guarantee Scheme (MNREGS), National Old Age Pension Scheme (NOAPS) directly to the bank accounts of the beneficiaries. In this direction, the effort so far has been to make basic banking facility available to all villages with a population of over 2,000 by end-March 2012. The progress in banking coverage over the last two years has indeed been substantial. The next step is to provide banking facilities with population below 2000. State Level Bankers Committees (SLBCs) are preparing roadmaps for banking facilities in these villages in a time bound manner. For meaningful financial inclusion, it is envisaged that banks would set up brick and mortar branches in a cluster of 8–10 BC units in a reasonable distance of 3–4 kilometers.
Financial Inclusion in Uttarakhand Banks in Uttarakhand have made provision for banking facilities in 226 identified villages having population of more than 2000 by March 2012. Of these, 18 villages are covered through bricks and mortar branches, 198 villages through appointment of BCs and 10 through kiosks. Furthermore, the State Government has identified 259 clusters of small villages as Nyaypanchayats, of which 108 were provided with banking facilities and the rest 151 will be covered during 2012-13. Further, 743 villages with the population between 1000 and 2000 have been identified for provision banking facilities in 2012-13. By June 2012,8.6 lakh no-frill accounts were opened. During 2011-12, 1.2 lakh KCCs and 1200 GCCs were issued and 2600 SHGs were formed. Out of the 13 districts 10 have FLCCs. In addition, the Reserve Bank has initiated a campaign of financial inclusion through outreach programmes by the executives of the Bank to have grassroots level understanding of accessibility of financial services and to promote financial inclusion. I will be visiting Mayarampurnear Nanitaltomorrow for the outreach programme. Policy Challenges Let me now turn to a few broader macroeconomic policy challenges for the development planning in the State. First, there is a need to promote diversification in agriculture consistent with the agro-climatic conditions. It will help to address regional disparity and facilitate poverty alleviation. Agricultural growth needs to be supported by adequate storage, warehousing and marketing facilities which will generate employment in the informal sector. Second, initiatives need to be taken to promote sustainable industrial development compatible with the unique bio-diversity of the State which in turn could generate local employment and reduces migration. Since the State is rich in water resources, there is a comparative advantage in developing the hydro-electric sector in an environmentally sustainable manner. Third, there is a need to bridge the infrastructure deficit in the State with the active participation of the private sector. Better infrastructure will enable harnessing the tourism potential. Identified tourist zones can be connected by better quality roads besides exploring the possibilities of providing air links over the medium-term. Fourth, the high level of literacy provides opportunity for further growth through knowledge-based industries. It is, therefore, important to set up quality higher learning and professional education centres to provide knowledge-workers. Fifth, there is, a need to improve credit culture where banks can explore innovative customized business models with a greater emphasis on group lending. This in turn could help reduce inequality in credit distribution. Sixth, the financial sector in the State is dominated by commercial banks. Hence, the spread of banking services is important for greater economic activity. In this context, the quantitative achievement of banking coverage reflected in increase in no-frills accounts need to be converted into meaningful financial inclusion by active loan and deposit transactions in these accounts. The geographical peculiarities of the State along with small size of scattered settlements make it difficult for physical location of branches. Therefore, emphasis can be placed on mobile branches with greater reliance on information technology. In this process, all the stake-holders - banks, the State Government and the Reserve Bank - need to work in close co-ordination: banks by ensuring that the BCs are active and by gradually increasing the number of branches in the unbanked areas; the State Government by ensuring that social benefit transfers progressively take place through bank accounts; and the Reserve Bank by effective monitoring and active co-ordination of the financial inclusion action plan in the State. Conclusion I briefly reviewed the recent economic and financial developments in Uttarakhand and made a few suggestions for sustainable inclusive growth. Let me conclude with some thoughts on the agricultural economy as this university has been the cradle of technological breakthrough in agriculture. As we discussed, there has been a sharp drop in the share of agriculture in the national as well as in the State GDP. However, 52 per cent of our work force and 69 per cent of the population at the national level are still dependent on agriculture directly or indirectly for livelihood. Hence, agricultural growth is central to inclusive sustainable overall growth. However, stagnation in agriculture is increasingly emanating as a major constraint to growth. This has manifested itself in several ways: low productivity and high volatility in production across crops, low per capita availability of food products as well as high and persistent food inflation. The geo-climatic conditions have also changed with more frequent visitation of natural calamities on a wider global stake. As the net cultivable area of 142 million hectares in the country is not likely to increase, the gain in food production will have to be met by increasing productivity. In this context, there is a need for another wave of technological breakthrough in developing short-duration drought-resistant high yielding seeds not only for cereals but also pulses and oilseeds. Given the fragmented land holding pattern in the country, it is also important to develop appropriate technology for small farm size. There is also a need for developing better farming practices in horticulture, poultry, dairy and fishery, the consumption of which is going to increase substantially. In this endeavour, agricultural scientists and leaders like you have an important role in ushering in another Green Revolution for which this university has prided itself. Thank you. * Speech by Deepak Mohanty, Executive Director, Reserve Bank of India, delivered at the G. B. Pant University of Agricultural Technology, Pantnagar, on 31st August 2012. The assistance provided by P.K. Nayak and S. Suraj in preparation of the speech is acknowledged. 1North Eastern States excluding Assam was taken together as one entity and therefore only 23 States were compared for HDI ranking in the India Human Development Report 2011, Government of India. |
||||||||||||||||||||||||||||||||||||||||||||||||||||||||||||||||||||||||||||||||||||||||||||||||||||||||||||||||||||||||||||||||||||||||||||||||||||||||||||||||||||||||||||||||||||||||||||||||||||||||||||||||||||||||||||||||||||||||||||||||||||||||||||||||||||||||||||||||||||||||||||||||||||||||||||||||||||||

ഈ പേജ് ഷെയർ ചെയ്യുക:


റിസർവ് ബാങ്ക് ഓഫ് ഇന്ത്യ മൊബൈൽ ആപ്ലിക്കേഷൻ ഇൻസ്റ്റാൾ ചെയ്ത് ഏറ്റവും പുതിയ വാർത്തകളിലേക്ക് വേഗത്തിലുള്ള ആക്സസ് നേടുക!
ഞങ്ങളുടെ ആപ്പ് ഇൻസ്റ്റാൾ ചെയ്യാൻ QR കോഡ് സ്കാൻ ചെയ്യുക


പേജ് അവസാനം അപ്ഡേറ്റ് ചെയ്തത്:


