RbiSearchHeader

Press escape key to go back

Past Searches

Theme
Theme
Text Size
Text Size
S2

RbiAnnouncementWeb

RBI Announcements
RBI Announcements

Asset Publisher

83713490

Consumer Confidence Survey

Today, the Reserve Bank released the results of the November 2019 round of its Consumer Confidence Survey (CCS)1. The survey was conducted in 13 major cities viz., Ahmedabad; Bengaluru; Bhopal; Chennai; Delhi; Guwahati; Hyderabad; Jaipur; Kolkata; Lucknow; Mumbai; Patna; and Thiruvananthapuram. Perceptions and expectations on the general economic situation, the employment scenario, the overall price situation and own income and spending are obtained from 5,334 households across these cities.

Highlights:

I. Consumer confidence weakened further in November, with both the current situation index (CSI) and the future expectations index (FEI)2 declining (Chart 1).

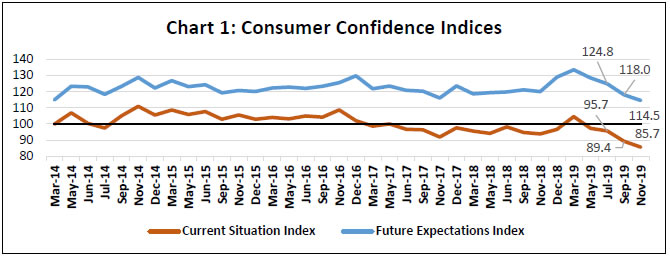
Note: Please see the excel file for time series data

II. Consumers’ sentiments on the general economic situation and the employment scenario weakened, but their one year ahead expectations remained in the optimistic terrain for all parameters, except prices (Tables 1 and 2); expectations on income one year ahead improved marginally over the previous survey round (Table 5).

III. Most respondents perceived prices as having increased during the last one year, and they expect further rise in prices in the year ahead (Tables 3 and 4); households’ sentiments on overall spending remained resilient (Tables 6, 7 and 8).


Table 1: Perceptions and Expectations on the General Economic Situation
(Percentage responses)
Survey Round Current Perception One year ahead Expectation
Improved Remained Same Worsened Net Response Will Improve Will Remain Same Will Worsen Net Response
Nov-18 33.2 21.6 45.2 -12.0 53.6 15.3 31.2 22.4
Dec-18 36.7 20.2 43.1 -6.4 59.9 15.8 24.3 35.6
Mar-19 46.2 21.3 32.5 13.7 66.4 15.8 17.8 48.6
May-19 38.8 23.6 37.7 1.1 61.4 17.7 20.9 40.5
Jul-19 37.4 24.2 38.4 -1.0 59.4 16.0 24.6 34.8
Sep-19 33.5 18.6 47.9 -14.4 53.2 15.0 31.8 21.4
Nov-19 30.0 18.4 51.6 -21.6 48.9 16.5 34.7 14.2

Table 2: Perceptions and Expectations on Employment
(Percentage responses)
Survey Round Current Perception One year ahead Expectation
Improved Remained Same Worsened Net Response Will Improve Will Remain Same Will Worsen Net Response
Nov-18 33.9 18.9 47.2 -13.3 53.5 16.1 30.4 23.1
Dec-18 35.6 20.1 44.3 -8.7 60.3 17.1 22.7 37.6
Mar-19 41.1 21.7 37.2 3.9 65.3 15.9 18.9 46.4
May-19 33.7 22.1 44.2 -10.5 59.3 17.6 23.1 36.2
Jul-19 32.5 21.9 45.6 -13.1 56.7 17.5 25.8 30.9
Sep-19 28.0 19.5 52.5 -24.5 51.2 15.4 33.4 17.8
Nov-19 24.4 18.1 57.5 -33.1 46.3 17.7 36.0 10.3

Table 3: Perceptions and Expectations on Price Level
(Percentage responses)
Survey Round Current Perception One year ahead Expectation
Increased Remained Same Decreased Net Response Will Increase Will Remain Same Will Decrease Net Response
Nov-18 88.3 7.8 3.8 -84.5 80.2 11.6 8.2 -72.0
Dec-18 84.3 10.9 4.8 -79.5 71.6 15.9 12.5 -59.1
Mar-19 77.8 16.4 5.8 -72.0 68.7 20.5 10.9 -57.8
May-19 81.6 14.1 4.3 -77.3 70.3 18.7 11.0 -59.3
Jul-19 81.7 15.0 3.3 -78.4 73.9 16.1 10.0 -63.9
Sep-19 86.1 10.6 3.3 -82.8 75.9 13.8 10.3 -65.6
Nov-19 86.8 10.2 2.9 -83.9 78.0 14.1 7.9 -70.1

Table 4: Perceptions and Expectations on Rate of Change in Price Level (Inflation)*
(Percentage responses)
Survey Round Current Perception One year ahead Expectation
Increased Remained Same Decreased Net Response Will Increase Will Remain Same Will Decrease Net Response
Nov-18 80.0 13.9 6.1 -73.9 75.9 18.0 6.1 -69.8
Dec-18 77.9 15.2 6.9 -71.0 76.3 17.3 6.4 -69.9
Mar-19 72.5 20.0 7.6 -64.9 72.9 20.8 6.3 -66.6
May-19 74.4 20.8 4.8 -69.6 76.7 18.5 4.8 -71.9
Jul-19 72.5 22.3 5.2 -67.3 77.8 18.0 4.1 -73.7
Sep-19 74.2 19.5 6.3 -67.9 77.9 16.1 6.1 -71.8
Nov-19 77.2 17.4 5.5 -71.7 77.3 17.3 5.4 -71.9
*Applicable only for those respondents who felt price has increased/price will increase.

Table 5: Perceptions and Expectations on Income
(Percentage responses)
Survey Round Current Perception One year ahead Expectation
Increased Remained Same Decreased Net Response Will Increase Will Remain Same Will Decrease Net Response
Nov-18 29.9 49.5 20.5 9.4 59.0 34.3 6.7 52.3
Dec-18 29.8 48.2 22.0 7.8 63.5 30.4 6.2 57.3
Mar-19 30.1 50.0 19.9 10.2 60.8 33.4 5.7 55.1
May-19 29.0 50.2 20.8 8.2 58.9 35.1 6.0 52.9
Jul-19 25.8 51.3 22.9 2.9 55.4 37.7 6.9 48.5
Sep-19 25.0 48.3 26.7 -1.7 53.0 37.4 9.6 43.4
Nov-19 24.1 49.2 26.7 -2.6 52.8 38.9 8.3 44.5

Table 6: Perceptions and Expectations on Spending
(Percentage responses)
Survey Round Current Perception One year ahead Expectation
Increased Remained Same Decreased Net Response Will Increase Will Remain Same Will Decrease Net Response
Nov-18 73.0 23.9 3.1 69.9 77.6 19.0 3.4 74.2
Dec-18 73.8 22.7 3.5 70.3 77.3 18.7 4.0 73.3
Mar-19 70.1 26.8 3.1 67.0 77.5 19.9 2.6 74.9
May-19 68.6 28.0 3.4 65.2 74.7 22.5 2.9 71.8
Jul-19 71.7 25.0 3.4 68.3 76.8 20.1 3.2 73.6
Sep-19 74.1 22.0 3.8 70.3 77.0 19.0 4.0 73.0
Nov-19 73.2 23.4 3.4 69.8 77.4 19.0 3.6 73.8

Table 7: Perceptions and Expectations on Spending- Essential Items
(Percentage responses)
Survey Round Current Perception One year ahead Expectation
Increased Remained Same Decreased Net Response Will Increase Will Remain Same Will Decrease Net Response
Nov-18 83.4 13.4 3.2 80.2 84.1 12.5 3.3 80.8
Dec-18 82.4 14.5 3.1 79.3 83.5 13.0 3.4 80.1
Mar-19 78.6 18.2 3.2 75.4 83.4 14.3 2.3 81.1
May-19 80.0 17.1 2.9 77.1 80.7 16.5 2.8 77.9
Jul-19 81.7 15.7 2.6 79.1 82.9 14.3 2.8 80.1
Sep-19 83.8 13.6 2.6 81.2 83.0 13.7 3.3 79.7
Nov-19 83.6 13.6 2.7 80.9 83.0 13.9 3.1 79.9

Table 8: Perceptions and Expectations on Spending- Non-Essential Items
(Percentage responses)
Survey Round Current Perception One year ahead Expectation
Increased Remained Same Decreased Net Response Will Increase Will Remain Same Will Decrease Net Response
Nov-18 39.1 37.6 23.3 15.8 44.5 35.9 19.6 24.9
Dec-18 38.4 37.5 24.1 14.3 46.1 33.0 20.9 25.2
Mar-19 36.3 43.3 20.4 15.9 46.1 37.6 16.3 29.8
May-19 32.7 40.3 27.0 5.7 39.4 37.3 23.3 16.1
Jul-19 31.0 44.9 24.1 6.9 36.2 42.2 21.6 14.6
Sep-19 29.9 40.0 30.1 -0.2 34.7 39.2 26.0 8.7
Nov-19 27.5 42.4 30.1 -2.6 33.4 43.0 23.5 9.9

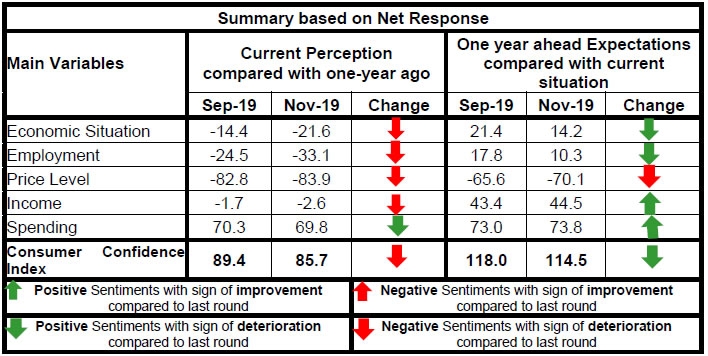
1 The survey results are based on the views of respondents.

2 CSI and FEI are compiled on the basis of net responses on the economic situation, income, spending, employment and the price level for the current period and a year ahead, respectively. CSI/FEI = 100 + Average of Net Responses of the above parameters.

RbiTtsCommonUtility

प्ले हो रहा है
കേൾക്കുക

Related Assets

RBI-Install-RBI-Content-Global

RbiSocialMediaUtility

റിസർവ് ബാങ്ക് ഓഫ് ഇന്ത്യ മൊബൈൽ ആപ്ലിക്കേഷൻ ഇൻസ്റ്റാൾ ചെയ്ത് ഏറ്റവും പുതിയ വാർത്തകളിലേക്ക് വേഗത്തിലുള്ള ആക്സസ് നേടുക!

Scan Your QR code to Install our app

RbiWasItHelpfulUtility

ഈ പേജ് സഹായകരമായിരുന്നോ?