 IST,
IST,


India’s External Debt as at the end of March 2006: Highlights
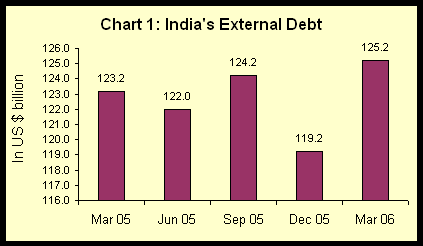
- India’s total external debt is placed at US $ 125.2 billion at the end of March 2006. At this level, the external debt stock increased by about US $ 2 billion over the end-March 2005 level (Chart 1).
- The valuation effect, on account of appreciation of the US dollar against other major international currencies, has had a moderating impact on the stock of external debt.

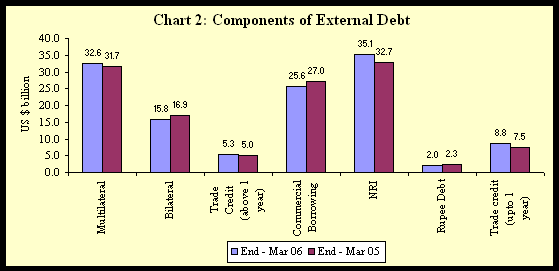
- Among the various components of debt, NRI deposit, trade credit and multilateral debt have risen during the year (Table 2).
- External commercial borrowings (ECBs), bilateral and rupee debt declined during the year. External commercial borrowings recorded net outflows due to one-off effect of principal repayment of India Millennium Deposits (IMDs) (US $ 5.5 billion) (Table 2) (Chart 2).
Table 2: Variation in External Debt by Components
|
Item |
At the end-of |
Variation during 2005-06 |
||
|
March 06 |
March 05 |
|||
|
Amount |
Amount |
Absolute variation |
Percentage variation |
|
|
(US $ million) |
(US $ million) |
(US $ million) |
(Per cent) |
|
|
(1) |
(2) |
(3) |
(4) |
(5) |
|
1. Multilateral |
32,558 |
31,702 |
856
|
2.7
|
|
2. Bilateral |
15,784 |
16,930 |
-1,146
|
-6.8
|
|
3. IMF |
0 |
0 |
0
|
0.0
|
|
4. Trade Credit |
|
|
|
|
|
a. Above 1 year |
5,326 |
4,980 |
346
|
6.9
|
|
b. Upto 1 year* |
8,788 |
7,524 |
1,264
|
16.8
|
|
5. Commercial Borrowings |
25,560 |
27,024 |
-1,464
|
-5.4
|
|
6. NRI Deposits (long-term) |
35,134 |
32,743 |
2,391
|
7.3
|
|
7. Rupee Debt |
2,031 |
2,301 |
-270
|
-11.7
|
|
8.Total Debt |
1,25,181 |
1,23,204 |
1,977
|
1.6
|
|
Memo Items |
||||
|
A. Long-Term Debt |
1,16,393 |
1,15,680 |
713
|
0.6
|
|
B. Short-Term Debt |
8,788 |
7,524 |
1,264
|
16.8
|

- The US dollar was the most important currency in the currency composition of India’s external debt at end-March 2006, accounting for 45.1 per cent of total external debt stock (Chart 3).

Indicators of Debt Sustainability
There has been a perceptible improvement in external debt indicators over the years reflecting the growing sustainability of external debt of India.
- External debt to GDP has dropped to 15.8 per cent at end-March 2006 from 17.3 per cent at end-March 2005 and 30.8 per cent at end-March 1995.
- The debt service ratio has risen to 10.2 per cent during 2005-06 from 6.1 per cent during 2004-05 largely due to IMD repayments. It may be indicated that debt service ratio was 17.1 per cent in 1999-2000.
- Reflecting the rise in short term debt during 2005-06, the ratio of short-term to total debt and short term debt to reserves rose to 7.0 per cent and 5.8 per cent, respectively (Table 3).
Table 3: Indicators of Debt Sustainability (in per cent)
|
Indicators |
End-March 06 |
End-March 05 |
|
(1) |
(2) |
(3) |
|
Total debt /GDP |
15.8 |
17.3 |
|
Short-term/Total debt |
7.0 |
6.1 |
|
Short-term debt/Reserves |
5.8 |
5.3 |
|
Concessional debt/Total debt |
31.5 |
33.3 |
|
Reserves/ Total debt |
121.1 |
114.9 |
|
Debt Service Ratio* |
10.2 |
6.1 |
* relates to fiscal year 2005-06 and 2004-05
- The share of concessional debt in total external debt declined to 31.5 per cent at end-March 2006 from 33.3 per cent at end-March 2005 (Table 3). It may be recalled that this ratio was around 45.9 per cent at end-March 1991. This development indicates a gradual increase in non-concessional private debt in India's external debt stock. At this level, however, concessional debt continues to be a significant proportion of the total external debt, especially by international comparison.
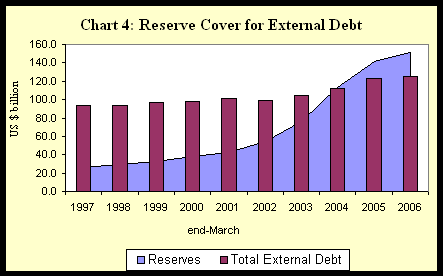
- India’s foreign exchange reserves exceeded the external debt by US $ 26.4 billion providing a cover of 121.1 per cent to the external debt stock at the end of March 2006 (Chart 4).

Full details of the evolution of the debt stock over the period March 2005 to March 2006 are set out in Statement 1 and 2.
Alpana Killawala
Chief General Manager
Press Release : 2005-2006/1710


