|
Dipika Das*
Received: September 4, 2023
Accepted: December 8, 2023
This paper examines procyclicality in the estimates of Total Factor Productivity (TFP) in the Indian economy from 1981-82 to 2019-2020 based on the India KLEMS 2022 database. A major driver of the procyclicality could be the varying factor utilisation rate over the business cycle. In this paper, new TFP indices have been constructed, adjusting for the variable capital utilisation rate and labour efforts using a partial equilibrium model. The procyclicality of the adjusted TFP series, as indicated by correlation of TFP growth with value added growth, reduces from 0.88 for the unadjusted series to 0.75 for the adjusted TFP series for the economy as a whole. The procyclicality is more in labour-intensive manufacturing sectors, such as textiles, and services sectors, such as construction, hotels, business services, education and health care.
JEL Classification: E32, D24
Keywords: Total factor productivity, business cycle, factor hoarding, production function estimation, constant returns to scale.
Introduction
Capital investment, labour and productivity growth are the three main drivers of economic growth. Growth based on factor accumulation may not be sustainable due to potential limitations on the availability of the factors in future and diminishing returns to factors. As a result, the sustainability of growth depends heavily on productivity growth, which is output growth that is not accounted for by factor accumulation. For instance, it has been stated that decline in productivity, which resulted from ageing population, weakening of research and development activities and technological progress, was one of the primary causes of the Japanese economy’s prolonged stagnation since 1990s, called as the “lost decade” (Yoshino and Taghizadeh-Hesary, 2015). Therefore, an on-going accurate measurement and assessment of productivity growth is critical for a robust understanding of economic growth, its drivers and appropriate policies.
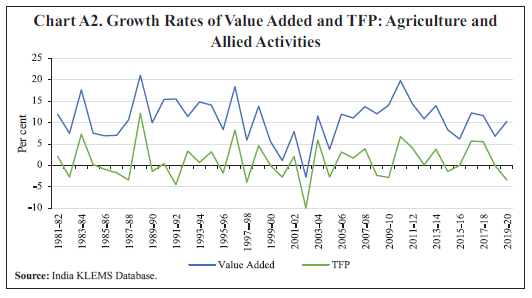
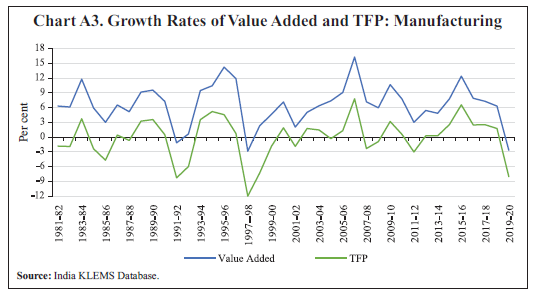
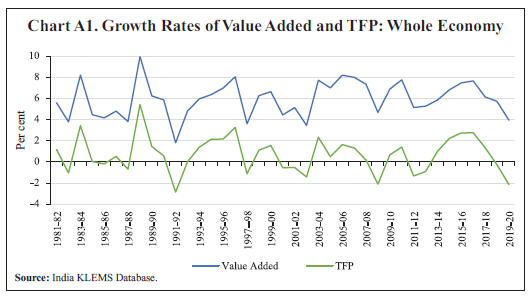
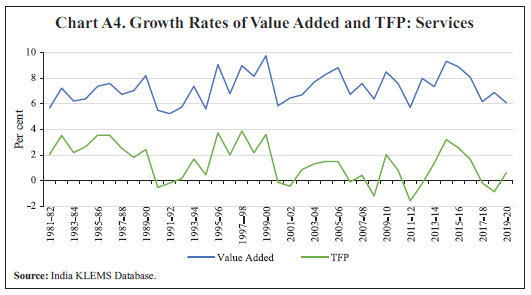
A commonly used measure of productivity is the Total Factor Productivity (TFP), which is traditionally computed using the growth accounting methodology or Solow residual; this measure is also followed in the India KLEMS database. For unbiased estimates, the Solow approach requires preconditions of perfect competition, constant returns to scale (CRS) and full capacity utilisation. Any deviation from these assumptions and/or an error in the measurement of inputs or outputs can lead to biases in the measurement of the Solow residual. In the years of strong expansion, the residual could be usually large and in the years of recession, it could be low or even negative. The trends of TFP growth along with value added growth for the whole economy as well as for different sectors - agriculture, manufacturing and services – as depicted in Annex, Chart A1 through A4, respectively, suggest a strong tendency for the TFP growth and value added growth to co-move. A positive correlation of 0.88 is observed between the two series for the Indian economy as a whole and 0.95, 0.91 and 0.63 for agriculture, manufacturing and services sectors, respectively.
The literature has explored the sources of procyclicality in estimates of productivity, that is, rise of productivity in booms and fall in recessions. However, most of these studies have focused on labour productivity instead of TFP. Some of the early studies in this area, Gordon (1990), Burnside et al. (1993) and Burnside and Eichenbaum (1996) argued that the procyclicality resulted from measurement errors in labour and capital due to factor hoarding, especially labour hoarding. Hall (1990), Basu and Fernald (1995), and Basu and Kimball (1997) presented a different perspective which suggested that fluctuations in inputs may cause procyclical fluctuations in productivity, when there are imperfect competition conditions and increasing returns to scales at the firm level. Basu (1996) examined the relative significance of cyclical fluctuations in labour and capital utilisation, increasing returns to scale and technology shocks as explanations for procyclical productivity, concluding that cyclical factor utilisation was the most important factor.
Cooley and Prescott (1995) suggested that productivity shocks, which are generated as Solow residuals are procyclical themselves and are the driving force for a business cycle, serving as the foundation for the real business cycle models. To explain cyclical movements in aggregate productivity, Basu and Fernald (2001) used a Dynamic General Equilibrium (DGE) model that took into account cyclical utilisation of factors of production, increasing returns to scale and reallocation of resources across sectors with different marginal products. Schmöller and Spitzer (2019) estimated a medium-scale Dynamic Stochastic General Equilibrium (DSGE) model in the Euro area and came to the conclusion that the major cause of the decline in productivity in the Euro area was the decline in the effectiveness of research and development (R&D) investment and non-adoption of new technologies.
To the best of my knowledge, not many studies have been undertaken on the measurement of procyclical biases in productivity in India, especially at the economy level. This paper attempts to fill this gap by constructing TFP indices adjusting for variable capital utilisation rate and labour efforts over the business cycle, using a partial equilibrium model. The model is tested on the India KLEMS database to address biases by adjusting for the variable factor utilisation.
The structure of the paper is as follows. Section II explains the various procyclical biases in the traditional TFP estimation. Section III describes the methodology and the data used. Section IV presents the empirical findings and their implications and Section V provides the concluding observations and direction for future research.
Section II
Biases in Traditional TFP Estimation
Solow (1957) developed the empirical method for measuring TFP growth by subtracting input growth of all factors of production from the output growth, which later came to be known as Solow residual. If Y be the output, K be the capital, L be the labour, A be the technology and α be the factor share earned by labour, then a CRS production function can be represented as below:
Taking log and total differentiation,
dA/A is the measure of TFP growth or Solow residual which can be written as below for discrete time series data:
where ΔAt is the TFP growth in year t; Δyt is output growth; Δlt is growth of labour; Δkt is growth of capital and αt is the factor share earned by labour or the share of labour cost in revenue ( wL/pY). Here, the time subscript has been used for parameter α too, to emphasise that it can change over time.
Under the assumptions of perfect competition, CRS and full capacity utilisation, the Solow residual should measure the exogenous technology shock. However, any deviation from these assumptions may lead to biases in the measurement of TFP. In this section, the potential biases in Solow residual due to deviations from these assumptions are discussed.
II.1 Presence of Market Power
The CRS production function assumes perfect competition and that all firms are price takers. However, in the economy, some of the firms or sectors could engage in monopolistic and oligopolistic price setting practices when determining prices.
Let μ be the mark up ratio or price to marginal cost, μ = p/c. Then, the elasticity of the production function with respect to labour input is μα and the rate of growth of output can be decomposed as:
Under perfect competition, μ is equal to one.
From (2.4), standard Solow residual under market power can be derived as:
From equation (2.5), it may be observed that the Solow residual is equal to (μt - 1)αt(Δlt - Δkt) + ΔAt and no longer represents true TFP growth in the presence of market power (when μ is not equal to 1).
II.2 Increasing Returns to Scale
CRS is another assumption used in the estimation of the Solow residual. A company can also possess market power in order to operate at a point of increasing returns to scale. Let γ be the returns to scale index, that is, the elasticity of output with respect to both the inputs, then under the assumption of constant returns, γ =1.
Under increasing returns to scale (γ>1), the standard Solow residual has an extra term as below:
Hence, Solow residual no longer produces an unbiased estimate of TFP growth in the presence of increasing returns to scale, because of both market power as well as increasing returns to scale (when γ is not equal to 1).
II.3 Unmeasured Fluctuations in Capital Utilisation
One of the key assumptions in computation of Solow TFP estimate is that all the capital available for the firms is used for production. But in downturns, firms are not able to disinvest capital and the available capital may not get fully utilised leading to under-utilisation. In upturns, on the contrary, there could be over-utilisation of capital stocks due to extended production hours or minimising maintenance schedules. Further, if there is user cost of capital i.e., if capital depreciation is on the basis of the usage of capital, then the capital depreciation rate will also vary depending on the utilisation rate and will not be constant over time. Due to both variable capital depreciation rate and variable capital utilisation, the capital stock would be over-estimated in downturns and under-estimated during upturns.
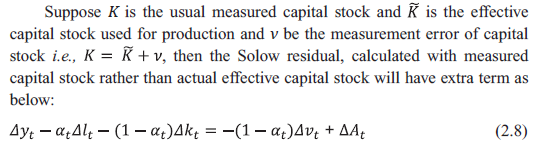 Capital measurement error ν is likely to be negatively correlated with output changes (i.e., in upturn, capital utilisation is higher than usual measure and the error is negative and vice-versa), which will create procyclical biases. Additionally, with prolonged excess capacity of capital, the firm’s capital costs would be higher than normal, such that the cost share of labour (α) would understate the true elasticity of output with respect to labour input.
II.4 Unmeasured Fluctuations in Labour Effort
Similar to capital stock, in computation of the Solow estimate, it is assumed that all the labour is fully utilised for production. However, it may be difficult for firms to lay off workers in downturns. Similarly, it may be costly and time-consuming to train new employees, and hence, firms may use the existing employees more intensively during upturns. If cyclical fluctuations in labour efforts are ignored in the computation of TFP, it becomes procyclical, implying fluctuations in technology.
Now, Δet is likely to be positively correlated with output changes i.e., in upturns, labour efforts are higher giving rise to procyclical biases.
Section III
Data and Methodology
III.1 Data
This paper is based on the India KLEMS 2022 database, sourced from the Reserve Bank of India (RBI) for the period 1980-81 to 2019-20. The data consist of value added, labour input, capital input, energy input, material input and TFP, among others, for 27 industries as well as for the three broad sectors - agriculture, manufacturing and services and for the whole economy.
III.2 Methodology
In this paper, productivity under variable factor utilisation is modelled under a partial equilibrium framework assuming Cobb-Douglas production function (Das, 2009).
III.2.1 Modelling of Productivity Under Variable Factor Utilisation
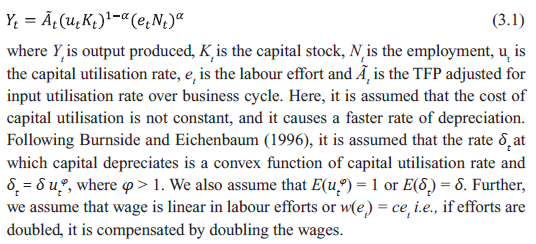
We assume the following two-factor Cobb-Douglas production function along the lines of Solow (1957):
Additionally, it is assumed that (a) the cost of capital or the rate at which firms rent capital is equal to the interest rate rt plus the depreciation rate δt induced by its use; and (b) the rental cost of capital is not fixed and depends on depreciation which is a function of the utilisation rate. δt is a function of the utilisation rate ut, which is observable by the capital owner. It is also assumed that changing employment (in a short time) would be infinitely expensive and hence, employment is pre-set one period ahead. Firms can only adjust the effort of labour instantaneously by offering them higher wages proportional to their efforts. Firms choose utilisation rate ut, capital stock Kt and labour effort et in a given period. Employment Nt is fixed for the period, and thus, the firm’s optimisation problem can be written as:
where, w(et) is the wage which is a function of the labour effort.
The first order conditions are the following,
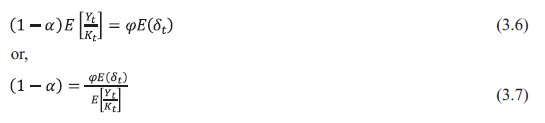
From equation (3.2) substituting δt for δutφ in the R. H. S. we get,
Taking expectations on both sides of equation (3.5) we get,
Substituting the value of (1-α) in equation (3.5) we get,
Comparing (3.3) with (3.5) we get,
Taking expectation on both sides of the equation (3.9) and solving for φ we get,
Substituting the value of φ in the equation for ut we get,
Thus, capital utilisation rate is high, when capital productivity is higher than its average.
To estimate labour efforts et assuming functional form of w(et), from equation (3.4) we get,
Taking expectation on both sides of equation (3.12), we get,
Substituting the value of α in equation (3.12) we get
Thus, labour effort is high, when labour productivity at t is higher than its average value. The trend values (HP filter) of Yt/Nt and Yt/Kt are used for their expected values and applied to the denominator of the equations (3.11) and (3.14).
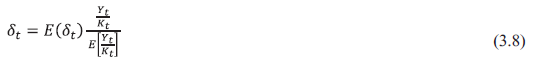
III.2.2 Computation of New Capital Stocks Series and Effective Labour
The steps involved in the computation of the new capital stocks series are the following. First, from the standard capital stock series, the variable depriciation rate δt at time period t, is computed using equation (3.8), where E(δt) is δ, which is the average depreciation rate of capital based on capital asset classification (i.e., building and construction, transport equipment or machinery) at industry level as used in KLEMS database. Following KLEMS database, we assume lifetime of 80 years for buildings, 20 years for transport equipment and 25 years for machinery and equipment. In other words, average depreciation rates of building and construction, transport equipment and machinery are considered to be 2.5 per cent, 10 per cent and 8 per cent, respectively. The variable depreciation rate δt is applied to compute new capital stock series KtN iteratively as follows:
III.2.3 Computation of Adjusted TFP
In this paper, we have followed the KLEMS growth accounting methodology for the measurement of TFP and considered real value added as output; and employment, labour quality index, capital stock, and capital composition index as inputs. Based on a partial equilibrium model, new capital input series, utilisation rate of capital, labour efforts are estimated and effective capital stock and effective labour ‘e*N’ are computed. Labour quality index and capital composition index are taken directly from the KLEMS database for the computation of new TFP series.
First, TFP indices are computed at each industry level. Then, the sectorlevel aggregates are obtained using Tornqvist aggregate of growth rates of GVA, capital input and labour input (following the same methodology used in the India KLEMS database) to compute TFP at broad sectoral level – agriculture, industry and services, and at the economy-wide level.
Section IV
Empirical Findings
IV.1 Sector-wise Results
Sector-wise summary results are presented in Tables A1 and A2 and detailed industry-level results are given in Table A4 in the Annex. Table A1 presents biases in the traditional Solow TFP estimates for the last four decades, due to measurement errors in capital and labour. It is observed that during 1980s, the standard TFP growth rates were higher than the adjusted TFP growth rates and the biases were positive for all the sectors. However, in 1990s, these biases were negative. In upturn, the standard TFP growth is usually higher than the adjusted TFP growth, and therefore, the TFP growth is overestimated, and vice-versa. During the 1990s, the Indian economy witnessed episodes of economic downturn due to the balance of payment (BoP) crisis and the Asian financial crisis, which could have pulled down the capacity utilisation as well as production. However, since the available capital and labour, instead of the utilised capital and labour, were considered for the standard TFP computation, the traditional Solow TFP estimate was low as well as negative for many years.
At the economy-wide level, out of 39 years of TFP growth estimation available in the India KLEMS 2022 database, for 15 years, the traditional TFP growth estimates were near zero or negative. In the case of adjusted TFP, the number of years of negative TFP growth was 12 and also the TFP numbers, although negative, were not as low. For example, during 2019-20, the unadjusted TFP growth was -2.1 per cent for the overall economy; it was -3.4 per cent, -8.1 per cent and 0.6 per cent for agriculture, manufacturing and services sectors, respectively. In comparison, the adjusted TFP growth for the same period for the whole economy was -0.6 per cent and for agriculture, manufacturing and services sectors, it was 0.8 per cent, -3.4 per cent, and 0.3 per cent, respectively.
The estimates of adjusted and conventional TFP measurements for major sectors - agriculture, manufacturing and services during 1981-1982 to 2019- 2020 are presented in Table A2. The following points emerge from Table A2. First, the manufacturing industry as a whole had the lowest TFP growth and the mean TFP growth for the entire period was negative. Further, the average deviation of the standard Solow residual from the adjusted TFP residual was marginally positive for manufacturing, indicating a modest overestimation of the TFP growth. Second, productivity growth in agricultural sector was moderate (and higher than the manufacturing sector). Third, the services sector’s TFP growth was the highest among all the sectors and, on an average, the TFP estimates of both the approaches were close.
In the last decade i.e., during 2011-2019, the average adjusted TFP growth estimates were more than the standard TFP growth estimates. Due to this, the adjusted TFP’s contribution to GVA growth increased to 14 per cent from 10 per cent in the case of the standard TFP. Further, the contribution to employment growth declined from 18 per cent to 13 per cent (Table A3).
IV.2 Procyclicality of Measured TFP
The standard computation of the Solow residual, as discussed earlier, fails to filter out the cyclical variation in input utilisation rates, assigning these to the fluctuations in technology. Therefore, as expected, the modified TFP series was found to be less volatile than the conventional TFP growth series, as evident from their standard deviations (Table A2). The degree of procyclical adjustment in TFP varied across sectors (as seen by the correlation with value added growth), with the labour-intensive manufacturing and services sectors seeing the most procyclical adjustment. In agriculture, high procyclicality was observed which could be attributed to changes in labour utilisation in high / low productive years on account of weather shocks. Among the manufacturing sectors, textile and wood products reported the highest procyclical adjustment. Among the services sectors, construction, hotels, business services, education and health care sectors witnessed more TFP adjustments. For the economy as a whole, the procyclicality of the adjusted TFP was lower, with the correlation of the adjusted TFP growth with value added growth reducing from 0.88 to 0.75. Sector-wise, the correlation of the adjusted TFP growth with the respective value added growth rate reduced from 0.95 to 0.91 for agriculture, from 0.91 to 0.85 for manufacturing and from 0.63 to 0.50 for the services sector. Although the new adjusted TFP indices reduced procyclicality, they could not fully eliminate it due to other factors, such as imperfect competition, scale economies or procyclical TFP shocks.
IV.3 Implications
IV.3.1 GVA Growth - Major Factors
In recent years, India’s growth is mainly driven by factor accumulation. Capital accumulation has played a significant role in driving GVA growth and it is estimated to have contributed between 44 per cent and 64 per cent, while employment growth has contributed only about 20 per cent of GVA growth during the last four decades (Table A3). Further, it may be observed that the contribution of employment growth is declining, and that of capital accumulation is rising over time. The contribution of TFP growth to GVA growth declined in the 2000s, with some recovery in the 2010s. On average, the TFP contributed around 8 to 9 per cent (standard / adjusted TFP growth) to growth during 2001-2019.
IV.3.2 Policy Measures to Increase TFP Growth
The TFP growth could be enhanced by reducing the dependency ratio - the ratio of the number of people from the non-working age to the number of working age population. According to Roy (2022), the reduction in the dependency ratio by one percentage point could increase TFP in the range of 0.33 per cent to 0.40 per cent. Measures to reduce the fertility rate by improving the access and quality of family planning services, and promoting female education can also help in enhancing TFP growth. The labour force participation rates need to be increased by enhancing the skills and employability, especially among youth and women.
Furthermore, financial development can support domestic investment (Malik et al., 2021). Sector-specific policies aimed at agriculture and food processing, manufacturing, retail trade and healthcare can also be instrumental in stepping up TFP growth (Sankhe et al., 2020). Some of the possible measures suggested by Sankhe et al. (2020) relate to development of manufacturing clusters near ports, free-trade warehousing zones, enhanced investment in e-commerce and trade sectors, improving medical tourism, among others.
A business-friendly environment can support a shift of labour from agriculture to industrial and services sectors (Kotera and Xu, 2023). Finally, investment in long-term infrastructural development, such as highways, ports and dedicated freight corridors can also help in a sustained increase in TFP growth.
Section V
Summary and Way Forward
An economy may be hit with TFP shocks due to various factors, including technological innovations, changes in the quality of inputs (embodied technological progress), variations in technical efficiency and allocative efficiency, economies of scale, weather shocks and changes in the policy framework. Ideally, the growth accounting technique should yield an estimate of TFP growth that is exogenous to the rate of output growth. However, due to deviations from the assumptions of perfect competition, constant return to scale and full capacity utilisation, the traditional measures of productivity may be procyclical.
This paper attempted to generate TFP estimates, while controlling for the variations in capacity utilisation rates of key factors (capital and labour) over the business cycle, using a partial equilibrium model allowing for factor hoarding. The model was tested on India KLEMS 2022 database for the period 1981-82 to 2019-20. The measured TFP growth was found to be less procyclical and the correlation between TFP growth and value added growth for the economy reduced from 0.88 to 0.75.
The TFP deviations were more in labour-intensive sectors. Capital accumulation has been the major driver of India’s economic growth and its role has been increasing. The contribution of TFP growth, which fell during the 2000s, has shown signs of improvement during the 2010s. A further sustained increase in productivity growth would be necessary to boost India’s potential growth and medium-term growth prospects.
Future research can be aimed at improving upon the TFP measures developed in this paper. In particular, an attempt can be made to further reduce the possible biases resulting from the presence of imperfect competition and scale economies, which may require consistent and reliable estimates of the mark-up and the returns to scale parameter.
References
Basu, S. (1996). Procyclical productivity: Increasing returns or cyclical utilisation? The Quarterly Journal of Economics, 111(3) (Aug., 1996), 719-751.
Basu, S., & Fernald, J. (1995). Are apparent productive spillovers a figment of specific error? Journal of Monetary Economics, 36(1),165-188.
Basu, S., & Fernald, J. (2001). Why is productivity procyclical? Why do we care? Hulten C. R., Dean, E.R. & Harper, M.J. New Developments in Productivity Analysis (pp. 225–302). Chicago: University of Chicago Press.
Basu, S., & Kimball, M.S. (1997). Cyclical productivity with unobserved input variation. NBER Working Paper No. 5915.
Burnside, C., & Eichenbaum, M. (1996). Factor hoarding and propagation of business cycles shocks. American Economic Review, 86, 1154-1174.
Burnside, C., Eichenbaum, M., & Rebelo, S. (1993). Labour hoarding and the business cycle. Journal of Political Economy, 101 (2), 245-273.
Cooley, T. F., & Prescott, E. C. (1995). Economic growth and business cycles. Frontiers of Business Cycle Research (pp. 1-38). Princeton: Princeton University Press.
Das, D. (2009). Factor hoarding and productivity: Experience from Indian manufacturing J.-D. Lee, A Heshmati (eds.) Productivity, Efficiency an Economic Growth in the Asia-Pacific Region (pp.13-48), Springer-Verlag, Berlin Heidelberg 2009.
Gordon, R. (1990). Are procyclical productivity fluctuations a figment of measurement error? Northwestern University. Mimeo.
Hall, R. (1990). Invariance properties of Solow’s productivity residuals. Diamond, P. (ed.) Growth, Productivity, Employment. Cambridge: MIT Press.
Kotera, S., & Xu, M. T. (2023). Unleashing India’s growth potential. IMF Working Paper No. 2023/82.
Malik, M. A., Masood, T., & Sheikh, M. A. (2021). Econometric analysis of total factor productivity in India. The Indian Economic Journal, 69(1), 88–104.
Roy, N. (2022). Youth dependency ratio and total factor productivity: A study on Indian states. Indian Economic Review, Springer, Vol. 57(2), pages 443-467, December.
Sankhe, S., Madgavkar, A., Kumra, G., Woetzel, J., Smit, S., & Chockalingam, K. (2020). India’s turning point: An economic agenda to spur growth and jobs. McKinsey & Company Report, Aug 2020.
Schmöller, M., & Spitzer, M. (2019), Endogenous TFP, Business cycle persistence and the productivity slowdown. ECONSTOR, Bank of Finland Research Discussion Papers No. 21/2019.
Solow (1957).Technical change and the aggregate production function. The Review of Economics and Statistics, 39 (3), 312-320.
Yoshino, N., & Taghizadeh Hesary, F. (2015). Japan’s lost decade: Lessons for other economies. ADBI Working Paper 521. Tokyo: Asian Development Bank Institute.
Annex
| Table A1. Differences in TFP Measurement for Major Sectors During the Last Four Decades (Contd.) |
| Year |
Agriculture |
Manufacturing |
| Standard TFPG |
Adjusted TFPG |
Diff (1)-(2) |
Standard TFPG |
Adjusted TFPG |
Diff (4)-(5) |
| (1) |
(2) |
(3) |
(4) |
(5) |
(6) |
| 1981-1990 |
1. 20 |
1. 10 |
0. 10 |
0. 00 |
-0. 60 |
0. 60 |
| 1991-2000 |
0. 70 |
0. 80 |
-0. 10 |
-2. 00 |
-1. 50 |
-0. 50 |
| 2001-2010 |
0. 60 |
0. 30 |
0. 30 |
1. 10 |
0. 30 |
0. 80 |
| 2011-2019 |
1. 60 |
2. 20 |
-0. 60 |
0. 60 |
0. 80 |
-0. 20 |
| Table A1. Differences in TFP Measurement for Major Sectors During the Last Four Decades (Concld.) |
| Year |
Services |
Economy |
| Standard TFPG |
Adjusted TFPG |
Diff (7)-(8) |
Standard TFPG |
Adjusted TFPG |
Diff (10)-(11) |
| (7) |
(8) |
(9) |
(10) |
(11) |
(12) |
| 1981-1990 |
2. 40 |
2. 00 |
0. 40 |
1. 10 |
0. 70 |
0. 40 |
| 1991-2000 |
1. 70 |
1. 60 |
0. 10 |
0. 70 |
0. 80 |
-0. 10 |
| 2001-2010 |
0. 70 |
0. 70 |
0. 00 |
0. 40 |
0. 30 |
0. 10 |
| 2011-2019 |
0. 70 |
1. 00 |
-0. 30 |
0. 60 |
0. 80 |
-0. 20 |
| Source: Standard TFP growth from the India KLEMS database and Adjusted TFPG from author’s computation. |
| Table A2. Differences in Adjusted TFP Growth for Major Sectors During 1981-82 to 2019-20 (Contd.) |
| Year |
Agriculture |
Manufacturing |
| VA_g |
TFPG |
Adj_ TFPG |
Diff (2)-(3) |
VA_g |
TFPG |
Adj_ TFPG |
Diff (6)-(7) |
| |
(1) |
(2) |
(3) |
(4) |
(5) |
(6) |
(7) |
(8) |
| 1981-82 |
4.50 |
2.12 |
1.17 |
0.95 |
6.30 |
-1.84 |
-2.45 |
0.62 |
| 1982-83 |
-0.28 |
-2.70 |
-1.50 |
-1.19 |
6.11 |
-1.92 |
-1.99 |
0.08 |
| 1983-84 |
9.64 |
7.32 |
4.69 |
2.62 |
11.76 |
3.71 |
4.50 |
-0.79 |
| 1984-85 |
1.57 |
0.19 |
0.35 |
-0.17 |
5.92 |
-2.37 |
-3.42 |
1.04 |
| 1985-86 |
0.31 |
-0.91 |
0.33 |
-1.24 |
3.00 |
-4.70 |
-3.99 |
-0.71 |
| 1986-87 |
-0.41 |
-1.72 |
-1.12 |
-0.60 |
6.51 |
0.40 |
0.35 |
0.05 |
| 1987-88 |
-1.60 |
-3.41 |
-2.26 |
-1.14 |
5.15 |
-0.68 |
-1.25 |
0.57 |
| 1988-89 |
14.53 |
12.19 |
6.66 |
5.54 |
9.14 |
3.24 |
0.73 |
2.51 |
| 1989-90 |
1.18 |
-1.36 |
0.28 |
-1.64 |
9.55 |
3.56 |
0.76 |
2.80 |
| 1990-91 |
3.94 |
0.40 |
2.08 |
-1.69 |
7.26 |
0.49 |
0.77 |
-0.28 |
| 1991-92 |
-1.97 |
-4.45 |
-2.75 |
-1.71 |
-1.17 |
-8.29 |
-5.41 |
-2.88 |
| 1992-93 |
6.44 |
3.35 |
1.81 |
1.55 |
0.62 |
-5.99 |
-4.65 |
-1.34 |
| 1993-94 |
3.27 |
0.70 |
0.17 |
0.53 |
9.46 |
3.55 |
1.86 |
1.69 |
| 1994-95 |
4.61 |
3.20 |
2.16 |
1.03 |
10.43 |
5.19 |
3.29 |
1.91 |
| 1995-96 |
-0.70 |
-1.76 |
-0.70 |
-1.06 |
14.25 |
4.58 |
4.51 |
0.07 |
| 1996-97 |
9.46 |
8.29 |
5.58 |
2.71 |
11.89 |
0.73 |
1.63 |
-0.90 |
| 1997-98 |
-2.59 |
-3.90 |
-1.74 |
-2.16 |
-2.89 |
-12.02 |
-9.49 |
-2.53 |
| 1998-99 |
6.13 |
4.62 |
3.37 |
1.25 |
2.28 |
-7.33 |
-3.68 |
-3.64 |
| 1999-00 |
2.63 |
0.03 |
-0.35 |
0.37 |
4.63 |
-1.86 |
-4.31 |
2.45 |
| 2000-01 |
-0.01 |
-2.72 |
0.25 |
-2.97 |
7.15 |
1.88 |
1.73 |
0.15 |
| 2001-02 |
5.83 |
2.12 |
0.28 |
1.83 |
2.03 |
-1.89 |
-1.31 |
-0.58 |
| 2002-03 |
-6.83 |
-9.97 |
-5.09 |
-4.87 |
5.04 |
1.74 |
0.58 |
1.16 |
| 2003-04 |
8.66 |
5.93 |
3.48 |
2.45 |
6.36 |
1.44 |
-0.53 |
1.97 |
| 2004-05 |
0.18 |
-2.69 |
-3.29 |
0.60 |
7.36 |
-0.31 |
-1.04 |
0.73 |
| 2005-06 |
4.70 |
3.14 |
1.62 |
1.52 |
9.07 |
1.30 |
2.03 |
-0.73 |
| 2006-07 |
2.90 |
1.73 |
1.00 |
0.73 |
16.28 |
7.79 |
4.27 |
3.52 |
| 2007-08 |
5.36 |
3.93 |
3.32 |
0.60 |
7.17 |
-2.33 |
0.53 |
-2.86 |
| 2008-09 |
-0.24 |
-2.31 |
-0.27 |
-2.05 |
5.96 |
-0.93 |
-1.82 |
0.89 |
| 2009-10 |
-0.88 |
-2.82 |
-1.20 |
-1.62 |
10.66 |
3.17 |
2.65 |
0.52 |
| 2010-11 |
8.43 |
6.75 |
3.37 |
3.38 |
7.73 |
0.55 |
-1.87 |
2.42 |
| 2011-12 |
6.20 |
4.12 |
3.46 |
0.66 |
2.99 |
-3.05 |
-4.50 |
1.45 |
| 2012-13 |
1.48 |
0.13 |
1.94 |
-1.82 |
5.40 |
0.23 |
2.42 |
-2.19 |
| 2013-14 |
5.42 |
3.80 |
3.04 |
0.76 |
4.83 |
0.24 |
-0.24 |
0.49 |
| 2014-15 |
-0.22 |
-1.42 |
-0.10 |
-1.31 |
7.78 |
2.56 |
2.49 |
0.07 |
| 2015-16 |
0.65 |
0.03 |
0.60 |
-0.57 |
12.40 |
6.58 |
7.42 |
-0.84 |
| 2016-17 |
6.58 |
5.74 |
3.10 |
2.64 |
7.88 |
2.47 |
3.04 |
-0.57 |
| 2017-18 |
6.40 |
5.55 |
4.79 |
0.76 |
7.27 |
2.51 |
1.88 |
0.64 |
| 2018-19 |
2.07 |
-0.03 |
1.92 |
-1.95 |
6.30 |
1.74 |
-2.04 |
3.78 |
| 2019-20 |
5.37 |
-3.37 |
0.80 |
-4.17 |
-2.68 |
-8.05 |
-3.41 |
-4.64 |
| Mean |
3.15 |
1.02 |
1.06 |
-0.04 |
6.59 |
-0.10 |
-0.26 |
0.16 |
| Std Dev |
4.15 |
4.26 |
2.50 |
2.11 |
4.17 |
4.20 |
3.36 |
1.90 |
| Corr: VA_g and TFPG |
|
0.95 |
0.91 |
|
|
0.91 |
0.85 |
|
| Table A2. Differences in Adjusted TFP Growth for Major Sectors During 1981-82 to 2019-20 (Concld.) |
| Year |
Services |
Economy |
| VA_g |
TFPG |
Adj_ TFPG |
Diff (10)-(11) |
VA_g |
TFPG |
Adj_ TFPG |
Diff (14)-(15) |
| |
(9) |
(10) |
(11) |
(12) |
(13) |
(14) |
(15) |
(16) |
| 1981-82 |
5.68 |
2.06 |
0.86 |
1.20 |
5.59 |
1.17 |
0.30 |
0.86 |
| 1982-83 |
7.23 |
3.53 |
1.49 |
2.04 |
3.79 |
-1.04 |
-1.21 |
0.16 |
| 1983-84 |
6.22 |
2.18 |
2.03 |
0.16 |
8.21 |
3.43 |
2.54 |
0.89 |
| 1984-85 |
6.40 |
2.65 |
2.55 |
0.10 |
4.46 |
0.03 |
0.08 |
-0.05 |
| 1985-86 |
7.39 |
3.55 |
2.83 |
0.72 |
4.17 |
-0.19 |
0.10 |
-0.29 |
| 1986-87 |
7.60 |
3.54 |
3.03 |
0.51 |
4.80 |
0.53 |
0.25 |
0.28 |
| 1987-88 |
6.75 |
2.53 |
2.68 |
-0.15 |
3.82 |
-0.69 |
-0.33 |
-0.36 |
| 1988-89 |
7.03 |
1.82 |
2.30 |
-0.48 |
9.95 |
5.43 |
3.16 |
2.27 |
| 1989-90 |
8.21 |
2.43 |
2.19 |
0.24 |
6.25 |
1.46 |
1.15 |
0.31 |
| 1990-91 |
5.50 |
-0.53 |
0.45 |
-0.98 |
5.86 |
0.57 |
1.14 |
-0.56 |
| 1991-92 |
5.24 |
-0.19 |
0.52 |
-0.71 |
1.81 |
-2.84 |
-0.84 |
-2.00 |
| 1992-93 |
5.75 |
0.16 |
0.06 |
0.11 |
4.81 |
0.01 |
-0.55 |
0.56 |
| 1993-94 |
7.37 |
1.69 |
0.93 |
0.76 |
5.96 |
1.40 |
0.73 |
0.67 |
| 1994-95 |
5.61 |
0.45 |
0.56 |
-0.10 |
6.37 |
2.15 |
1.50 |
0.65 |
| 1995-96 |
9.08 |
3.73 |
2.25 |
1.48 |
6.99 |
2.16 |
1.52 |
0.63 |
| 1996-97 |
6.79 |
2.02 |
2.17 |
-0.15 |
8.05 |
3.26 |
2.97 |
0.29 |
| 1997-98 |
9.00 |
3.88 |
3.21 |
0.67 |
3.60 |
-1.12 |
-0.44 |
-0.68 |
| 1998-99 |
8.15 |
2.19 |
2.18 |
0.01 |
6.26 |
1.11 |
1.24 |
-0.13 |
| 1999-00 |
9.76 |
3.60 |
2.97 |
0.63 |
6.65 |
1.56 |
0.59 |
0.96 |
| 2000-01 |
5.86 |
-0.13 |
1.39 |
-1.52 |
4.44 |
-0.55 |
1.34 |
-1.89 |
| 2001-02 |
6.46 |
-0.43 |
0.30 |
-0.73 |
5.13 |
-0.53 |
-0.74 |
0.21 |
| 2002-03 |
6.71 |
0.86 |
0.64 |
0.23 |
3.45 |
-1.42 |
-0.30 |
-1.12 |
| 2003-04 |
7.69 |
1.31 |
0.88 |
0.43 |
7.73 |
2.33 |
1.32 |
1.01 |
| 2004-05 |
8.32 |
1.50 |
0.95 |
0.56 |
7.00 |
0.50 |
-0.54 |
1.04 |
| 2005-06 |
8.83 |
1.49 |
1.22 |
0.27 |
8.20 |
1.63 |
1.45 |
0.18 |
| 2006-07 |
6.74 |
-0.10 |
0.67 |
-0.78 |
8.00 |
1.32 |
1.18 |
0.14 |
| 2007-08 |
7.58 |
0.42 |
0.65 |
-0.23 |
7.34 |
0.19 |
0.76 |
-0.57 |
| 2008-09 |
6.38 |
-1.20 |
-0.68 |
-0.52 |
4.69 |
-2.10 |
-1.29 |
-0.81 |
| 2009-10 |
8.51 |
2.03 |
1.33 |
0.70 |
6.89 |
0.67 |
0.82 |
-0.15 |
| 2010-11 |
7.58 |
0.79 |
0.94 |
-0.15 |
7.77 |
1.40 |
0.22 |
1.19 |
| 2011-12 |
5.72 |
-1.58 |
-0.71 |
-0.87 |
5.15 |
-1.32 |
-1.39 |
0.07 |
| 2012-13 |
7.99 |
-0.21 |
0.46 |
-0.68 |
5.27 |
-0.91 |
0.29 |
-1.20 |
| 2013-14 |
7.34 |
1.37 |
1.22 |
0.15 |
5.85 |
1.00 |
0.52 |
0.47 |
| 2014-15 |
9.33 |
3.21 |
1.54 |
1.67 |
6.82 |
2.23 |
1.26 |
0.97 |
| 2015-16 |
8.91 |
2.57 |
2.45 |
0.13 |
7.48 |
2.74 |
2.99 |
-0.25 |
| 2016-17 |
8.08 |
1.68 |
1.89 |
-0.21 |
7.66 |
2.77 |
2.32 |
0.45 |
| 2017-18 |
6.18 |
-0.18 |
2.28 |
-2.46 |
6.15 |
1.36 |
2.46 |
-1.10 |
| 2018-19 |
6.89 |
-0.86 |
-0.35 |
-0.51 |
5.73 |
-0.26 |
-0.21 |
-0.04 |
| 2019-20 |
6.08 |
0.62 |
0.26 |
0.36 |
3.95 |
-2.13 |
-0.60 |
-1.53 |
| Mean |
7.23 |
1.40 |
1.35 |
0.05 |
5.95 |
0.70 |
0.66 |
0.04 |
| Std Dev |
1.19 |
1.51 |
1.05 |
0.85 |
1.69 |
1.72 |
1.22 |
0.89 |
| Corr: VA_g and TFPG |
|
0.63 |
0.50 |
|
|
0.88 |
0.75 |
|
| Source: Growth rate of real value added (VA_g) and standard TFP growth (TFPG) from the India KLEMS database and Adjusted TFPG (Adj_TFPG) from author’s computation. |
| Table A3. Growth Accounting of GVA Growth - Last Four Decades |
| Year |
India KLEMS Database |
Adjusted TFP |
| 1981- 1990 |
1991- 2000 |
2001- 2010 |
2011- 2019 |
1981- 1990 |
1991- 2000 |
2001- 2010 |
2011- 2019 |
| |
(1) |
(2) |
(3) |
(4) |
(5) |
(6) |
(7) |
(8) |
| Contribution to Employment Growth |
29 |
23 |
21 |
18 |
32 |
22 |
22 |
13 |
| Contribution to Labour Quality Growth |
6 |
4 |
5 |
3 |
6 |
4 |
5 |
3 |
| Contribution to Capital Accumulation Growth |
44 |
56 |
65 |
63 |
48 |
56 |
65 |
64 |
| Contribution to Capital Composition |
2 |
3 |
4 |
6 |
2 |
3 |
4 |
6 |
| Contribution to TFP Growth |
19 |
13 |
6 |
10 |
13 |
15 |
4 |
14 |
| |
100 |
100 |
100 |
100 |
100 |
100 |
100 |
100 |
| Source: Author’s computation based on the India KLEMS database. |
| Table A4. Differences in Adjusted TFP Growth for Various Industries in India - 1981-82 to 2019-20 (Contd.) |
| Year |
Agriculture |
Mining and Quarrying |
Food Products, Beverages & Tobacco |
| VA_g |
TFPG |
Adj_ TFPG |
Diff (2) - (3) |
VA_g |
TFPG |
Adj_ TFPG |
Diff (6) - (7) |
VA_g |
TFPG |
Adj_ TFPG |
Diff (10)-(11) |
| |
(1) |
(2) |
(3) |
(4) |
(5) |
(6) |
(7) |
(8) |
(9) |
(10) |
(11) |
(12) |
| 1981-82 |
4.5 |
2.1 |
1.2 |
0.9 |
12.8 |
1.4 |
0.1 |
1.3 |
16.7 |
11.0 |
5.0 |
6.0 |
| 1982-83 |
-0.3 |
-2.7 |
-1.5 |
-1.2 |
11.2 |
-9.8 |
-7.6 |
-2.2 |
15.1 |
10.7 |
3.4 |
7.4 |
| 1983-84 |
9.6 |
7.3 |
4.7 |
2.6 |
2.9 |
-11.5 |
-9.3 |
-2.2 |
19.7 |
15.0 |
20.9 |
-5.9 |
| 1984-85 |
1.6 |
0.2 |
0.4 |
-0.2 |
1.2 |
-9.7 |
-9.2 |
-0.5 |
-3.2 |
-7.9 |
-4.2 |
-3.7 |
| 1985-86 |
0.3 |
-0.9 |
0.3 |
-1.2 |
5.3 |
-5.5 |
-3.8 |
-1.7 |
0.0 |
-4.7 |
-2.4 |
-2.2 |
| 1986-87 |
-0.4 |
-1.7 |
-1.1 |
-0.6 |
11.6 |
2.2 |
1.4 |
0.9 |
4.0 |
-0.5 |
-0.3 |
-0.2 |
| 1987-88 |
-1.6 |
-3.4 |
-2.3 |
-1.1 |
3.7 |
-4.1 |
-3.5 |
-0.6 |
4.4 |
1.1 |
-3.0 |
4.1 |
| 1988-89 |
14.5 |
12.2 |
6.7 |
5.5 |
15.0 |
9.2 |
8.8 |
0.4 |
25.3 |
18.6 |
13.0 |
5.6 |
| 1989-90 |
1.2 |
-1.4 |
0.3 |
-1.6 |
7.3 |
-0.5 |
-0.2 |
-0.3 |
7.6 |
-0.3 |
1.6 |
-1.9 |
| 1990-91 |
3.9 |
0.4 |
2.1 |
-1.7 |
10.0 |
3.6 |
3.6 |
0.0 |
-7.3 |
-13.1 |
-6.1 |
-7.0 |
| 1991-92 |
-2.0 |
-4.5 |
-2.7 |
-1.7 |
3.3 |
-0.7 |
-0.9 |
0.2 |
0.5 |
-4.7 |
-4.3 |
-0.4 |
| 1992-93 |
6.4 |
3.4 |
1.8 |
1.5 |
0.9 |
-1.9 |
-0.9 |
-0.9 |
1.6 |
-3.8 |
-8.2 |
4.4 |
| 1993-94 |
3.3 |
0.7 |
0.2 |
0.5 |
1.4 |
-2.0 |
-2.0 |
-0.1 |
15.4 |
10.9 |
8.3 |
2.6 |
| 1994-95 |
4.6 |
3.2 |
2.2 |
1.0 |
8.9 |
-4.4 |
-4.6 |
0.2 |
13.7 |
8.6 |
8.3 |
0.3 |
| 1995-96 |
-0.7 |
-1.8 |
-0.7 |
-1.1 |
5.7 |
3.6 |
2.3 |
1.3 |
0.4 |
-7.4 |
-6.1 |
-1.3 |
| 1996-97 |
9.5 |
8.3 |
5.6 |
2.7 |
0.6 |
2.3 |
4.0 |
-1.7 |
3.7 |
-2.1 |
-2.8 |
0.7 |
| 1997-98 |
-2.6 |
-3.9 |
-1.7 |
-2.2 |
9.4 |
10.3 |
9.2 |
1.0 |
13.0 |
7.5 |
7.7 |
-0.2 |
| 1998-99 |
6.1 |
4.6 |
3.4 |
1.3 |
2.8 |
3.8 |
4.9 |
-1.1 |
1.6 |
-1.5 |
-0.4 |
-1.1 |
| 1999-00 |
2.6 |
0.0 |
-0.3 |
0.4 |
4.1 |
2.7 |
1.9 |
0.8 |
3.4 |
-4.5 |
-4.0 |
-0.5 |
| 2000-01 |
0.0 |
-2.7 |
0.2 |
-3.0 |
2.3 |
2.6 |
2.5 |
0.1 |
7.9 |
3.1 |
1.1 |
2.0 |
| 2001-02 |
5.8 |
2.1 |
0.3 |
1.8 |
1.8 |
1.9 |
2.8 |
-0.9 |
-0.3 |
-1.6 |
-1.0 |
-0.6 |
| 2002-03 |
-6.8 |
-10.0 |
-5.1 |
-4.9 |
8.1 |
7.5 |
5.5 |
2.0 |
12.6 |
9.3 |
4.1 |
5.1 |
| 2003-04 |
8.7 |
5.9 |
3.5 |
2.5 |
2.7 |
3.2 |
3.1 |
0.0 |
3.3 |
-0.9 |
-0.5 |
-0.4 |
| 2004-05 |
0.2 |
-2.7 |
-3.3 |
0.6 |
7.6 |
-2.3 |
-1.2 |
-1.1 |
3.0 |
-3.3 |
-1.4 |
-2.0 |
| 2005-06 |
4.7 |
3.1 |
1.6 |
1.5 |
5.9 |
-4.4 |
-3.2 |
-1.2 |
11.2 |
7.2 |
7.2 |
0.0 |
| 2006-07 |
2.9 |
1.7 |
1.0 |
0.7 |
4.6 |
-7.8 |
-7.3 |
-0.4 |
27.6 |
18.9 |
9.6 |
9.3 |
| 2007-08 |
5.4 |
3.9 |
3.3 |
0.6 |
4.5 |
-7.6 |
-8.0 |
0.4 |
3.2 |
-5.1 |
-0.2 |
-4.8 |
| 2008-09 |
-0.2 |
-2.3 |
-0.3 |
-2.0 |
-2.5 |
-12.2 |
-9.9 |
-2.4 |
3.7 |
-0.2 |
2.3 |
-2.5 |
| 2009-10 |
-0.9 |
-2.8 |
-1.2 |
-1.6 |
5.8 |
-1.8 |
0.5 |
-2.3 |
4.4 |
-1.0 |
-2.0 |
1.0 |
| 2010-11 |
8.4 |
6.8 |
3.4 |
3.4 |
12.6 |
3.6 |
0.4 |
3.2 |
-11.5 |
-18.1 |
-11.1 |
-7.0 |
| 2011-12 |
6.2 |
4.1 |
3.5 |
0.7 |
-19.3 |
-27.0 |
-21.2 |
-5.9 |
15.7 |
9.9 |
4.4 |
5.5 |
| 2012-13 |
1.5 |
0.1 |
1.9 |
-1.8 |
0.6 |
-5.7 |
-6.9 |
1.2 |
-8.1 |
-11.4 |
-5.9 |
-5.5 |
| 2013-14 |
5.4 |
3.8 |
3.0 |
0.8 |
0.2 |
-12.5 |
-14.9 |
2.4 |
-0.6 |
-2.6 |
-7.1 |
4.6 |
| 2014-15 |
-0.2 |
-1.4 |
-0.1 |
-1.3 |
9.3 |
8.4 |
7.3 |
1.1 |
2.6 |
-0.4 |
-2.8 |
2.4 |
| 2015-16 |
0.6 |
0.0 |
0.6 |
-0.6 |
9.7 |
11.0 |
9.6 |
1.4 |
15.0 |
12.3 |
15.1 |
-2.8 |
| 2016-17 |
6.6 |
5.7 |
3.1 |
2.6 |
9.4 |
9.1 |
5.4 |
3.7 |
10.3 |
8.0 |
5.8 |
2.3 |
| 2017-18 |
6.4 |
5.5 |
4.8 |
0.8 |
-5.8 |
-7.5 |
0.7 |
-8.2 |
5.5 |
1.9 |
2.6 |
-0.7 |
| 2018-19 |
2.1 |
0.0 |
1.9 |
-2.0 |
-0.9 |
-4.8 |
-2.1 |
-2.8 |
18.8 |
14.9 |
10.3 |
4.6 |
| 2019-20 |
5.4 |
-3.4 |
0.8 |
-4.2 |
-1.6 |
1.4 |
-5.0 |
6.4 |
-4.2 |
-8.3 |
-2.5 |
-5.8 |
| Mean |
3.1 |
1.0 |
1.1 |
-0.0 |
4.4 |
-1.4 |
-1.2 |
-0.2 |
6.5 |
1.7 |
1.4 |
0.3 |
| Std Dev |
4.1 |
4.3 |
2.5 |
2.1 |
6.1 |
7.7 |
6.6 |
|
8.9 |
8.8 |
6.8 |
|
| Corr: VA_g and TFPG |
|
0.95 |
0.91 |
|
|
0.69 |
0.61 |
|
|
0.98 |
0.88 |
|
| Table A4. Differences in Adjusted TFP Growth for Various Industries in India - 1981-82 to 2019-20 (Contd.) |
| Year |
Textiles & Leather |
Wood & Wood Products |
Paper & Paper Products |
| VA_g |
TFPG |
Adj_ TFPG |
Diff (14)-(15) |
VA_g |
TFPG |
Adj_ TFPG |
Diff (18)-(19) |
VA_g |
TFPG |
Adj_ TFPG |
Diff (22)-(23) |
| |
(13) |
(14) |
(15) |
(16) |
(17) |
(18) |
(19) |
(20) |
(21) |
(22) |
(23) |
(24) |
| 1981-82 |
-2.6 |
-8.8 |
-7.1 |
-1.7 |
1.5 |
-9.7 |
-8.8 |
-1.0 |
8.2 |
-1.5 |
0.7 |
-2.2 |
| 1982-83 |
-0.5 |
-8.4 |
-7.4 |
-1.1 |
-12.0 |
-18.8 |
-14.1 |
-4.8 |
-7.7 |
-14.7 |
-9.5 |
-5.2 |
| 1983-84 |
10.1 |
3.5 |
2.3 |
1.2 |
7.1 |
-2.9 |
-7.1 |
4.2 |
14.4 |
7.2 |
7.6 |
-0.3 |
| 1984-85 |
2.1 |
-3.9 |
-3.9 |
-0.0 |
-14.1 |
-18.9 |
-16.6 |
-2.3 |
15.9 |
5.9 |
5.2 |
0.7 |
| 1985-86 |
7.3 |
1.9 |
-3.1 |
4.9 |
3.3 |
-1.0 |
1.1 |
-2.1 |
-2.9 |
-12.1 |
-9.1 |
-3.1 |
| 1986-87 |
7.1 |
3.0 |
4.3 |
-1.3 |
-2.8 |
-5.4 |
-5.5 |
0.1 |
17.9 |
9.6 |
8.4 |
1.2 |
| 1987-88 |
-4.0 |
-8.4 |
-5.2 |
-3.3 |
1.5 |
0.1 |
-3.0 |
3.1 |
-0.9 |
-6.3 |
-1.0 |
-5.3 |
| 1988-89 |
1.3 |
-1.1 |
-3.4 |
2.3 |
-11.9 |
-16.9 |
-15.6 |
-1.2 |
10.4 |
3.7 |
0.6 |
3.1 |
| 1989-90 |
16.8 |
13.4 |
5.0 |
8.3 |
5.0 |
0.2 |
-4.2 |
4.4 |
18.8 |
11.9 |
8.3 |
3.7 |
| 1990-91 |
8.2 |
3.3 |
5.6 |
-2.3 |
0.3 |
-2.5 |
-7.3 |
4.9 |
6.6 |
1.7 |
2.6 |
-0.9 |
| 1991-92 |
-2.9 |
-7.4 |
-1.2 |
-6.2 |
-6.1 |
-7.4 |
-6.3 |
-1.1 |
4.6 |
2.5 |
2.6 |
-0.1 |
| 1992-93 |
0.8 |
-3.8 |
-4.0 |
0.2 |
-11.1 |
-13.1 |
-7.2 |
-5.9 |
-23.8 |
-26.1 |
-13.4 |
-12.7 |
| 1993-94 |
23.9 |
18.3 |
11.6 |
6.7 |
2.7 |
-0.6 |
-6.7 |
6.1 |
16.6 |
14.1 |
5.8 |
8.3 |
| 1994-95 |
5.3 |
-1.8 |
0.1 |
-1.9 |
-0.5 |
-5.0 |
-7.4 |
2.5 |
10.1 |
3.8 |
-1.5 |
5.3 |
| 1995-96 |
-8.4 |
-18.1 |
-8.0 |
-10.2 |
18.0 |
6.7 |
4.1 |
2.6 |
5.3 |
0.9 |
4.2 |
-3.3 |
| 1996-97 |
20.1 |
11.5 |
6.0 |
5.6 |
11.7 |
2.2 |
-1.0 |
3.2 |
1.8 |
-2.4 |
-2.4 |
0.0 |
| 1997-98 |
5.2 |
-4.5 |
-6.1 |
1.6 |
-12.9 |
-22.0 |
-12.4 |
-9.6 |
-13.1 |
-17.9 |
-13.8 |
-4.0 |
| 1998-99 |
-6.8 |
-11.6 |
-3.5 |
-8.1 |
-1.1 |
-12.0 |
-12.4 |
0.4 |
4.6 |
0.7 |
0.3 |
0.4 |
| 1999-00 |
5.7 |
-1.1 |
-4.0 |
2.9 |
-14.8 |
-24.3 |
-21.3 |
-3.0 |
-1.8 |
-4.8 |
-4.7 |
-0.2 |
| 2000-01 |
9.1 |
4.1 |
2.7 |
1.4 |
6.2 |
-4.3 |
-4.6 |
0.3 |
-8.4 |
-12.3 |
-8.0 |
-4.3 |
| 2001-02 |
-2.1 |
-4.5 |
-2.3 |
-2.2 |
-14.3 |
-18.4 |
-17.0 |
-1.4 |
3.8 |
-1.7 |
-7.0 |
5.3 |
| 2002-03 |
6.5 |
0.9 |
0.4 |
0.6 |
-16.7 |
-22.9 |
-17.5 |
-5.5 |
7.1 |
1.6 |
-1.8 |
3.4 |
| 2003-04 |
-1.7 |
-8.3 |
-6.1 |
-2.1 |
3.8 |
-2.9 |
-8.3 |
5.4 |
14.7 |
10.3 |
2.7 |
7.6 |
| 2004-05 |
10.8 |
1.0 |
-1.7 |
2.7 |
-9.2 |
-16.3 |
-14.7 |
-1.5 |
9.6 |
4.0 |
1.3 |
2.7 |
| 2005-06 |
15.2 |
9.5 |
3.0 |
6.5 |
21.6 |
21.0 |
7.1 |
14.0 |
16.4 |
13.5 |
12.2 |
1.3 |
| 2006-07 |
17.7 |
8.5 |
3.9 |
4.6 |
8.5 |
5.4 |
4.1 |
1.3 |
13.6 |
9.7 |
6.2 |
3.5 |
| 2007-08 |
-3.0 |
-10.1 |
0.4 |
-10.5 |
-11.1 |
-14.1 |
-2.4 |
-11.7 |
15.9 |
11.8 |
8.9 |
2.9 |
| 2008-09 |
12.3 |
10.9 |
5.8 |
5.1 |
9.5 |
9.7 |
2.5 |
7.2 |
-5.8 |
-7.7 |
-3.8 |
-4.0 |
| 2009-10 |
13.0 |
9.8 |
6.4 |
3.4 |
7.3 |
4.8 |
2.9 |
1.9 |
4.8 |
2.8 |
3.4 |
-0.6 |
| 2010-11 |
6.4 |
1.2 |
0.8 |
0.4 |
8.9 |
5.0 |
1.9 |
3.1 |
26.3 |
24.8 |
16.5 |
8.3 |
| 2011-12 |
1.3 |
-0.7 |
0.2 |
-0.9 |
10.9 |
10.3 |
12.0 |
-1.6 |
-4.8 |
-5.4 |
-4.5 |
-0.9 |
| 2012-13 |
14.6 |
12.1 |
12.7 |
-0.5 |
-2.1 |
-1.7 |
2.2 |
-3.8 |
-11.5 |
-13.3 |
-5.0 |
-8.3 |
| 2013-14 |
19.9 |
17.9 |
7.6 |
10.3 |
-14.8 |
-13.4 |
-6.1 |
-7.3 |
-1.4 |
-2.8 |
-1.8 |
-1.0 |
| 2014-15 |
0.0 |
0.1 |
5.7 |
-5.7 |
29.3 |
30.1 |
20.1 |
10.0 |
14.3 |
12.5 |
4.3 |
8.2 |
| 2015-16 |
17.9 |
15.2 |
13.9 |
1.3 |
9.7 |
9.4 |
10.5 |
-1.0 |
11.8 |
10.6 |
14.4 |
-3.9 |
| 2016-17 |
0.8 |
-1.3 |
0.7 |
-2.0 |
9.8 |
9.5 |
9.4 |
0.2 |
5.2 |
4.9 |
4.1 |
0.8 |
| 2017-18 |
7.3 |
4.5 |
4.4 |
0.1 |
-2.2 |
-3.9 |
2.2 |
-6.0 |
12.7 |
10.5 |
8.6 |
1.9 |
| 2018-19 |
6.6 |
8.8 |
4.8 |
4.0 |
15.5 |
15.7 |
9.0 |
6.7 |
9.2 |
6.0 |
2.1 |
3.9 |
| 2019-20 |
-2.1 |
-2.3 |
0.9 |
-3.1 |
7.0 |
3.9 |
6.3 |
-2.5 |
-3.2 |
-2.4 |
0.1 |
-2.5 |
| Mean |
6.1 |
1.4 |
1.1 |
0.3 |
1.1 |
-3.2 |
-3.4 |
0.2 |
5.5 |
1.4 |
1.1 |
0.3 |
| Std Dev |
8.1 |
8.6 |
5.5 |
|
11.2 |
12.4 |
9.4 |
|
10.4 |
10.2 |
7.0 |
|
| Corr: VA_g and TFPG |
|
0.94 |
0.77 |
|
|
0.95 |
0.84 |
|
|
0.97 |
0.88 |
|
| Table A4. Differences in Adjusted TFP Growth for Various Industries in India - 1981-82 to 2019-20 (Contd.) |
| Year |
Petroleum Products |
Chemicals & Chemical Products |
Rubber & Plastic Products |
| VA_g |
TFPG |
Adj_ TFPG |
Diff (26)-(27) |
VA_g |
TFPG |
Adj_ TFPG |
Diff (30)-(31) |
VA_g |
TFPG |
Adj_ TFPG |
Diff (34)-(35) |
| |
(25) |
(26) |
(27) |
(28) |
(29) |
(30) |
(31) |
(32) |
(33) |
(34) |
(35) |
(36) |
| 1981-82 |
-3.2 |
-50.8 |
-36.4 |
-14.3 |
16.9 |
15.9 |
6.9 |
9.0 |
-10.6 |
-25.1 |
-15.0 |
-10.1 |
| 1982-83 |
43.0 |
14.4 |
11.0 |
3.4 |
3.4 |
2.2 |
2.9 |
-0.7 |
24.9 |
8.7 |
5.3 |
3.4 |
| 1983-84 |
7.0 |
-17.5 |
-10.7 |
-6.9 |
20.8 |
17.0 |
14.9 |
2.1 |
0.6 |
-23.8 |
-22.4 |
-1.4 |
| 1984-85 |
16.3 |
-4.6 |
-2.8 |
-1.9 |
4.0 |
0.4 |
-3.1 |
3.5 |
4.0 |
-14.6 |
-11.0 |
-3.6 |
| 1985-86 |
2.7 |
-9.1 |
-8.8 |
-0.3 |
4.1 |
0.5 |
0.3 |
0.1 |
-4.8 |
-17.6 |
-9.1 |
-8.5 |
| 1986-87 |
32.4 |
23.7 |
20.4 |
3.4 |
1.7 |
-4.3 |
-4.3 |
-0.1 |
51.5 |
40.6 |
31.7 |
8.9 |
| 1987-88 |
16.7 |
12.2 |
8.8 |
3.4 |
9.4 |
4.5 |
5.4 |
-0.9 |
-0.9 |
-11.8 |
-13.1 |
1.3 |
| 1988-89 |
12.1 |
4.6 |
-2.0 |
6.6 |
13.2 |
8.5 |
5.4 |
3.1 |
28.9 |
19.3 |
14.3 |
5.0 |
| 1989-90 |
11.6 |
5.5 |
3.4 |
2.1 |
16.9 |
10.8 |
6.8 |
4.0 |
-5.6 |
-14.2 |
-15.4 |
1.2 |
| 1990-91 |
11.6 |
0.3 |
-7.4 |
7.7 |
10.0 |
4.4 |
4.5 |
-0.1 |
30.7 |
17.9 |
13.7 |
4.2 |
| 1991-92 |
-3.2 |
-15.7 |
-10.5 |
-5.2 |
2.5 |
-3.1 |
-0.4 |
-2.7 |
6.0 |
-13.0 |
-13.5 |
0.5 |
| 1992-93 |
4.1 |
-5.0 |
5.5 |
-10.5 |
16.3 |
11.3 |
11.1 |
0.2 |
7.0 |
-5.3 |
1.8 |
-7.1 |
| 1993-94 |
11.2 |
3.4 |
-1.8 |
5.2 |
7.2 |
1.8 |
2.9 |
-1.2 |
11.7 |
-3.4 |
-3.4 |
-0.0 |
| 1994-95 |
5.8 |
4.4 |
-0.4 |
4.8 |
4.0 |
0.9 |
0.8 |
0.1 |
-2.9 |
-9.8 |
-8.9 |
-0.9 |
| 1995-96 |
15.9 |
11.9 |
4.4 |
7.5 |
24.1 |
11.5 |
10.0 |
1.5 |
3.7 |
-15.1 |
-8.1 |
-7.0 |
| 1996-97 |
23.4 |
7.3 |
8.8 |
-1.5 |
10.5 |
1.9 |
0.8 |
1.0 |
41.4 |
3.0 |
-0.6 |
3.7 |
| 1997-98 |
-17.2 |
-27.2 |
-20.6 |
-6.6 |
-4.8 |
-19.0 |
-15.1 |
-3.9 |
-1.2 |
-8.5 |
-8.0 |
-0.5 |
| 1998-99 |
-2.1 |
-48.8 |
-36.1 |
-12.7 |
17.3 |
11.7 |
13.5 |
-1.8 |
5.5 |
2.9 |
-0.2 |
3.1 |
| 1999-00 |
-8.2 |
-27.6 |
-28.8 |
1.2 |
1.2 |
-4.5 |
-4.7 |
0.2 |
5.8 |
1.8 |
-0.1 |
1.8 |
| 2000-01 |
3.9 |
-10.4 |
-13.4 |
3.1 |
8.1 |
4.5 |
3.4 |
1.0 |
38.5 |
36.4 |
33.5 |
3.0 |
| 2001-02 |
12.1 |
-23.2 |
-16.1 |
-7.1 |
5.5 |
5.6 |
4.9 |
0.7 |
9.5 |
10.8 |
8.5 |
2.2 |
| 2002-03 |
18.7 |
14.3 |
13.3 |
1.0 |
4.1 |
3.2 |
2.6 |
0.6 |
-38.0 |
-38.7 |
-28.9 |
-9.8 |
| 2003-04 |
6.3 |
2.4 |
-1.0 |
3.5 |
7.7 |
6.9 |
4.1 |
2.8 |
-5.8 |
-10.2 |
-11.6 |
1.4 |
| 2004-05 |
1.0 |
-0.5 |
-4.0 |
3.6 |
13.8 |
10.6 |
6.4 |
4.2 |
7.4 |
-3.8 |
-6.4 |
2.6 |
| 2005-06 |
-10.0 |
-25.2 |
-12.4 |
-12.7 |
5.3 |
-1.2 |
0.8 |
-2.0 |
-26.8 |
-31.2 |
-16.3 |
-14.9 |
| 2006-07 |
11.8 |
9.3 |
1.3 |
8.0 |
11.2 |
3.4 |
3.0 |
0.4 |
9.1 |
1.3 |
-3.0 |
4.3 |
| 2007-08 |
25.2 |
22.6 |
8.1 |
14.5 |
7.6 |
0.5 |
2.1 |
-1.5 |
28.2 |
18.7 |
9.8 |
8.8 |
| 2008-09 |
-10.3 |
-14.5 |
-11.9 |
-2.6 |
-8.5 |
-16.3 |
-8.8 |
-7.5 |
28.5 |
21.2 |
17.3 |
3.9 |
| 2009-10 |
8.3 |
-9.1 |
-14.9 |
5.8 |
5.9 |
2.9 |
7.2 |
-4.3 |
28.7 |
19.8 |
9.8 |
10.0 |
| 2010-11 |
8.4 |
4.0 |
-0.9 |
4.9 |
5.1 |
0.8 |
-6.1 |
6.8 |
23.4 |
13.7 |
12.8 |
0.8 |
| 2011-12 |
-33.4 |
-42.9 |
-48.1 |
5.2 |
11.4 |
6.2 |
3.3 |
2.9 |
-21.9 |
-29.8 |
-27.2 |
-2.5 |
| 2012-13 |
55.0 |
53.1 |
50.6 |
2.5 |
-6.7 |
-13.5 |
-9.5 |
-4.0 |
-6.5 |
-9.4 |
-8.8 |
-0.7 |
| 2013-14 |
4.8 |
-11.1 |
-4.1 |
-7.0 |
3.2 |
-1.7 |
-1.6 |
-0.1 |
26.2 |
23.8 |
22.9 |
0.9 |
| 2014-15 |
37.8 |
17.3 |
25.0 |
-7.7 |
4.1 |
-1.3 |
-2.8 |
1.5 |
4.7 |
1.5 |
-2.8 |
4.2 |
| 2015-16 |
15.2 |
-4.4 |
9.3 |
-13.7 |
7.7 |
-0.7 |
-1.2 |
0.5 |
24.9 |
20.1 |
19.3 |
0.8 |
| 2016-17 |
-8.8 |
-24.7 |
-20.8 |
-3.8 |
10.5 |
0.0 |
4.8 |
-4.8 |
14.0 |
8.2 |
8.3 |
-0.1 |
| 2017-18 |
0.7 |
-8.5 |
-9.0 |
0.6 |
3.5 |
-2.9 |
-2.9 |
-0.0 |
-0.5 |
-7.1 |
-4.0 |
-3.1 |
| 2018-19 |
-38.3 |
-44.5 |
-50.2 |
5.7 |
13.4 |
6.6 |
0.4 |
6.2 |
10.6 |
0.6 |
-2.1 |
2.8 |
| 2019-20 |
-18.0 |
-26.7 |
-24.2 |
-2.6 |
1.9 |
-6.2 |
-0.4 |
-5.9 |
-2.4 |
-9.9 |
-4.5 |
-5.4 |
| Mean |
6.9 |
-6.2 |
-5.8 |
-0.3 |
7.5 |
2.0 |
1.8 |
0.3 |
8.9 |
-0.8 |
-0.9 |
0.1 |
| Std Dev |
18.3 |
21.6 |
19.3 |
|
6.9 |
7.7 |
6.1 |
|
18.6 |
18.2 |
14.6 |
|
| Corr: VA_g and TFPG |
|
0.85 |
0.90 |
|
|
0.92 |
0.86 |
|
|
0.92 |
0.88 |
|
| Table A4. Differences in Adjusted TFP Growth for Various Industries in India - 1981-82 to 2019-20 (Contd.) |
| Year |
Other Non-Metallic Mineral Products |
Basic Metals & Metal Products |
Machinery, nec. |
| VA_g |
TFPG |
Adj_ TFPG |
Diff (38)-(39) |
VA_g |
TFPG |
Adj_ TFPG |
Diff (42)-(43) |
VA_g |
TFPG |
Adj_ TFPG |
Diff (46)-(47) |
| |
(37) |
(38) |
(39) |
(40) |
(41) |
(42) |
(43) |
(44) |
(45) |
(46) |
(47) |
(48) |
| 1981-82 |
7.6 |
-2.7 |
-4.1 |
1.3 |
7.4 |
0.4 |
-0.7 |
1.1 |
5.3 |
-3.6 |
-3.3 |
-0.3 |
| 1982-83 |
18.8 |
6.9 |
3.8 |
3.1 |
0.3 |
-7.3 |
-6.9 |
-0.4 |
4.0 |
-6.8 |
-4.7 |
-2.0 |
| 1983-84 |
11.7 |
-1.9 |
-1.4 |
-0.5 |
7.4 |
2.1 |
5.7 |
-3.5 |
15.3 |
5.9 |
4.6 |
1.2 |
| 1984-85 |
19.7 |
7.6 |
2.1 |
5.5 |
1.6 |
-6.4 |
-10.9 |
4.5 |
17.9 |
9.1 |
5.1 |
4.0 |
| 1985-86 |
5.3 |
-8.4 |
-5.7 |
-2.7 |
5.1 |
-1.9 |
-0.6 |
-1.4 |
5.7 |
-4.7 |
-4.0 |
-0.7 |
| 1986-87 |
-3.0 |
-15.7 |
-11.4 |
-4.3 |
-6.4 |
-10.9 |
-11.2 |
0.3 |
0.3 |
-3.9 |
-3.5 |
-0.4 |
| 1987-88 |
11.7 |
-0.5 |
-1.3 |
0.9 |
11.1 |
3.7 |
2.1 |
1.7 |
9.6 |
6.6 |
5.1 |
1.6 |
| 1988-89 |
9.0 |
-0.2 |
-2.7 |
2.4 |
17.6 |
13.5 |
10.3 |
3.3 |
-4.2 |
-10.9 |
-7.1 |
-3.8 |
| 1989-90 |
17.0 |
10.6 |
7.3 |
3.3 |
-4.4 |
-9.1 |
-9.7 |
0.6 |
15.0 |
5.4 |
2.4 |
3.0 |
| 1990-91 |
11.2 |
6.6 |
6.0 |
0.6 |
12.8 |
4.7 |
4.7 |
-0.0 |
-1.7 |
-11.0 |
-10.4 |
-0.6 |
| 1991-92 |
5.1 |
1.5 |
0.8 |
0.8 |
3.4 |
-7.5 |
-6.7 |
-0.9 |
-9.1 |
-17.0 |
-13.8 |
-3.3 |
| 1992-93 |
-15.3 |
-22.1 |
-17.3 |
-4.9 |
-5.3 |
-13.1 |
-11.0 |
-2.1 |
9.6 |
-0.5 |
-2.3 |
1.8 |
| 1993-94 |
-1.8 |
-8.0 |
-5.7 |
-2.3 |
3.0 |
-2.5 |
1.1 |
-3.7 |
-3.4 |
-8.4 |
-6.3 |
-2.1 |
| 1994-95 |
10.7 |
4.9 |
1.9 |
3.0 |
18.1 |
11.6 |
8.3 |
3.2 |
8.0 |
3.1 |
-1.0 |
4.1 |
| 1995-96 |
22.3 |
10.4 |
9.5 |
0.9 |
18.4 |
10.4 |
7.3 |
3.1 |
31.5 |
20.7 |
13.9 |
6.7 |
| 1996-97 |
27.9 |
14.3 |
11.5 |
2.8 |
7.3 |
0.8 |
3.9 |
-3.1 |
8.5 |
-1.8 |
1.2 |
-2.9 |
| 1997-98 |
-16.6 |
-30.0 |
-21.2 |
-8.8 |
-3.7 |
-13.0 |
-12.9 |
-0.1 |
-16.4 |
-24.9 |
-15.6 |
-9.3 |
| 1998-99 |
-10.1 |
-20.4 |
-12.9 |
-7.5 |
4.2 |
-8.5 |
-3.0 |
-5.4 |
12.3 |
-0.0 |
-4.4 |
4.4 |
| 1999-00 |
32.5 |
25.0 |
12.0 |
13.0 |
4.3 |
5.1 |
-0.0 |
5.1 |
0.2 |
-6.3 |
-4.7 |
-1.7 |
| 2000-01 |
0.1 |
-9.5 |
-3.9 |
-5.6 |
5.0 |
3.7 |
2.2 |
1.5 |
3.6 |
-1.7 |
0.1 |
-1.8 |
| 2001-02 |
1.9 |
-6.8 |
-2.8 |
-4.0 |
1.3 |
2.0 |
0.9 |
1.1 |
-10.2 |
-11.1 |
-8.7 |
-2.4 |
| 2002-03 |
5.5 |
0.0 |
0.4 |
-0.4 |
11.0 |
11.1 |
5.4 |
5.7 |
6.9 |
2.4 |
-2.0 |
4.4 |
| 2003-04 |
3.5 |
-2.1 |
-2.6 |
0.5 |
7.3 |
1.2 |
0.0 |
1.2 |
8.4 |
2.4 |
1.5 |
0.9 |
| 2004-05 |
1.4 |
-7.5 |
-5.6 |
-1.9 |
5.1 |
-3.6 |
-1.6 |
-2.0 |
14.3 |
2.5 |
2.6 |
-0.0 |
| 2005-06 |
14.2 |
10.0 |
2.3 |
7.7 |
4.3 |
-5.8 |
-6.6 |
0.8 |
18.5 |
8.6 |
3.8 |
4.8 |
| 2006-07 |
11.0 |
3.3 |
0.6 |
2.7 |
22.2 |
11.1 |
8.1 |
2.9 |
12.2 |
0.9 |
5.1 |
-4.2 |
| 2007-08 |
-3.0 |
-14.2 |
-8.1 |
-6.1 |
8.9 |
-4.2 |
0.4 |
-4.5 |
7.2 |
-4.6 |
-1.4 |
-3.2 |
| 2008-09 |
12.6 |
2.7 |
2.3 |
0.4 |
-3.5 |
-14.4 |
-11.3 |
-3.1 |
40.3 |
33.1 |
13.6 |
19.5 |
| 2009-10 |
3.8 |
-2.4 |
-1.7 |
-0.7 |
12.3 |
1.1 |
4.3 |
-3.2 |
-5.1 |
-12.0 |
1.0 |
-13.0 |
| 2010-11 |
11.4 |
6.0 |
-6.5 |
12.4 |
10.9 |
-1.0 |
-3.9 |
2.9 |
9.5 |
-1.0 |
-6.2 |
5.2 |
| 2011-12 |
13.0 |
7.5 |
3.6 |
3.9 |
-3.5 |
-10.7 |
-10.8 |
0.2 |
16.4 |
9.5 |
6.7 |
2.8 |
| 2012-13 |
1.2 |
-2.6 |
-3.7 |
1.0 |
3.8 |
-2.2 |
-0.2 |
-2.0 |
-3.0 |
-9.6 |
-4.6 |
-5.1 |
| 2013-14 |
-7.4 |
-8.9 |
-5.6 |
-3.4 |
15.1 |
9.8 |
8.7 |
1.0 |
-14.5 |
-19.3 |
-13.0 |
-6.3 |
| 2014-15 |
12.0 |
8.7 |
0.9 |
7.9 |
-6.0 |
-9.9 |
-8.8 |
-1.1 |
9.8 |
3.0 |
-1.6 |
4.7 |
| 2015-16 |
8.0 |
5.8 |
6.4 |
-0.6 |
-14.8 |
-18.4 |
-19.1 |
0.7 |
7.2 |
0.5 |
-0.5 |
1.0 |
| 2016-17 |
19.8 |
18.3 |
13.0 |
5.3 |
23.5 |
23.1 |
22.2 |
0.9 |
19.0 |
11.1 |
6.6 |
4.5 |
| 2017-18 |
-0.8 |
-3.6 |
-3.8 |
0.2 |
11.5 |
11.6 |
5.6 |
6.0 |
14.5 |
3.8 |
5.1 |
-1.3 |
| 2018-19 |
7.1 |
3.2 |
-1.4 |
4.6 |
2.0 |
1.1 |
-3.6 |
4.7 |
2.3 |
-9.7 |
-9.5 |
-0.2 |
| 2019-20 |
4.5 |
0.3 |
4.9 |
-4.6 |
-0.9 |
-1.2 |
-1.3 |
0.1 |
-7.0 |
-17.9 |
-12.6 |
-5.2 |
| Mean |
7.3 |
-0.4 |
-1.0 |
0.7 |
5.6 |
-0.6 |
-1.0 |
0.4 |
6.6 |
-1.5 |
-1.6 |
0.1 |
| Std Dev |
10.5 |
11.0 |
7.4 |
|
8.4 |
9.0 |
8.1 |
|
11.4 |
10.9 |
6.9 |
|
| Corr: VA_g and TFPG |
|
0.94 |
0.89 |
|
|
0.90 |
0.91 |
|
|
0.97 |
0.90 |
|
| Note: ‘Machinery nec.’ includes machinery not elsewhere classified. |
| Table A4. Differences in Adjusted TFP Growth for Various Industries in India - 1981-82 to 2019-20 (Contd.) |
| Year |
Electrical Equipments |
Transport Equipments |
Manufacturing, nec. |
| VA_g |
TFPG |
Adj_ TFPG |
Diff (50)-(51) |
VA_g |
TFPG |
Adj_ TFPG |
Diff (54)-(55) |
VA_g |
TFPG |
Adj_ TFPG |
Diff (58)-(59) |
| |
(49) |
(50) |
(51) |
(52) |
(53) |
(54) |
(55) |
(56) |
(57) |
(58) |
(59) |
(60) |
| 1981-82 |
7.4 |
4.2 |
9.0 |
-4.8 |
12.1 |
8.5 |
3.4 |
5.2 |
14.4 |
2.0 |
-0.3 |
2.3 |
| 1982-83 |
23.3 |
18.6 |
17.8 |
0.8 |
11.6 |
4.2 |
2.4 |
1.9 |
-5.7 |
-9.3 |
-3.9 |
-5.4 |
| 1983-84 |
9.2 |
4.6 |
11.2 |
-6.6 |
8.9 |
2.7 |
3.6 |
-0.9 |
18.8 |
14.2 |
5.0 |
9.2 |
| 1984-85 |
22.3 |
16.3 |
14.6 |
1.7 |
9.9 |
-2.0 |
-3.0 |
1.0 |
-1.3 |
-8.8 |
-6.4 |
-2.4 |
| 1985-86 |
-12.6 |
-18.8 |
-14.1 |
-4.6 |
-11.5 |
-21.8 |
-16.8 |
-5.0 |
31.3 |
22.2 |
15.0 |
7.3 |
| 1986-87 |
20.0 |
13.3 |
13.1 |
0.2 |
17.1 |
8.5 |
2.8 |
5.6 |
-16.1 |
-23.7 |
-11.2 |
-12.5 |
| 1987-88 |
16.5 |
7.4 |
3.9 |
3.4 |
-6.4 |
-14.5 |
-12.4 |
-2.1 |
2.1 |
-2.7 |
-3.9 |
1.2 |
| 1988-89 |
-2.5 |
-12.8 |
-12.0 |
-0.8 |
7.2 |
1.6 |
-3.1 |
4.7 |
-10.2 |
-17.8 |
-18.1 |
0.3 |
| 1989-90 |
19.1 |
13.0 |
13.3 |
-0.3 |
9.9 |
5.3 |
1.2 |
4.1 |
3.5 |
0.0 |
-4.2 |
4.2 |
| 1990-91 |
2.6 |
-4.6 |
-7.6 |
3.0 |
9.5 |
4.5 |
5.6 |
-1.2 |
2.3 |
-0.9 |
-4.8 |
3.9 |
| 1991-92 |
-17.2 |
-23.2 |
-11.5 |
-11.7 |
-1.4 |
-6.3 |
-3.3 |
-3.0 |
-11.4 |
-14.2 |
-7.9 |
-6.3 |
| 1992-93 |
3.0 |
-3.2 |
-2.4 |
-0.8 |
-6.5 |
-12.6 |
-10.7 |
-1.9 |
35.1 |
31.4 |
11.9 |
19.5 |
| 1993-94 |
4.1 |
-2.3 |
-7.4 |
5.1 |
9.2 |
3.0 |
-0.3 |
3.3 |
16.2 |
11.1 |
9.8 |
1.3 |
| 1994-95 |
38.5 |
32.4 |
22.5 |
9.9 |
18.4 |
16.0 |
8.1 |
7.9 |
-7.8 |
-12.9 |
1.8 |
-14.7 |
| 1995-96 |
1.8 |
-5.1 |
-0.9 |
-4.2 |
43.5 |
31.9 |
25.3 |
6.7 |
14.9 |
7.4 |
6.7 |
0.7 |
| 1996-97 |
1.7 |
-4.8 |
0.0 |
-4.8 |
-3.9 |
-24.3 |
-10.0 |
-14.4 |
5.6 |
0.9 |
-0.5 |
1.4 |
| 1997-98 |
8.5 |
1.8 |
-2.0 |
3.8 |
-4.2 |
-12.2 |
-7.4 |
-4.8 |
23.4 |
18.2 |
10.2 |
8.0 |
| 1998-99 |
13.4 |
8.8 |
12.1 |
-3.3 |
-17.3 |
-25.7 |
-17.6 |
-8.1 |
15.5 |
10.7 |
9.5 |
1.2 |
| 1999-00 |
-8.4 |
-16.8 |
-13.5 |
-3.3 |
24.0 |
12.9 |
1.9 |
11.1 |
5.3 |
0.1 |
0.2 |
-0.1 |
| 2000-01 |
20.1 |
13.4 |
7.8 |
5.6 |
-0.8 |
-6.5 |
-3.4 |
-3.1 |
-6.3 |
-13.3 |
-0.8 |
-12.5 |
| 2001-02 |
9.9 |
6.9 |
7.2 |
-0.3 |
7.5 |
7.1 |
5.1 |
2.0 |
-3.1 |
-8.2 |
-10.0 |
1.8 |
| 2002-03 |
-7.5 |
-13.7 |
1.3 |
-15.0 |
14.1 |
10.7 |
4.8 |
5.9 |
-10.4 |
-18.2 |
-17.4 |
-0.8 |
| 2003-04 |
18.6 |
12.4 |
4.8 |
7.7 |
15.6 |
10.1 |
5.5 |
4.6 |
9.6 |
0.9 |
-7.3 |
8.2 |
| 2004-05 |
22.4 |
15.7 |
5.8 |
10.0 |
3.9 |
-8.5 |
-3.4 |
-5.2 |
6.2 |
-4.0 |
-7.7 |
3.7 |
| 2005-06 |
37.4 |
27.7 |
21.2 |
6.5 |
13.8 |
5.8 |
18.0 |
-12.1 |
17.5 |
11.9 |
8.7 |
3.2 |
| 2006-07 |
11.5 |
1.9 |
2.1 |
-0.2 |
11.6 |
1.0 |
-3.6 |
4.6 |
22.0 |
15.8 |
15.9 |
-0.1 |
| 2007-08 |
6.7 |
-4.6 |
1.7 |
-6.3 |
3.4 |
-15.1 |
-9.6 |
-5.5 |
-7.4 |
-13.8 |
3.8 |
-17.6 |
| 2008-09 |
25.8 |
17.8 |
12.6 |
5.2 |
0.0 |
-11.9 |
-14.6 |
2.7 |
11.7 |
8.2 |
3.9 |
4.4 |
| 2009-10 |
14.5 |
6.6 |
4.7 |
1.9 |
31.9 |
24.2 |
17.0 |
7.1 |
29.4 |
24.4 |
-1.3 |
25.7 |
| 2010-11 |
11.2 |
2.8 |
-1.1 |
3.8 |
10.4 |
3.5 |
-0.7 |
4.2 |
7.8 |
1.8 |
27.2 |
-25.4 |
| 2011-12 |
2.5 |
-5.2 |
-1.3 |
-3.9 |
11.2 |
2.3 |
0.9 |
1.5 |
1.8 |
-1.8 |
2.3 |
-4.1 |
| 2012-13 |
3.6 |
0.1 |
1.4 |
-1.3 |
8.0 |
-5.8 |
0.3 |
-6.1 |
21.3 |
20.9 |
3.0 |
17.9 |
| 2013-14 |
9.5 |
7.0 |
-0.9 |
8.0 |
-8.8 |
-14.0 |
-8.2 |
-5.8 |
4.1 |
5.4 |
5.3 |
0.0 |
| 2014-15 |
-10.8 |
-13.3 |
-7.7 |
-5.7 |
21.3 |
15.9 |
9.3 |
6.6 |
7.0 |
7.5 |
11.0 |
-3.5 |
| 2015-16 |
15.0 |
11.8 |
9.1 |
2.7 |
26.4 |
21.1 |
17.6 |
3.4 |
51.9 |
52.6 |
49.5 |
3.0 |
| 2016-17 |
5.0 |
1.1 |
-4.7 |
5.8 |
7.0 |
-0.8 |
1.1 |
-1.9 |
-30.4 |
-29.9 |
-20.3 |
-9.6 |
| 2017-18 |
23.5 |
18.2 |
18.1 |
0.1 |
3.9 |
-3.4 |
-3.6 |
0.2 |
21.5 |
21.8 |
17.7 |
4.1 |
| 2018-19 |
4.0 |
-2.0 |
-1.8 |
-0.2 |
14.9 |
7.8 |
5.5 |
2.3 |
9.6 |
3.4 |
3.4 |
0.0 |
| 2019-20 |
-2.5 |
-11.3 |
-3.6 |
-7.7 |
-4.3 |
-14.9 |
-6.9 |
-8.0 |
-8.2 |
-11.7 |
-4.8 |
-6.9 |
| Mean |
9.5 |
3.1 |
3.1 |
-0.0 |
8.2 |
0.2 |
0.0 |
0.2 |
7.5 |
2.6 |
2.3 |
0.3 |
| Std Dev |
12.6 |
12.6 |
9.6 |
|
12.0 |
13.1 |
9.5 |
|
15.8 |
16.3 |
12.7 |
|
| Corr: VA_g and TFPG |
|
0.99 |
0.89 |
|
|
0.95 |
0.90 |
|
|
0.98 |
0.78 |
|
| Note: ‘Manufacturing nec.’ includes manufacturing not elsewhere classified. |
| Table A4. Differences in Adjusted TFP Growth for Various Industries in India - 1981-82 to 2019-20 (Contd.) |
| Year |
Electricity, Gas & Water Supply |
Construction |
Trade |
| VA_g |
TFPG |
Adj_ TFPG |
Diff (62)-(63) |
VA_g |
TFPG |
Adj_ TFPG |
Diff (66)-(67) |
VA_g |
TFPG |
Adj_ TFPG |
Diff (70)-(71) |
| |
(61) |
(62) |
(63) |
(64) |
(65) |
(66) |
(67) |
(68) |
(69) |
(70) |
(71) |
(72) |
| 1981-82 |
9.1 |
1.5 |
-2.4 |
3.9 |
5.3 |
-1.7 |
0.8 |
-2.5 |
6.1 |
2.4 |
2.0 |
0.4 |
| 1982-83 |
6.4 |
-2.0 |
-4.5 |
2.5 |
-7.3 |
-14.5 |
-10.8 |
-3.6 |
5.1 |
1.5 |
1.4 |
0.1 |
| 1983-84 |
6.7 |
-0.7 |
-2.0 |
1.3 |
5.3 |
-2.9 |
-5.2 |
2.3 |
5.4 |
1.3 |
1.1 |
0.2 |
| 1984-85 |
10.3 |
3.4 |
1.5 |
1.8 |
3.4 |
-7.2 |
-2.7 |
-4.5 |
4.2 |
0.5 |
0.1 |
0.4 |
| 1985-86 |
7.6 |
0.3 |
0.1 |
0.3 |
5.5 |
-5.2 |
-5.1 |
-0.1 |
8.1 |
3.7 |
1.9 |
1.8 |
| 1986-87 |
9.8 |
1.0 |
0.1 |
0.9 |
2.4 |
-9.0 |
-12.5 |
3.4 |
5.6 |
1.4 |
1.4 |
0.1 |
| 1987-88 |
7.5 |
-1.0 |
-0.8 |
-0.2 |
5.6 |
-7.2 |
-6.7 |
-0.5 |
4.2 |
-0.3 |
0.6 |
-0.9 |
| 1988-89 |
9.3 |
3.2 |
1.4 |
1.8 |
6.8 |
1.3 |
-3.4 |
4.8 |
6.4 |
-0.1 |
-0.4 |
0.3 |
| 1989-90 |
9.3 |
3.9 |
1.9 |
2.0 |
6.8 |
2.8 |
0.1 |
2.8 |
7.3 |
0.9 |
0.2 |
0.7 |
| 1990-91 |
6.5 |
1.0 |
1.9 |
-0.9 |
11.1 |
7.3 |
0.7 |
6.5 |
4.9 |
-2.3 |
-0.9 |
-1.4 |
| 1991-92 |
9.3 |
3.9 |
3.3 |
0.7 |
2.0 |
-0.9 |
10.7 |
-11.5 |
0.5 |
-4.1 |
-1.6 |
-2.5 |
| 1992-93 |
6.7 |
2.5 |
2.3 |
0.2 |
3.4 |
-0.4 |
-5.5 |
5.2 |
5.8 |
1.1 |
0.0 |
1.1 |
| 1993-94 |
7.2 |
3.1 |
2.5 |
0.5 |
0.6 |
-2.8 |
-0.9 |
-1.8 |
6.7 |
3.1 |
1.5 |
1.6 |
| 1994-95 |
9.0 |
4.9 |
3.3 |
1.6 |
5.2 |
1.0 |
1.2 |
-0.2 |
10.3 |
4.8 |
3.2 |
1.6 |
| 1995-96 |
6.6 |
3.5 |
2.8 |
0.7 |
5.8 |
0.3 |
-4.0 |
4.3 |
13.1 |
6.1 |
4.2 |
1.9 |
| 1996-97 |
5.3 |
1.6 |
1.6 |
0.0 |
1.9 |
-1.7 |
1.3 |
-3.0 |
7.4 |
2.8 |
4.0 |
-1.2 |
| 1997-98 |
7.4 |
4.0 |
2.8 |
1.2 |
10.0 |
3.5 |
2.8 |
0.8 |
7.4 |
1.1 |
2.1 |
-1.0 |
| 1998-99 |
6.8 |
2.5 |
2.1 |
0.4 |
6.1 |
0.7 |
-2.3 |
3.0 |
7.0 |
-1.1 |
-0.6 |
-0.5 |
| 1999-00 |
5.2 |
2.1 |
0.9 |
1.1 |
8.1 |
1.7 |
0.0 |
1.7 |
6.8 |
0.7 |
0.3 |
0.4 |
| 2000-01 |
2.2 |
-0.6 |
-0.1 |
-0.6 |
6.0 |
-2.7 |
4.2 |
-6.9 |
4.9 |
-0.1 |
0.2 |
-0.4 |
| 2001-02 |
1.8 |
-1.1 |
-0.6 |
-0.5 |
3.9 |
-7.6 |
-11.4 |
3.8 |
9.4 |
3.4 |
2.0 |
1.4 |
| 2002-03 |
4.6 |
2.8 |
-0.2 |
3.0 |
8.0 |
-2.6 |
4.3 |
-6.8 |
6.7 |
2.7 |
1.6 |
1.0 |
| 2003-04 |
4.5 |
-0.3 |
-0.9 |
0.6 |
11.7 |
1.4 |
2.4 |
-1.1 |
9.7 |
2.0 |
1.7 |
0.4 |
| 2004-05 |
7.6 |
4.0 |
7.1 |
-3.1 |
15.1 |
4.1 |
-3.8 |
7.9 |
7.0 |
-0.6 |
0.2 |
-0.8 |
| 2005-06 |
6.1 |
1.5 |
4.7 |
-3.2 |
12.1 |
2.0 |
2.0 |
0.0 |
9.5 |
-0.1 |
-0.5 |
0.5 |
| 2006-07 |
7.7 |
1.8 |
3.5 |
-1.7 |
10.1 |
-1.6 |
0.6 |
-2.2 |
9.5 |
1.4 |
0.9 |
0.6 |
| 2007-08 |
8.0 |
1.9 |
3.3 |
-1.3 |
11.1 |
-1.0 |
-0.8 |
-0.2 |
5.6 |
-1.7 |
0.1 |
-1.8 |
| 2008-09 |
4.8 |
-2.8 |
-3.8 |
1.0 |
5.4 |
-4.9 |
-1.8 |
-3.0 |
1.7 |
-6.8 |
-4.7 |
-2.0 |
| 2009-10 |
5.8 |
-2.1 |
-2.9 |
0.8 |
6.6 |
-3.1 |
-0.5 |
-2.6 |
3.4 |
-4.8 |
-4.5 |
-0.2 |
| 2010-11 |
6.9 |
-2.3 |
-2.3 |
0.0 |
5.9 |
-4.1 |
-5.2 |
1.1 |
14.3 |
3.4 |
-0.8 |
4.2 |
| 2011-12 |
8.2 |
-0.6 |
-1.2 |
0.6 |
12.3 |
1.7 |
-1.5 |
3.2 |
5.6 |
-6.9 |
-4.7 |
-2.2 |
| 2012-13 |
2.6 |
-5.1 |
-2.0 |
-3.0 |
0.3 |
-6.1 |
-4.8 |
-1.3 |
11.3 |
-8.5 |
-5.2 |
-3.3 |
| 2013-14 |
4.1 |
-2.9 |
-2.2 |
-0.7 |
2.6 |
0.1 |
-1.3 |
1.4 |
5.8 |
-2.7 |
-1.0 |
-1.6 |
| 2014-15 |
7.0 |
1.1 |
0.1 |
1.0 |
4.2 |
1.9 |
-1.4 |
3.3 |
9.7 |
-0.6 |
-1.2 |
0.7 |
| 2015-16 |
4.6 |
-1.8 |
-0.9 |
-1.0 |
3.5 |
0.8 |
1.8 |
-1.0 |
10.3 |
0.4 |
0.7 |
-0.2 |
| 2016-17 |
9.5 |
3.9 |
3.2 |
0.8 |
5.7 |
1.6 |
0.7 |
1.0 |
9.8 |
-0.6 |
-0.3 |
-0.3 |
| 2017-18 |
10.1 |
6.1 |
5.1 |
1.0 |
5.1 |
0.4 |
-0.9 |
1.3 |
12.4 |
1.9 |
1.0 |
0.9 |
| 2018-19 |
7.6 |
5.8 |
2.9 |
2.9 |
6.3 |
-1.7 |
-0.8 |
-0.8 |
8.5 |
-2.3 |
-0.6 |
-1.7 |
| 2019-20 |
2.2 |
-4.9 |
-0.3 |
-4.6 |
1.2 |
-6.7 |
-3.2 |
-3.5 |
6.9 |
-5.9 |
-2.2 |
-3.8 |
| Mean |
6.7 |
1.1 |
0.8 |
0.3 |
5.8 |
-1.6 |
-1.6 |
0.0 |
7.3 |
-0.1 |
0.1 |
-0.1 |
| Std Dev |
2.2 |
2.8 |
2.6 |
|
4.1 |
4.2 |
4.4 |
|
2.9 |
3.3 |
2.2 |
|
| Corr: VA_g and TFPG |
|
0.69 |
0.43 |
|
|
0.69 |
0.34 |
|
|
0.43 |
0.31 |
|
| Table A4. Differences in Adjusted TFP Growth for Various Industries in India - 1981-82 to 2019-20 (Contd.) |
| Year |
Hotels & Restaurants |
Transport & Storage |
Post & Telecommunication |
| VA_g |
TFPG |
Adj_ TFPG |
Diff (74)-(75) |
VA_g |
TFPG |
Adj_ TFPG |
Diff (78)-(79) |
VA_g |
TFPG |
Adj_ TFPG |
Diff (82)-(83) |
| |
(73) |
(74) |
(75) |
(76) |
(77) |
(78) |
(79) |
(80) |
(81) |
(82) |
(83) |
(84) |
| 1981-82 |
-2.8 |
-10.7 |
-7.8 |
-2.9 |
6.6 |
0.1 |
-1.0 |
1.1 |
7.5 |
-2.0 |
-1.0 |
-0.9 |
| 1982-83 |
17.0 |
10.3 |
3.2 |
7.1 |
4.2 |
-2.6 |
-2.5 |
-0.1 |
4.6 |
-4.7 |
-2.4 |
-2.3 |
| 1983-84 |
0.9 |
-5.3 |
-2.5 |
-2.8 |
5.0 |
-0.6 |
-2.0 |
1.4 |
5.5 |
-3.3 |
-3.4 |
0.1 |
| 1984-85 |
5.5 |
0.7 |
3.8 |
-3.1 |
5.4 |
1.6 |
0.4 |
1.2 |
7.8 |
3.9 |
-0.7 |
4.6 |
| 1985-86 |
4.6 |
-0.6 |
0.0 |
-0.6 |
7.7 |
4.7 |
2.7 |
2.0 |
1.6 |
-1.9 |
-0.7 |
-1.2 |
| 1986-87 |
4.7 |
0.0 |
0.4 |
-0.4 |
6.3 |
1.2 |
1.1 |
0.1 |
6.1 |
2.6 |
2.3 |
0.2 |
| 1987-88 |
5.9 |
0.2 |
0.0 |
0.2 |
7.0 |
4.0 |
3.4 |
0.6 |
5.7 |
0.3 |
0.2 |
0.2 |
| 1988-89 |
6.4 |
1.3 |
0.5 |
0.8 |
4.5 |
1.2 |
1.8 |
-0.7 |
4.5 |
-4.3 |
-1.6 |
-2.7 |
| 1989-90 |
11.7 |
7.0 |
4.0 |
2.9 |
6.1 |
2.1 |
1.5 |
0.5 |
6.8 |
-2.3 |
-1.5 |
-0.8 |
| 1990-91 |
7.3 |
3.0 |
2.7 |
0.3 |
4.6 |
1.1 |
-1.4 |
2.5 |
6.4 |
-2.1 |
-1.2 |
-0.9 |
| 1991-92 |
0.8 |
-4.2 |
-0.6 |
-3.6 |
5.9 |
2.1 |
-0.1 |
2.1 |
7.1 |
-1.3 |
-0.9 |
-0.4 |
| 1992-93 |
6.2 |
1.8 |
0.9 |
0.9 |
3.7 |
0.1 |
-0.1 |
0.2 |
12.0 |
2.0 |
0.7 |
1.3 |
| 1993-94 |
8.0 |
5.4 |
3.1 |
2.3 |
5.7 |
0.4 |
-0.7 |
1.0 |
12.5 |
2.1 |
1.3 |
0.8 |
| 1994-95 |
4.0 |
-1.4 |
0.0 |
-1.4 |
8.0 |
3.4 |
3.4 |
0.1 |
14.3 |
3.1 |
2.1 |
1.0 |
| 1995-96 |
22.7 |
16.3 |
8.8 |
7.6 |
8.9 |
4.8 |
4.1 |
0.7 |
15.2 |
4.8 |
3.7 |
1.2 |
| 1996-97 |
12.1 |
6.8 |
6.7 |
0.1 |
7.4 |
3.1 |
3.0 |
0.1 |
10.2 |
2.2 |
2.5 |
-0.3 |
| 1997-98 |
7.7 |
2.5 |
5.6 |
-3.1 |
4.9 |
1.7 |
2.4 |
-0.7 |
18.3 |
10.2 |
6.9 |
3.4 |
| 1998-99 |
13.1 |
7.1 |
5.3 |
1.8 |
4.9 |
1.2 |
1.3 |
-0.1 |
17.8 |
10.2 |
7.3 |
2.8 |
| 1999-00 |
9.3 |
4.6 |
5.2 |
-0.6 |
6.9 |
2.8 |
1.1 |
1.8 |
20.0 |
9.8 |
6.6 |
3.3 |
| 2000-01 |
6.7 |
0.3 |
3.0 |
-2.7 |
6.8 |
2.6 |
1.4 |
1.1 |
22.3 |
10.2 |
7.6 |
2.5 |
| 2001-02 |
7.6 |
1.1 |
1.9 |
-0.8 |
4.4 |
0.7 |
1.3 |
-0.6 |
17.7 |
8.0 |
7.1 |
0.8 |
| 2002-03 |
5.6 |
1.3 |
1.0 |
0.4 |
8.8 |
3.4 |
1.5 |
1.9 |
20.9 |
14.0 |
9.4 |
4.5 |
| 2003-04 |
8.3 |
2.0 |
1.7 |
0.3 |
10.3 |
4.8 |
2.8 |
2.0 |
23.0 |
19.6 |
13.3 |
6.3 |
| 2004-05 |
10.8 |
2.9 |
1.5 |
1.4 |
10.8 |
5.2 |
5.4 |
-0.2 |
19.0 |
11.9 |
10.9 |
1.0 |
| 2005-06 |
13.4 |
3.7 |
2.0 |
1.7 |
9.2 |
2.9 |
3.7 |
-0.8 |
2.9 |
-3.2 |
2.1 |
-5.3 |
| 2006-07 |
11.3 |
1.7 |
2.0 |
-0.3 |
9.2 |
3.8 |
4.0 |
-0.2 |
1.9 |
-2.2 |
0.9 |
-3.1 |
| 2007-08 |
9.6 |
-0.2 |
1.2 |
-1.4 |
8.7 |
0.7 |
2.0 |
-1.3 |
7.8 |
2.8 |
2.6 |
0.2 |
| 2008-09 |
-4.4 |
-13.1 |
-0.6 |
-12.5 |
5.3 |
-2.0 |
1.3 |
-3.3 |
3.1 |
-10.2 |
-4.6 |
-5.6 |
| 2009-10 |
-0.3 |
-8.5 |
-3.2 |
-5.3 |
8.2 |
1.9 |
2.4 |
-0.5 |
18.7 |
8.3 |
4.7 |
3.6 |
| 2010-11 |
15.3 |
5.8 |
-1.5 |
7.3 |
7.5 |
1.7 |
2.1 |
-0.4 |
0.6 |
-5.5 |
0.4 |
-5.9 |
| 2011-12 |
6.3 |
-3.7 |
-2.2 |
-1.5 |
7.5 |
0.1 |
1.3 |
-1.3 |
5.4 |
-1.2 |
1.3 |
-2.5 |
| 2012-13 |
3.3 |
-3.5 |
-3.9 |
0.5 |
7.5 |
1.1 |
2.5 |
-1.4 |
6.6 |
-0.8 |
0.2 |
-1.0 |
| 2013-14 |
-0.4 |
-3.2 |
-3.8 |
0.6 |
5.9 |
3.4 |
2.7 |
0.7 |
14.8 |
-9.0 |
-2.0 |
-7.0 |
| 2014-15 |
5.9 |
0.2 |
-1.4 |
1.5 |
7.2 |
3.5 |
2.1 |
1.3 |
12.1 |
9.4 |
5.3 |
4.1 |
| 2015-16 |
12.5 |
4.1 |
0.9 |
3.3 |
6.7 |
2.0 |
1.5 |
0.6 |
13.4 |
2.3 |
6.6 |
-4.3 |
| 2016-17 |
8.4 |
2.1 |
2.3 |
-0.2 |
4.2 |
-1.8 |
-0.2 |
-1.6 |
1.3 |
-5.5 |
-2.9 |
-2.6 |
| 2017-18 |
8.8 |
3.0 |
3.2 |
-0.2 |
8.4 |
1.5 |
1.2 |
0.2 |
-2.8 |
-17.9 |
-14.8 |
-3.2 |
| 2018-19 |
8.9 |
2.6 |
1.3 |
1.3 |
5.2 |
-2.7 |
-0.8 |
-1.9 |
-0.6 |
-11.7 |
-8.1 |
-3.6 |
| 2019-20 |
6.5 |
-1.6 |
-1.2 |
-0.4 |
1.3 |
-5.4 |
-1.1 |
-4.3 |
10.6 |
9.2 |
8.2 |
1.0 |
| Mean |
7.4 |
1.1 |
1.1 |
-0.0 |
6.6 |
1.5 |
1.4 |
0.1 |
9.8 |
1.5 |
1.8 |
-0.3 |
| Std Dev |
5.3 |
5.4 |
3.2 |
|
2.0 |
2.3 |
1.8 |
|
7.0 |
7.6 |
5.3 |
|
| Corr: VA_g and TFPG |
|
0.94 |
0.71 |
|
|
0.76 |
0.73 |
|
|
0.86 |
0.83 |
|
| Table A4. Differences in Adjusted TFP Growth for Various Industries in India - 1981-82 to 2019-20 (Contd.) |
| Year |
Financial Services |
Business Services |
Public Administration & Defence |
| VA_g |
TFPG |
Adj_ TFPG |
Diff (86)-(87) |
VA_g |
TFPG |
Adj_ TFPG |
Diff (90)-(91) |
VA_g |
TFPG |
Adj_ TFPG |
Diff (94)-(95) |
| |
(85) |
(86) |
(87) |
(88) |
(89) |
(90) |
(91) |
(92) |
(93) |
(94) |
(95) |
(96) |
| 1981-82 |
7.0 |
-1.4 |
-0.8 |
-0.5 |
9.7 |
4.3 |
1.7 |
2.5 |
2.2 |
-0.2 |
-0.8 |
0.5 |
| 1982-83 |
12.8 |
3.9 |
1.7 |
2.1 |
6.8 |
1.4 |
0.1 |
1.3 |
9.5 |
6.9 |
2.2 |
4.7 |
| 1983-84 |
9.0 |
0.3 |
0.4 |
-0.2 |
23.8 |
16.5 |
10.2 |
6.4 |
3.4 |
-0.4 |
2.0 |
-2.4 |
| 1984-85 |
7.4 |
0.3 |
0.6 |
-0.3 |
9.5 |
3.7 |
5.0 |
-1.4 |
9.0 |
2.7 |
3.2 |
-0.5 |
| 1985-86 |
12.9 |
5.9 |
3.2 |
2.7 |
8.9 |
2.8 |
4.7 |
-1.9 |
7.1 |
0.9 |
1.3 |
-0.4 |
| 1986-87 |
13.0 |
6.0 |
4.5 |
1.5 |
9.8 |
3.9 |
3.9 |
0.1 |
8.8 |
2.3 |
1.9 |
0.4 |
| 1987-88 |
6.1 |
-0.6 |
2.2 |
-2.8 |
0.4 |
-7.6 |
-3.7 |
-3.9 |
9.3 |
3.3 |
2.5 |
0.8 |
| 1988-89 |
10.6 |
3.3 |
3.0 |
0.3 |
6.1 |
-1.3 |
-1.0 |
-0.4 |
6.0 |
2.7 |
2.6 |
0.1 |
| 1989-90 |
20.3 |
12.3 |
7.1 |
5.2 |
6.9 |
-2.3 |
-2.6 |
0.3 |
7.7 |
5.6 |
4.0 |
1.6 |
| 1990-91 |
1.9 |
-5.4 |
0.6 |
-6.0 |
11.7 |
0.9 |
-0.3 |
1.2 |
1.3 |
-0.7 |
2.2 |
-2.8 |
| 1991-92 |
14.7 |
6.1 |
4.7 |
1.3 |
5.1 |
-3.1 |
-1.3 |
-1.8 |
2.1 |
0.2 |
1.6 |
-1.4 |
| 1992-93 |
2.6 |
-4.5 |
-1.8 |
-2.6 |
6.8 |
-2.9 |
-2.0 |
-0.9 |
4.9 |
3.2 |
1.6 |
1.7 |
| 1993-94 |
13.3 |
4.2 |
2.6 |
1.6 |
8.6 |
-0.7 |
-1.3 |
0.6 |
2.5 |
0.9 |
1.5 |
-0.6 |
| 1994-95 |
4.6 |
-4.9 |
-4.2 |
-0.7 |
11.6 |
1.3 |
0.7 |
0.6 |
1.3 |
0.0 |
1.5 |
-1.5 |
| 1995-96 |
10.8 |
0.2 |
-0.8 |
1.0 |
17.1 |
5.1 |
3.0 |
2.1 |
6.5 |
5.6 |
3.2 |
2.4 |
| 1996-97 |
8.1 |
-0.2 |
0.6 |
-0.8 |
11.8 |
-1.7 |
-0.6 |
-1.1 |
4.0 |
3.1 |
3.0 |
0.1 |
| 1997-98 |
17.2 |
11.4 |
7.4 |
4.0 |
20.2 |
4.0 |
1.7 |
2.2 |
13.3 |
12.2 |
7.7 |
4.6 |
| 1998-99 |
8.8 |
3.6 |
4.2 |
-0.6 |
17.9 |
-0.1 |
-2.4 |
2.3 |
10.0 |
8.6 |
7.8 |
0.8 |
| 1999-00 |
12.3 |
5.0 |
4.5 |
0.5 |
20.9 |
1.2 |
3.4 |
-2.3 |
12.6 |
11.2 |
10.4 |
0.8 |
| 2000-01 |
-2.4 |
-10.0 |
-4.2 |
-5.8 |
22.2 |
3.6 |
2.6 |
1.0 |
1.8 |
2.4 |
6.6 |
-4.2 |
| 2001-02 |
7.7 |
-0.6 |
-0.2 |
-0.4 |
12.0 |
-9.3 |
-6.1 |
-3.2 |
2.8 |
3.7 |
4.0 |
-0.4 |
| 2002-03 |
10.6 |
6.2 |
3.5 |
2.7 |
10.7 |
-7.4 |
-4.7 |
-2.7 |
1.5 |
2.3 |
3.9 |
-1.6 |
| 2003-04 |
2.6 |
-3.4 |
-1.3 |
-2.1 |
16.5 |
0.2 |
-1.4 |
1.6 |
2.3 |
3.5 |
4.1 |
-0.6 |
| 2004-05 |
7.8 |
3.1 |
2.6 |
0.5 |
16.2 |
-0.1 |
-0.6 |
0.4 |
6.4 |
6.9 |
2.5 |
4.4 |
| 2005-06 |
11.2 |
5.3 |
3.1 |
2.2 |
15.6 |
1.7 |
1.3 |
0.4 |
4.4 |
3.3 |
4.7 |
-1.4 |
| 2006-07 |
12.0 |
4.5 |
3.3 |
1.1 |
8.7 |
-4.3 |
-2.3 |
-2.0 |
2.1 |
0.4 |
2.9 |
-2.5 |
| 2007-08 |
9.3 |
1.5 |
2.8 |
-1.4 |
10.5 |
-2.1 |
-1.6 |
-0.5 |
7.4 |
5.5 |
2.8 |
2.8 |
| 2008-09 |
5.0 |
0.4 |
0.3 |
0.1 |
8.3 |
-7.3 |
-5.8 |
-1.6 |
17.3 |
15.8 |
12.4 |
3.5 |
| 2009-10 |
6.9 |
2.6 |
0.8 |
1.9 |
5.2 |
-6.8 |
-4.6 |
-2.2 |
15.6 |
14.3 |
13.5 |
0.8 |
| 2010-11 |
6.5 |
-1.1 |
-0.6 |
-0.5 |
3.9 |
-5.9 |
-4.5 |
-1.4 |
-0.1 |
-1.4 |
5.3 |
-6.7 |
| 2011-12 |
3.4 |
-0.7 |
-0.8 |
0.0 |
5.5 |
-7.2 |
-6.7 |
-0.5 |
4.2 |
3.1 |
2.7 |
0.4 |
| 2012-13 |
9.8 |
6.2 |
2.0 |
4.1 |
11.9 |
0.7 |
-2.3 |
3.0 |
2.1 |
1.5 |
4.3 |
-2.8 |
| 2013-14 |
8.7 |
4.7 |
5.3 |
-0.6 |
16.5 |
5.6 |
-0.7 |
6.3 |
1.7 |
1.2 |
1.8 |
-0.6 |
| 2014-15 |
8.2 |
4.8 |
3.4 |
1.3 |
17.1 |
4.6 |
2.3 |
2.3 |
6.4 |
5.9 |
1.6 |
4.3 |
| 2015-16 |
7.0 |
2.4 |
2.1 |
0.3 |
18.9 |
8.6 |
7.5 |
1.0 |
3.8 |
3.2 |
2.8 |
0.4 |
| 2016-17 |
3.4 |
0.1 |
-0.4 |
0.5 |
15.9 |
5.2 |
4.7 |
0.5 |
8.3 |
7.6 |
8.0 |
-0.5 |
| 2017-18 |
4.6 |
2.4 |
2.4 |
0.0 |
0.7 |
-8.3 |
3.5 |
-11.8 |
9.7 |
8.9 |
8.9 |
0.1 |
| 2018-19 |
4.0 |
-2.6 |
-0.1 |
-2.5 |
11.1 |
4.2 |
-2.6 |
6.8 |
6.6 |
2.7 |
5.6 |
-2.9 |
| 2019-20 |
3.4 |
0.4 |
0.3 |
0.1 |
10.9 |
4.9 |
0.3 |
4.7 |
5.0 |
2.1 |
3.7 |
-1.6 |
| Mean |
8.3 |
1.8 |
1.6 |
0.2 |
11.6 |
0.2 |
-0.1 |
0.2 |
5.9 |
4.1 |
4.1 |
-0.0 |
| Std Dev |
4.5 |
4.4 |
2.6 |
|
5.7 |
5.4 |
3.7 |
|
4.2 |
4.1 |
3.1 |
|
| Corr: VA_g and TFPG |
|
0.89 |
0.81 |
|
|
0.70 |
0.52 |
|
|
0.89 |
0.68 |
|
| Table A4. Differences in Adjusted TFP Growth for Various Industries in India - 1981-82 to 2019-20 (Concld.) |
| Year |
Education |
Health & Social Services |
Other services |
| VA_g |
TFPG |
Adj_ TFPG |
Diff (98)-(99) |
VA_g |
TFPG |
Adj_ TFPG |
Diff (102)-(103) |
VA_g |
TFPG |
Adj_ TFPG |
Diff (106)-(107) |
| |
(97) |
(98) |
(99) |
(100) |
(101) |
(102) |
(103) |
(104) |
(105) |
(106) |
(107) |
(108) |
| 1981-82 |
4.0 |
1.3 |
1.0 |
0.3 |
4.5 |
0.8 |
1.9 |
-1.1 |
6.5 |
4.8 |
2.1 |
2.7 |
| 1982-83 |
9.6 |
6.7 |
3.2 |
3.4 |
7.6 |
3.9 |
3.2 |
0.8 |
6.5 |
4.8 |
2.2 |
2.6 |
| 1983-84 |
3.1 |
0.1 |
2.4 |
-2.3 |
10.3 |
6.0 |
4.3 |
1.7 |
6.6 |
4.5 |
3.7 |
0.8 |
| 1984-85 |
4.7 |
2.0 |
2.8 |
-0.8 |
9.2 |
4.8 |
4.4 |
0.4 |
6.3 |
4.5 |
4.4 |
0.1 |
| 1985-86 |
8.6 |
5.7 |
3.0 |
2.6 |
4.5 |
-0.1 |
2.6 |
-2.7 |
6.1 |
4.3 |
4.1 |
0.1 |
| 1986-87 |
7.1 |
4.1 |
3.9 |
0.2 |
3.5 |
-1.3 |
0.8 |
-2.1 |
7.7 |
6.0 |
4.9 |
1.1 |
| 1987-88 |
4.1 |
0.9 |
3.2 |
-2.3 |
9.5 |
4.3 |
1.6 |
2.7 |
8.2 |
5.6 |
4.9 |
0.7 |
| 1988-89 |
7.1 |
2.0 |
2.5 |
-0.6 |
9.1 |
3.9 |
2.8 |
1.1 |
8.1 |
3.1 |
4.4 |
-1.4 |
| 1989-90 |
12.0 |
5.9 |
3.4 |
2.5 |
8.4 |
3.0 |
3.6 |
-0.6 |
6.1 |
-0.5 |
1.9 |
-2.4 |
| 1990-91 |
8.1 |
1.9 |
2.1 |
-0.1 |
10.0 |
4.5 |
3.7 |
0.8 |
7.4 |
0.2 |
0.6 |
-0.4 |
| 1991-92 |
3.0 |
-2.7 |
0.8 |
-3.6 |
1.8 |
-2.9 |
1.1 |
-4.0 |
7.3 |
0.7 |
0.5 |
0.2 |
| 1992-93 |
3.7 |
-2.3 |
-1.1 |
-1.2 |
6.2 |
1.1 |
1.0 |
0.1 |
7.4 |
0.1 |
0.3 |
-0.2 |
| 1993-94 |
4.7 |
-1.0 |
-1.7 |
0.7 |
6.7 |
1.9 |
0.5 |
1.4 |
8.6 |
1.5 |
1.1 |
0.4 |
| 1994-95 |
5.7 |
-0.0 |
-0.9 |
0.9 |
5.0 |
-1.6 |
0.6 |
-2.2 |
1.9 |
-1.7 |
-1.0 |
-0.6 |
| 1995-96 |
10.0 |
4.5 |
1.8 |
2.7 |
7.9 |
1.2 |
1.2 |
0.1 |
3.3 |
0.8 |
0.2 |
0.7 |
| 1996-97 |
9.1 |
3.5 |
2.7 |
0.8 |
8.0 |
1.4 |
0.6 |
0.8 |
4.2 |
1.4 |
0.8 |
0.6 |
| 1997-98 |
10.4 |
3.7 |
3.2 |
0.5 |
7.5 |
-0.5 |
-0.3 |
-0.2 |
1.5 |
-1.6 |
-0.1 |
-1.5 |
| 1998-99 |
10.8 |
2.1 |
1.9 |
0.2 |
9.1 |
-1.4 |
-1.6 |
0.2 |
3.2 |
-0.3 |
0.9 |
-1.2 |
| 1999-00 |
13.4 |
6.3 |
5.1 |
1.1 |
13.4 |
4.8 |
2.2 |
2.6 |
3.2 |
-0.9 |
-1.3 |
0.4 |
| 2000-01 |
6.3 |
-1.2 |
2.5 |
-3.8 |
10.9 |
2.6 |
2.6 |
0.0 |
2.8 |
-1.7 |
-0.7 |
-1.0 |
| 2001-02 |
3.6 |
-5.5 |
-1.5 |
-4.0 |
7.3 |
-3.1 |
-0.6 |
-2.5 |
2.8 |
-3.1 |
-2.1 |
-1.0 |
| 2002-03 |
5.9 |
-3.1 |
-3.1 |
-0.1 |
7.5 |
-2.5 |
-0.9 |
-1.7 |
2.4 |
-3.1 |
-2.4 |
-0.7 |
| 2003-04 |
7.5 |
-1.4 |
-2.5 |
1.1 |
10.4 |
0.4 |
-0.9 |
1.3 |
2.7 |
-2.3 |
-2.0 |
-0.4 |
| 2004-05 |
6.5 |
-3.6 |
-3.2 |
-0.4 |
10.6 |
-1.3 |
-3.4 |
2.0 |
2.7 |
-2.5 |
-2.3 |
-0.2 |
| 2005-06 |
10.9 |
2.3 |
-0.6 |
2.9 |
10.6 |
0.0 |
-1.5 |
1.5 |
5.0 |
-0.5 |
-1.2 |
0.7 |
| 2006-07 |
-5.3 |
-12.7 |
-5.8 |
-6.9 |
15.8 |
6.7 |
3.1 |
3.6 |
3.6 |
-1.4 |
-1.3 |
-0.1 |
| 2007-08 |
9.5 |
2.1 |
-1.3 |
3.4 |
5.8 |
-3.4 |
-0.2 |
-3.1 |
5.4 |
-0.0 |
-0.6 |
0.6 |
| 2008-09 |
14.1 |
8.1 |
0.5 |
7.6 |
8.8 |
1.8 |
2.6 |
-0.7 |
4.1 |
-2.4 |
-3.0 |
0.6 |
| 2009-10 |
13.8 |
8.3 |
6.0 |
2.3 |
16.5 |
10.2 |
5.1 |
5.1 |
7.8 |
2.1 |
0.1 |
2.0 |
| 2010-11 |
18.8 |
13.1 |
9.6 |
3.5 |
10.8 |
4.4 |
4.3 |
0.1 |
5.3 |
0.4 |
0.2 |
0.2 |
| 2011-12 |
13.4 |
7.8 |
8.4 |
-0.6 |
-0.1 |
-6.4 |
-0.0 |
-6.4 |
5.7 |
0.3 |
0.2 |
0.1 |
| 2012-13 |
5.3 |
-0.9 |
5.3 |
-6.2 |
7.8 |
1.6 |
-0.2 |
1.8 |
6.7 |
2.8 |
2.6 |
0.1 |
| 2013-14 |
5.9 |
-0.6 |
2.5 |
-3.2 |
4.0 |
-2.7 |
-4.8 |
2.1 |
7.0 |
3.6 |
2.8 |
0.8 |
| 2014-15 |
6.9 |
0.6 |
0.5 |
0.1 |
13.0 |
6.4 |
3.1 |
3.2 |
7.3 |
3.3 |
2.2 |
1.0 |
| 2015-16 |
8.1 |
0.8 |
-0.5 |
1.4 |
8.1 |
0.3 |
0.2 |
0.1 |
4.4 |
1.3 |
1.9 |
-0.6 |
| 2016-17 |
9.5 |
2.2 |
1.5 |
0.7 |
8.8 |
0.9 |
-0.1 |
1.0 |
4.9 |
1.6 |
2.0 |
-0.3 |
| 2017-18 |
11.0 |
3.6 |
2.8 |
0.8 |
6.0 |
-1.7 |
0.7 |
-2.4 |
0.4 |
-2.4 |
1.9 |
-4.3 |
| 2018-19 |
10.1 |
2.4 |
2.7 |
-0.3 |
7.5 |
0.2 |
-0.3 |
0.5 |
3.4 |
-4.2 |
-2.4 |
-1.9 |
| 2019-20 |
6.9 |
2.3 |
4.7 |
-2.3 |
6.0 |
2.2 |
-4.6 |
6.8 |
4.2 |
4.9 |
-0.8 |
5.7 |
| Mean |
7.9 |
1.8 |
1.7 |
0.0 |
8.2 |
1.3 |
1.0 |
0.3 |
5.1 |
0.9 |
0.8 |
0.1 |
| Std Dev |
4.2 |
4.4 |
3.1 |
|
3.4 |
3.3 |
2.3 |
|
2.1 |
2.8 |
2.2 |
|
| Corr: VA_g and TFPG |
|
0.90 |
0.63 |
|
|
0.79 |
0.40 |
|
|
0.72 |
0.63 |
|
| Source: Growth rate of real value added (VA_g) and standard TFP growth (TFPG) from the India KLEMS database and Adjusted TFPG (Adj_TFPG) from author’s computation. |
|
 IST,
IST,