AN OUTLINE OF POST 2009 FRBM FISCAL ARCHITECTURE OF THE UNION
GOVERNMENT IN THE MEDIUM TERM
Ravindra H. Dholakia, Jeevan K. Khundrakpam, Dhirendra Gajbhiye*
ACKNOWLEDGEMENTS
The then Finance Minister, Mr. P. Chidambaram in his budget speech of February 29, 2008 pointed explicitly to the need for looking into the fiscal architecture in the post-FRBM period. He declared that he would ask the Thirteenth Finance Commission to do the needful. The Thirteenth Finance Commission, in turn, asked the Reserve Bank of India to submit the study report and RBI gave me the opportunity to lead this study under its Development Research Group. The financial, organisational and manpower support provided by the DRG to successfully complete this study is gratefully acknowledged.
I am also highly thankful to Dr. R. K. Patnaik, Advisor, DEAP not only for extending valuable support but also providing very useful inputs through in-depth discussion on conceptual issues bringing in all his rich experience and also providing critical comments on initial drafts. Shri B.M. Misra, Advisor, DEAP was also extremely helpful in providing organisational support and useful inputs through in-depth discussions. Comments and questions from the participants of the in-house seminar organised by RBI were also very useful. I express my sincere thanks to DRG in providing the necessary support in the course of preparation of the study.
An anonymous referee’s painstaking constructive comments on the earlier draft of the study are gratefully acknowledged. They helped better exposition of the material and arguments in the study.
The contents of this paper were also presented as a special invited lecture at the Annual Conference of The Indian Econometric Society held at Guwahati on January 9, 2009. Comments and questions from the participants of the Conference were also helpful in making some important expositional revisions in the draft.
Finally, I must acknowledge untiring and enthusiastic support received and extreme hardwork put in by my co-authors, Shri Jeevan K. Khundrakpam, Director, DEAP and Shri Dhirendra Gajbhiye, Research Officer, DEAP. But for their commitment and assistance at every stage of the work, it would not have been possible to complete the study. The views expressed in this study are authors’ own and do not reflect those of the institutions to which they belong. Similarly, responsibility of any possible errors also rests with the authors.
Ravindra H. Dholakia
EXECUTIVE SUMMARY
The study emphasises that in designing a meaningful framework on fiscal consolidation during the post-Fiscal Responsibility and Budget Management (FRBM) period in India there is a need for reconciling the discrepancies between the fiscal deficit and movement in debt. It finds that discrepancy between the two arise mainly due to: i) exclusion of off-budget liabilities and Market Stabilisation Scheme (MSS) in fiscal deficit while being part of outstanding liabilities; ii) part of National Small Savings Fund (NSSF) being utilised by the States to finance their deficits being shown as liabilities of the Central Government; and iii) financing of fiscal deficit by draw-down or build-up in cash balances. Thus, the paper makes an attempt to reconcile the discrepancy by including the off-budget liabilities and MSS explicitly as above the line items, excluding the NSSF utilised by the States from the outstanding liabilities of the Central Government and adjusting the cash balances from Gross Fiscal Deficit (GFD). For the fiscal consolidation framework, the burden of interest payments on revenue receipts is considered the target variable. The choice of this target variable is based on the argument that the Government would be in a much better position to decide on how much of the current revenues it can afford for paying interest on its borrowing in the coming years, while defining a sustainable debt/GDP ratio in terms of a precise number is neither straight forward nor always meaningful under the high growth environment. Given the targeted level of this chosen variable, the paper provides a framework based on budgetary identity to derive the tolerable level of deficit and debt under alternative assumptions of growth and interest rate. With the tolerable level of deficit so derived, the components of expenditure are calibrated by making adjustments in the discretionary component. Moreover, the paper reclassifies the expenditure components into current and investment component as against the current budgetary practice of defining them into revenue and capital component. The reclassification is based on the procedure adopted by Economic and Functional Classification of budget, which recognises that a significant proportion of the presently defined revenue expenditures in the budget are investment in nature, while defense capital outlay are primarily consumption in nature as recognised in the national income accounting. The paper also proposes for zero current deficits by 2013-14 so that the entire net borrowing goes to meet the investment expenditure, the so-called “Golden Rule”.
Under alternative assumptions of growth, interest rate, revenue buoyancy and chosen ratio of targeted interest payments to revenue receipts, the framework provided in the paper generates a menu of choices on the path of fiscal consolidation during the medium term. Among these alternatives, the most favorable environment is the combination of 14.0 per cent nominal growth of GDP, continuance of high revenue buoyancy, softening of the interest rate by 0.1 percentage points each year and a liberal target for Interest Payments (IP)/Revenue Receipts (RR) ratio of 22.0 per cent by 2014-15. On the other hand, the most pessimistic scenario would be a decline in nominal growth to 12.0 per cent, lower revenue buoyancy and constant interest rate, and a stiff target for IP/RR of 18.0 per cent. Among the various possibilities between these two extreme scenarios, the paper views that the nominal growth of GDP may be sustained at 14.0 per cent and the interest rate, as forecasted, may decline somewhat by an average of 0.03 to 0.04 percentage point each year in the next 4-5 years. However, revenue buoyancy may be considered as a genuinely uncertain variable. If the revenue buoyancy declines, it would still remain one percentage point above the nominal GDP growth; and if it continues to be high, it would be about 2-4 percentage points above the GDP growth. As expected, the exercise of building 54 scenarios has clearly demonstrated trade-offs and hence similarities of outcomes in different scenarios based on different values of nominal growth of GDP, and alternative behaviour patterns of interest rate, tax buoyancy and IP/RR ratio over the next 5 years. The IP/RR target of 18.0 per cent appears to be unreasonably stiff particularly if the revenue buoyancy declines, because it would require restricting the redefined all inclusive GFD/GDP to less than 0.5 per cent and the redefined Debt/GDP ratio to 31 per cent by 2013-14, and consequently, investment expenditure to a significantly lower level than base year despite zero current deficit. To fix such a stiff IP/RR target may not be advisable when the economy is on a fast growth track. Therefore, a reasonable IP/RR target appears to be 20.0 per cent by 2014-15 and be maintained at that level in the future. If revenue buoyancy continues to be high, the tolerable level of redefined debt would be about 40.0 per cent of GDP and the redefined GFD slightly above 3.0 per cent of GDP by the year 2013-14. If, however, the revenue buoyancy declines, the tolerable Debt/GDP ratio would be around 35 per cent and GFD would be around 1.5 per cent of GDP by the year 2013-14. Once the IP/RR target has been achieved, however, a GFD of over 5.5 per cent of GDP in the first case and about 4.5 per cent in the second case would be affordable without jeopardising the debt to GDP ratio even when interest rate and revenue receipts to GDP remain constant. In the post 2009 FRBM period, the medium term fiscal architecture implied by the target of 20 per cent IP/RR ratio, therefore, appears to be challenging but achievable under normal expectations about future.
SECTION I
INTRODUCTION
Crisis of 1991 brought to the fore several weaknesses of the Indian economic policies on all fronts. Increasing interest burden on account of rising debt, fiscal deficits, and interest rates created the problem of fiscal sustainability and raised concerns about debt-trap. Consequently, fiscal consolidation constituted a major plank of the comprehensive reform programme launched in India since then. However, fiscal correction in terms of a significant reduction in selected fiscal deficit indicators was sustained only during 1991-92 to 1996-97 (with an exception of 1993-94). Thereafter, the trend reversed substantially for numerous reasons and the fiscal situation deteriorated significantly up to 2002-03. It was in this backdrop that the Central Government enacted the Fiscal Responsibility and Budget Management (FRBM) Legislation in August 2003 and the Rules in July 2004 with a view to strengthening the process of fiscal consolidation and providing for long-term macroeconomic stability.
It is noted that during the FRBM period, there has been significant improvement in the fiscal indicators, largely as a result of increased revenue mobilisation and some expenditure compression in both the revenue and the capital component. However, there still remain a number of concerns. They are : (i) the existing stipulated targets for fiscal and revenue deficit under FRBM do not take into consideration the off-budget liabilities, which have grown significantly in the recent years, and if not addressed adequately, have the potential to grow steeply nullifying all painstaking efforts on fiscal front so far. These liabilities are reflected in the outstanding liabilities of the government and will have to be ultimately borne by the Government. The current disclosure norms, concepts and their measurements do not reveal the true magnitude of such liabilities and, therefore, make fiscal management and monitoring difficult; (ii) even in terms of narrower concept of revenue deficit considered in the FRBM, the target has not been met in the case of the Centre; (iii) in the attempt to meet the deficit targets, the qualitative aspects of expenditure management have not been given much emphasis. Thus, there is a need to redefine components of expenditure and also make targets in terms of those redefined components; (iv) the debt level remains intolerably high despite the reduction in deficit measured in the conventional sense. To a large extent, such a disconnection between fiscal deficit and debt arises due to off-budget liabilities and market stabilisation bonds which are not taken into fiscal deficit numbers. And, on the other hand, the collection under National Small Savings Fund (NSSF) forms liabilities of the Central Government while a larger portion of the same fund goes to finance the deficit of the State Governments; and (v) consequent upon (iv) and for the sake of greater transparency in fiscal matters, there is the need to reconcile the deficit and debt data (see Dholakia et al., 2004; Dholakia and Karan, 2005; Rangarajan and Srivastava, 2005; and RBI, 2005) and redefine the roadmap for fiscal consolidation in the years ahead.
Moreover, there is a concern arising out of the experience with the Fifth Pay Commission that the post-FRBM period will also witness the impact of the implementation of the Sixth Pay Commission on the finances of both the Central and State Governments. Simultaneously, under the rising prices of commodities (oil, fertilizers and food), there could be further pressure on the government finances if the present subsidy policy through issue of securities to companies/corporation of the Government is persisted. The Central Government has shown its concern on the increasing amount of such securities and has for the first time explicitly indicated the volume of these securities in the Budget 2008-09. Given the emerging concerns, the Finance Minister in his Budget Speech for 2008-09 indicated his intention to request the Thirteenth Finance Commission to revisit the roadmap for fiscal adjustment and suggest a suitable revised roadmap.
In this context, it may be argued that fiscal consolidation is intricately linked to the idea of debt sustainability or “tolerable” level of deficit and debt. The issue is whether this tolerable level of deficit and debt should be defined at the aggregate level (Centre and States combined) or separately for the Centre and the States. Although the aggregative level is important from the viewpoint of macroeconomic impact, for the practical purposes, in the federal political system prevailing in this country, there is sufficient autonomy at both the levels of government to follow independent fiscal behaviour and policies. In view of the different fiscal capacity between the Centre and States and the heterogeneity among the finances as well as socio-economic conditions of States, redesigning of fiscal architecture may have to be undertaken separately between the Centre and the States. For the States a different State specific fiscal architecture is required to address the State specific problems. Uniform fiscal architecture across the States would not be a feasible idea because: i) it would interfere with fiscal federalism and raise several issues regarding the autonomy/answerability / accountability of the State Governments; ii) it would lead to serious and often insurmountable data and measurement problems (see, Dholakia,2003); and iii) it could be grossly iniquitous for States to follow uniform framework, targets and parameters. For the States, while redesigning the fiscal architecture, the inter-state disparity will have to be recognised, which may require a different framework. Since the fiscal architecture for the State would require a different set of State specific fiscal architecture, aggregate targets for Centre and States may not be either relevant or meaningful. Thus, in this paper only the fiscal architecture of the Centre has been attempted leaving that of States for a separate exercise.
The rest of the paper is organised as follows. In section II, the study makes an assessment of the fiscal consolidation process at the Centre during the FRBM period by comparing the fiscal indicators vis-à-vis the targets set out in the FRBM Act and also the averages in the preceding two quinquennia. Section III is an attempt at reconciliation of the difference between the gross fiscal deficit and change in the outstanding debt of the Central Government. The main reasons for the difference between the two and the adjustment method is laid out in this section. Based on the Economic and Functional Classification, the section also reclassifies budgetary expenditures into current and investment expenditures as against revenue and capital components followed in the Budget. In section I V, the study provides a framework for designing the post-FRBM fiscal architecture, based on which various alternative scenarios of adjustment path can be thought of. Section V concludes.
SECTION II
FISCAL CONSOLIDATION AT CENTRE DURING THE FRBM
PERIOD: AN ASSESSMENT
With the enactment of FRBM Act, 2003 and FRBM Rules, 2004, the Central Government has been in the process of a uni-directional rule-based fiscal correction and consolidation since 2004-05. It is important to recognise that the existing FRBM rules of 2004 do not provide for the countercyclical fiscal policy stance. As a result, considerable improvement in the fiscal position of the Central Government is noticeable since then. In what follows, the study analyzes the trend in some of the major fiscal indicators during the FRBM period. It is relevant to note that, fortuitously, during this period, the economy grew consistently at a substantially higher rate of growth and the uni-directional FRBM rules appeared consistent with the countercyclical fiscal policy stance.
It can be seen from Table-1 that the major deficit indicators i.e. revenue deficit (RD), gross fiscal deficit (GFD) and primary deficit (PD) show substantial decline during 2004-09 compared to the earlier periods. Debt servicing (interest payment to revenue receipts) shows some improvement notwithstanding the rise in debt-GDP ratio. Though both revenue buoyancy and expenditure curtailment led to the improvement in the deficit indicators, much of the improvement arose due to the former. Improvement in the revenue followed from an unprecedented rise in the direct tax collection, which could be ascribed to the improvement in tax administration due to computerised information system and institution of tax information network (TIN) (Rao and Jena, 2008). However, the indirect tax collection and non-tax revenue as a proportion of GDP has been declining.
With regard to expenditure, both the revenue and the capital expenditure as a ratio to GDP declined. Much of the decline in the revenue expenditure in 2004-09 has been due to a decline in the interest payment owing to lower interest rate, because the non-interest or primary revenue expenditure actually increased due to inability to reduce the expenditure on subsidies (on food, fertilizer and oil) and the increase in grants to States. The decline in capital expenditure, however, is largely due to cessation of loans to the States, which were earlier classified as capital expenditures.
Table 1: Major Fiscal Indicators of the Central Government (Per cent of GDP) |
Item |
1991-92 to 1996-97 |
1997-98 to 2002-03 |
2003-04 to 2008-09* |
(Average) |
1 |
2 |
3 |
4 |
A. |
Revenue Indicators |
|
|
|
I. |
Revenue Receipts (3+4) |
9.3 |
9.0 |
10.3 |
|
1. |
Gross Tax Revenue |
9.5 |
8.7 |
11.0 |
|
|
a) |
Income Tax |
1.2 |
1.3 |
1.8 |
|
|
b) |
Corporation Tax |
1.3 |
1.6 |
3.2 |
|
|
c) |
Customs Duty |
3.0 |
2.2 |
2.0 |
|
|
d) |
Excise Duty |
3.7 |
3.2 |
3.0 |
|
|
e) |
Service Tax |
0.2 |
0.1 |
0.8 |
|
2. |
States Share in Taxes |
2.6 |
2.4 |
2.8 |
|
3. |
Net Tax Revenue (1-2) |
6.9 |
6.3 |
8.1 |
|
4. |
Non-Tax Revenue |
2.4 |
2.7 |
2.2 |
|
|
a) |
Interest Receipts |
1.6 |
1.6 |
0.7 |
|
|
b) |
Dividend & Profits |
0.3 |
0.6 |
0.7 |
|
|
c) |
Economic Services |
0.2 |
0.3 |
0.5 |
B. |
Expenditure Indicators |
|
|
|
II. |
Total Expenditure |
15.8 |
15.8 |
15.1 |
|
Revenue Expenditure |
12.1 |
12.9 |
12.5 |
|
a) |
Interest Payments |
4.2 |
4.6 |
3.9 |
|
b) |
Non-interest Revenue Expenditure |
7.9 |
8.3 |
8.6 |
|
|
i) |
Grants to States |
2.1 |
1.7 |
2.0 |
|
|
ii) |
Subsidies |
1.3 |
1.4 |
1.4 |
|
|
iii) |
Administrative Services |
0.4 |
0.5 |
0.4 |
|
Capital Expenditure |
3.7 |
2.9 |
2.6 |
|
a) |
Non-Defence Capital Outlay |
0.8 |
0.5 |
0.7 |
C. |
Deficit Indicators |
|
|
|
|
i) |
Revenue Deficit |
2.8 |
3.9 |
2.2 |
|
ii) |
Gross Fiscal Deficit |
5.6 |
5.9 |
3.6 |
|
iii) |
Primary Deficit |
1.4 |
1.3 |
0.0 |
D. |
Debt Indicators |
|
|
|
|
i) |
Debt |
52.6 |
55.5 |
61.7 |
|
ii) |
Interest Payments/Revenue Receipts |
44.0 |
50.5 |
40.9 |
* : 2007-08 relates to Revised Estimates and 2008-09 relates to Budget Estimates.
Source : Budget Documents of Government of India, various years and Misra and Khundrakpam, (2008). |
It is, however, interesting to note that despite the improvement in the fiscal indicators, the average debt to GDP ratio has been on the rise. This is due to the disconnection between the deficit and the debt, which needs to be bridged before making any roadmap on fiscal consolidation and is dealt in the next section.
While the fiscal position of the Central Government improved during the FRBM period, it is important to highlight whether the prescribed targets have been met or not. Some of the obligations of the Government under the FRBM Act, 2003 and FRBM Rules, 2004, as amended through the Finance Act, 2004 are as follows:
• To eliminate the revenue deficit by the financial year 2008-09 with a minimum annual reduction by 0.5 per cent of GDP.
• To reduce the fiscal deficit by an amount of at least 0.3 per cent of the GDP annually to less than 3 per cent of GDP by the end of 2008-09.
• To limit Government guarantees to at most 0.5 per cent of the GDP in any financial year.
• To limit additional liabilities (including external debt at current exchange rate) to 9 per cent of GDP in 2004-05, 8 per cent of GDP in 2005-06, 7 per cent of GDP in 2006-07, 6 per cent of GDP in 2007-08.
• Not to borrow directly from the Reserve Bank of India w.e.f. April 01, 2006.
It can be seen from Table 2 that, barring on the revenue deficit front, the progress with regard to the realisation of the targets under FRBM Act, 2003 and Rules thereunder has been satisfactory.1 It may also be noted that there was a pause in 2005-06 in order to operationalise the recommendations of the Twelfth Finance Commission (TFC) and implementation of the State level Value Added Tax (VAT). The Government announced in the Budget 2008-09 that, in view of commitments of certain revenue intensive expenditures oriented towards the social sectors, the target of elimination of RD would be rescheduled by a year.
Table 2: Achievements of FRBM Rules for the Central Government |
Parameter |
Provisions in the FRBM |
2003-04 |
2004-05 |
2005-06 |
2006-07 |
2007-08 (RE) |
2008-09 (BE) |
Fiscal Deficit (GFD) |
To be reduced by 0.3 per cent or more of GDP every year, beginning with the year 2004-05, so that it does not exceed 3 per cent of GDP by end-March 2009. |
4.5 |
4.0 |
4.1 |
3.4 |
3.1 |
2.5 |
|
|
(-0.1) |
(0.7) |
(0.3) |
(0.6) |
Revenue
Deficit
(RD) |
To be reduced by 0.5 per cent or more of GDP at the end of each year, beginning from 2004-05, in order to achieve elimination of the RD by March 31, 2009. |
3.6 |
2.5 |
2.6 |
1.9 |
1.4 |
1.0 |
|
|
(-0.1) |
(0.7) |
(0.5) |
(0.4) |
Contingent Liabilities |
The Central Government shall not give incremental guarantees aggregating an amount exceeding 0.5 per cent of GDP in any financial year beginning 2004-05. |
— |
0.64 |
0.07 |
-0.02 |
— |
— |
Additional Liabilities |
Additional liabilities (including external debt at current exchange rate) shall not exceed 9 per cent of GDP for the year 2004-05. In each subsequent year, the limit of 9 per cent of GDP shall be progressively reduced by at least one percentage point of GDP. |
— |
8.0 |
6.4 |
6.7 |
5.4* |
3.1* |
RE : Revised Estimates.BE : Budget Estimates.* : External debt for the years 2007-08 and 2008-09 are at book value.
Note : Figures in parentheses indicate reduction over the previous year. Negative sign indicates increase.
Source : Budget Documents of Government of India, various years. |
With the improvement in the fiscal performance of the Central Government, some of the traditional debt sustainability indicators have shown satisfactory values during the FRBM period. However, some other indicators such as generation of enough primary revenue surpluses to meet interest payment and reducing the proportion of repayment in gross market borrowing is not being met (Table 3). Further, as observed above, on an average the debt to GDP ratio has increased during the FRBM period from its average value during 1997-98 to 2002-03.
Table 3: Fiscal Sustainability of the Central Government: Indicator Analysis |
Indicators |
1997-98 to 2002-03 |
2003-04 to 2008-09 |
1 |
2 |
3 |
Nominal GDP growth rate minus growth rate of debt should be greater than zero |
-4.84 |
1.76 |
Real output growth rate minus real interest rate should be greater than zero |
-0.44 |
6.50 |
Primary balance should be in surplus (positive) |
-1.30 |
0.03 |
Primary revenue balance should be in surplus (positive) |
0.74 |
1.69 |
Primary revenue surplus to interest payments ratio should be greater than one |
0.16 |
0.45 |
Proportion of repayments to Gross Market Borrowings should be falling over time |
31.60 |
35.70 |
Debt service adjusted for primary revenue surplus to Gross Market Borrowings should be less than one |
1.05 |
0.87 |
Interest payments to GDP ratio should decline over time |
4.60 |
3.85 |
Interest payment to revenue expenditure ratio should decline overtime |
35.80 |
30.82 |
Interest payment to revenue receipts ratio should fall over time |
51.10 |
37.60 |
Source : Misra and Khundrakpam, (2008). |
There are a number of factors behind this anomaly between the movement in the deficit indicators and debt. Chief among them being: a) the exclusion of off-budget liabilities in GFD, while being recorded as a part of the outstanding liabilities; b) the growing proportion of market stabilisation bonds in the outstanding liabilities of the Government since 2004-05, which are not part of the fiscal deficit; c) inclusion of the special securities against small savings by the States in the outstanding liabilities of the Central Government since 1999-2000; and d) financing of fiscal deficit through either drawdown or built-up of cash balances with the Reserve Bank, which are not reflected in the outstanding liabilities.
In this context, it needs to be noted that a meaningful analysis and prescription for sustainable and tolerable level of debt would only be worthwhile when fiscal deficit is equivalently reflected in the change in outstanding debt. It is only then that once the sustainable and tolerable level of debt is defined, the corresponding required correction in fiscal deficit could be obtained. Next, having derived the required fiscal deficit, the compositional corrections could be worked out.
SECTION III
AN EXERCISE AT RECONCILIATION OF BUDGET FIGURES
Currently, the total outstanding liabilities reported in the Receipts Budget of the Government of India are a sum of the following components:
Outstanding Liabilities = Public Debt + Others liabilities (1)
Public debt = Internal Debt + External Debt (2)
Internal Debt = Market loans + Market Stabilisation Scheme (MSS) + Treasury Bills + Special Securities to Financial Institutions (includes off-
budget liabilities) + Central Securities against Small Savings + Securities Issued to International Financial Institutions (includes off-budget liabilities)
+ Others (such as Compensation and Other Bonds) (3)
Other Liabilities = National Small Savings Fund + State Provident Funds + Other Accounts (includes Off-budget Liabilities) + Reserve Funds and Deposits (4)
Combining (1) to (4)
Outstanding Liabilities = External Debt + Market loans + MSS + Treasury Bills + Special Securities to Financial Institutions (includes
off-budget liabilities) + Central Securities against Small Savings +
Securities Issued to International Financial Institutions (includes off-
budget liabilities) + Others (such as Compensation and Other Bonds) +
National Small Savings Fund + State Provident Funds + Other Accounts
(includes Off-budget Liabilities) + Reserve Funds and Deposits (5)
Of the above components, the treatment of MSS which was issued for the first time in 2004-05 can be debatable. It does not finance the fiscal deficit as defined till now, and hence it may be argued that it would be inappropriate to include it in deficit and debt because it is not used for incurring public expenditures per se, but for the purpose of sterilisation operation. The receipts under it are kept in a sequestered account with the RBI which is available only for repayment of MSS. The counter- arguments are that an important objective of MSS is to ensure exchange rate stability, which is recognised as equivalent to the export incentives by the Finance Minister in his Budget speech of February 29, 2008. Moreover, the borrowings under MSS are a part of the liabilities in the Consolidated Fund of India on which the government makes interest payments. The interest payments arising from MSS have an impact on the fiscal deficit, which is not financed by MSS but other components of receipts. Therefore, to make the GFD equal to change in outstanding debt, either the proceeds under MSS need to be excluded from the outstanding liabilities or be included in the measure of GFD. Here the second option was chosen on the ground that interest payments arising from MSS form a part of GFD, being a part of outstanding debt, and the proceeds from MSS are employed for financial investment by the Government on which there are no interest receipts.2
With regard to National Small Savings Fund (NSSF), it was established with effect from April 1, 1999 and is maintained in the public account of India. The balance of the collections into the NSSF over withdrawals is invested in special government securities issued by the Centre and the State Governments, i.e., Centre and the State Governments borrow from the NSSF on the basis of these special securities. The portion of the NSSF invested in special securities of Central Government is reported as part of the internal debt. However, the portion invested as special securities issued to State Governments continues to be included in the NSSF, shown as a part of other liabilities of the Central Government. The Central Government also has no interest payments obligation on this part of the NSSF utilised by the State Governments. The Central Government pays interest only on the part of the NSSF utilised by it and similarly the State Governments pay interest on the portion utilised by them. In other words, a part of the NSS liabilities is double counted in the liabilities of the Central Government, which needs to be excluded. Thus, the special securities issued to State Governments against NSSF were deducted from the outstanding liabilities of the Central Government.
In this context, it needs to be noted that prior to 1999-2000, all small savings were shown as part of “other liabilities” of Centre in the public account and the interest payments obligation on the entire small savings outstanding was with the Central Government. However, a portion of this fund went to the States by way of lending to States by the Centre, and therefore, was part of the fiscal deficit of the Centre. Correspondingly, the Centre received interest from the States on this on-lent portion. Thus, discrepancies between GFD and change in outstanding liabilities did not arise on this account till that point of time.
The off-budget liabilities, which arise due to securities issued to oil companies, Food Corporation of India and fertilizer companies are included in “Other Accounts” of other liabilities3. While the interest payments arising on these securities have an impact on the fiscal deficit, the issuance of these securities is excluded from the calculation of fiscal deficit. The Annual Financial Statement of the Union Budget recognises this subsidy expenditure under the relevant heads of economic services. However, these companies invest these receipts in special securities issued to them by the Government. In the present cash accounting system of the Government, since there is no immediate cash outflow from these transactions, they are finally netted out from the fiscal deficit numbers. In a true accounting sense, the subsidies that these securities represent should be included in the fiscal deficit, as in any case the liabilities arising from the issues of such securities are included in the total outstanding liabilities. Further, securities issued to national and international financial institutions which add to the outstanding liabilities under respective heads in the internal debt are also netted out from the capital expenditure as these are matched by corresponding capital receipts and there is no immediate cash outgo. Thus, the current issue of off-budget liabilities was added back to the GFD.
There is a fourth element which will make GFD different from change in outstanding liabilities, which is the change in cash balances of the Government. When the additional liabilities incurred is more than the financing requirement (GFD), the cash balances will increase and the vice versa. Therefore, the change in cash balances needs to be adjusted to make GFD equal to change in liabilities.
External liabilities in the Budget is recorded at historical exchange rate, and therefore, do not reflect the true volume of external debt of the Government. However, in the present context of equating GFD with change in liabilities, this practice may not be of much consequence because, the repayment of maturing external loans made at current exchange rate is netted from the additional external borrowing during the current year, which is also valued at current exchange rate. Therefore, the net addition to outstanding stock of external debt that goes to finance GFD during a particular year is valued at the current exchange rate.
Based on the above discussion, adjustments were made in both the total outstanding liabilities and GFD. Thus the adjusted outstanding liabilities is derived as,4
Adjusted Debt = Outstanding Liabilities - Securities of States against Small Savings = External Debt + Market loans + MSS + Treasury Bills + Special Securities to Financial Institutions + Central Securities against Small Savings + Others + National Small Savings Fund + State Provident Funds + Other Accounts + Reserve Funds and Deposits -Securities of States against Small Savings
The change in this adjusted debt is the derived GFD, which is then compared with the adjusted GFD. The adjusted GFD is obtained as the official GFD plus additional off-budget liabilities during a year plus additional MSS plus the change in cash balances. In this context, off-budget liabilities arising from the revenue expenditure side are treated as expenditure on subsidies, which is a part of the current expenditures, while those arising from the capital expenditure side are taken as financial investment. Expenditure on MSS is treated as financial investment.
Table-4 reports the difference between GFD and change in outstanding liabilities before and after the adjustment for the period 1991-92 to 2008-09 (B.E.). It can be seen that the change in unadjusted debt have been consistently higher than official GFD, and the difference got enlarged since 1999-2000 and further accelerated from 2004-05, reflecting the impact of NSSF portion going to States and MSS, respectively. Fitting a trend on the discrepancies shows a continuously enlarging gap between the two.5 During the period under consideration, the gap between two ranged from 0.0 to 4.6 percent of GDP.
Table 4: Adjusted and Unadjusted Debt and Deficit Series |
(in per cent) |
Year |
Unadjusted Debt/GDP |
Adjusted Debt/GDP |
Derived GFD/GDP |
Adjusted GFD/GDP |
Error after
adjustment
GFD/GDP |
Change in
unadjusted
Debt/GDP |
Unadjusted GFD |
Gap between
change in debt and GFD |
1 |
2 |
3 |
4 |
5 |
6=4-5 |
7 |
8 |
9=7-8 |
1991-92 |
54.2 |
54.2 |
6.1 |
5.9 |
0.2 |
6.1 |
5.5 |
0.6 |
1992-93 |
53.4 |
53.4 |
6.3 |
6.3 |
-0.1 |
6.3 |
5.3 |
0.9 |
1993-94 |
55.2 |
55.2 |
8.8 |
8.2 |
0.6 |
8.8 |
7.0 |
1.8 |
1994-95 |
53.0 |
53.0 |
6.0 |
6.2 |
-0.3 |
6.0 |
5.7 |
0.3 |
1995-96 |
50.9 |
50.9 |
5.7 |
5.2 |
0.5 |
5.7 |
5.1 |
0.6 |
1996-97 |
49.0 |
49.0 |
5.0 |
5.0 |
0.1 |
5.0 |
4.8 |
0.2 |
1997-98 |
51.0 |
51.0 |
6.7 |
6.8 |
-0.1 |
6.7 |
5.8 |
0.9 |
1998-99 |
50.9 |
50.9 |
6.5 |
6.5 |
0.0 |
6.5 |
6.5 |
0.0 |
1999-00 |
52.3 |
50.9 |
5.2 |
5.4 |
-0.1 |
6.6 |
5.4 |
1.3 |
2000-01 |
55.6 |
52.7 |
5.4 |
5.7 |
-0.3 |
7.0 |
5.7 |
1.4 |
2001-02 |
60.0 |
55.8 |
7.1 |
6.8 |
0.4 |
8.7 |
6.2 |
2.5 |
2002-03 |
63.5 |
58.1 |
6.3 |
6.1 |
0.2 |
7.9 |
5.9 |
1.9 |
2003-04 |
63.0 |
56.9 |
5.2 |
4.5 |
0.7 |
6.4 |
4.5 |
2.0 |
2004-05 |
63.3 |
54.8 |
5.0 |
4.1 |
0.9 |
8.2 |
4.0 |
4.2 |
2005-06 |
63.1 |
52.2 |
4.0 |
4.0 |
0.0 |
7.4 |
4.1 |
3.3 |
2006-07 |
61.2 |
50.3 |
5.3 |
5.1 |
0.1 |
6.7 |
3.4 |
3.3 |
2007-08 (RE) |
61.7 |
51.9 |
7.4 |
7.4 |
0.1 |
7.6 |
3.1 |
4.6 |
2008-09 (BE) |
57.7 |
48.7 |
2.7 |
2.9 |
-0.2 |
3.1 |
2.5 |
0.6 |
RE : Revised Estimates. BE : Budget Estimates.
Source : Authors’ estimates based on budget Documents of Government of India, various years. |
After adjustment in both the debt and GFD following the procedure described above, the gap between the change in the adjusted liabilities and GFD, however, narrows down significantly. Further, unlike in the pre-adjusted case, the differences are in both the directions ranging from -0.3 to 0.5 per cent of GDP, barring three years. Unlike the increasing discrepancies in the case of unadjusted series, the trend fit shows that on an average the discrepancies could not be differentiated from zero.6
In the exercise, drawing on the Economic and Functional Classification (E&FC) of Budget, the components of expenditure were reclassified into current and investment expenditure. This classification is in accordance with the accepted procedure of national income accounting wherein Government’s current expenditure comprises of i) consumption expenditure on wages and salaries, and purchase of commodities and services; and ii) subsidies and transfer payments. Accordingly, as per E&FC, a significant portion of the revenue expenditure reported in the Budget is investment in nature. On the other hand, as per current practices, defense capital outlay reported in the Budget is treated as consumption expenditure with one-third treated as wages and salaries and two-thirds as purchase of commodities and services.7 There is also some other component of capital expenditure reported in the Budget, which is treated as consumption expenditure in E&FC. In addition, off-budget liabilities which are incurred for providing subsidies to the oil marketing companies, Food Corporation of India (FCI) and fertilizer companies are included as current expenditure. With regard to investment expenditure, in addition to the adjustment made in E&FC, it included the net MSS issued and the off-budget special securities issued to national and international financial institutions as financial investment. Thus, the reclassification of current and investment expenditures are as in the following:
Current expenditure = revenue expenditure in budget + current off-budget securities issued + defense capital outlay + revenue component in capital outlay in E&FC - capital expenditure component in revenue expenditure in E&FC.
Investment expenditure = capital expenditure in budget + current net MSS issued + capital expenditure component in revenue expenditure in E&FC + special securities issued to national and international financial institutions - defense capital outlay - revenue component in capital outlay in E&FC.
Now, change in adjusted debt = GFD = current expenditure + net investment expenditure (investment expenditure - recovery of loans -disinvestment proceeds) - revenue receipts.Based on the above definition, Table 5 presents the reclassified expenditure series and compares them with that of the revenue and capital expenditure provided in the Budget. It can be observed that until 2003-04 revenue expenditure provided in the Budget was in general higher than the current expenditure, except for three years when the off-budget liabilities (issue of securities to provide subsidies) were relatively large. This was due to inclusion of large investment component in revenue expenditure. Despite the exclusion of these investment components from current expenditure, since 2005-06 the current expenditure has been consistently higher than the revenue expenditure due to increasing issuance of off-budget liabilities to provide subsidies to public sector companies (both financial and non-financial). Consequently, the revenue deficit reported in the Budget, which was in general higher than the current deficit, has reversed since 2005-06 due to increasing off-budget subsidies. Actual investment (capital plus financial) expenditure, on other hand, was consistently higher than the capital expenditure provided in the budget, except 2005-06 when net MSS issuance was negative. This gap enlarged in 2004-05 and 2007-08 due to large issuance of net MSS.
Table 5 : Re-classified Expenditure Series |
(in percent) |
Year |
Revenue
Expenditure
Budget
/GDP |
Current
Expenditure
/GDP |
Difference
Between
(1) and (2) |
Capital
Expenditure
Budget
/GDP |
Investment
Expenditure
/GDP |
Difference
Between
(4) and (5) |
Revenue
Deficit
Budget
/GDP |
Current
Deficit
/GDP |
1 |
2 |
3 |
4 |
5 |
6 |
7 |
8 |
9 |
1990-91 |
12.9 |
12.4 |
0.5 |
5.6 |
6.3 |
-0.7 |
3.3 |
2.7 |
1991-92 |
12.6 |
12.0 |
0.6 |
4.4 |
5.4 |
-1.0 |
2.5 |
1.9 |
1992-93 |
12.3 |
11.8 |
0.5 |
4.0 |
5.4 |
-1.4 |
2.5 |
2.0 |
1993-94 |
12.5 |
12.1 |
0.4 |
3.9 |
5.6 |
-1.7 |
3.8 |
3.4 |
1994-95 |
12.0 |
11.3 |
0.8 |
3.8 |
5.0 |
-1.2 |
3.1 |
2.3 |
1995-96 |
11.7 |
11.1 |
0.7 |
3.2 |
4.2 |
-0.9 |
2.5 |
1.8 |
1996-97 |
11.5 |
10.9 |
0.6 |
3.1 |
3.8 |
-0.7 |
2.4 |
1.7 |
1997-98 |
11.8 |
12.1 |
-0.2 |
3.4 |
4.2 |
-0.8 |
3.0 |
3.3 |
1998-99 |
12.4 |
11.4 |
0.9 |
3.6 |
4.5 |
-0.9 |
3.8 |
2.9 |
1999-00 |
12.8 |
11.9 |
0.9 |
2.5 |
3.3 |
-0.8 |
3.5 |
2.6 |
2000-01 |
13.2 |
12.6 |
0.6 |
2.3 |
3.0 |
-0.7 |
4.1 |
3.5 |
2001-02 |
13.2 |
13.0 |
0.2 |
2.7 |
3.6 |
-0.9 |
4.4 |
4.2 |
2002-03 |
13.8 |
13.0 |
0.8 |
3.0 |
3.9 |
-0.9 |
4.4 |
3.6 |
2003-04 |
13.1 |
12.5 |
0.7 |
4.0 |
4.8 |
-0.8 |
3.6 |
2.9 |
2004-05 |
12.2 |
11.9 |
0.3 |
3.6 |
6.3 |
-2.7 |
2.5 |
2.2 |
2005-06 |
12.3 |
12.4 |
-0.1 |
1.9 |
1.3 |
0.5 |
2.6 |
2.7 |
2006-07 RE |
12.4 |
13.0 |
-0.6 |
1.7 |
2.9 |
-1.2 |
1.9 |
2.5 |
2007-08 BE |
12.5 |
12.6 |
-0.1 |
2.6 |
6.4 |
-3.8 |
1.4 |
1.4 |
RE : Revised Estimates. BE : Budget Estimates.
Source : Authors’ estimates based on budget Documents of Government of India, and Economic and Functional Classification, various years. |
SECTION IV
POST FRBM FISCAL ARCHITECTURE
The framework
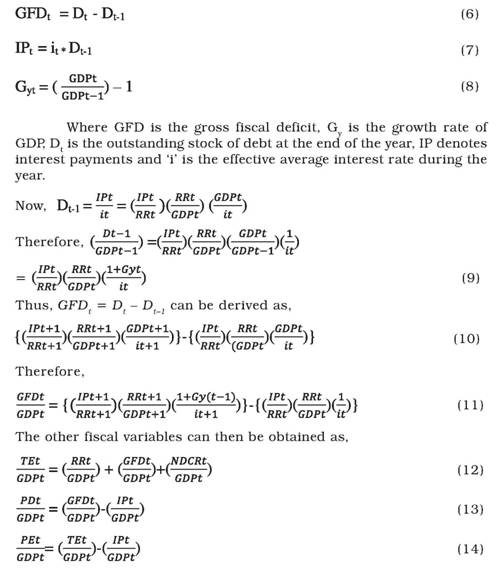
By definition,
Where, TE is total expenditure, PD is primary deficit, NDCR is non-debt creating capital receipts and PE is primary expenditure.
Other components of primary expenditure can then be broken down into its components as,
PEt = NICEt + CIt + FIt (15)
Where NICE denotes non-interest (or primary) current expenditure, CI is capital investment and FI is financial investment.
The model described above can be verbally described as follows: Given the average interest rate in the ensuing year, the interest payments to revenue receipts ratio (IP/RR) in the ensuing year would be determined by the debt to GDP ratio in the current year. The underlying justification for considering the IP/RR ratio here is that it is difficult to define a sustainable Debt/GDP ratio in terms of a precise number (see, Ram Mohan et al., 2005). Further, in a high growth environment, the traditional sustainability analysis may indicate a favorable debt dynamics just on account of GDP growth, but without a strong indication of the precise adjustment path (Ibid.). On the other hand, the Government would be in a much better position to decide on how much of the current revenues it can afford for paying interest on its borrowing in the coming years (TFC, 2004). As the interest payments in a particular year depends on the outstanding stock of debt of the previous year for a given rate of interest, the achievement of a required IP/RR at time ‘t+1’ would necessitate restricting debt/GDP ratio at a particular level at time ‘t’ (equation 4). The tolerable debt/GDP ratio at time ‘t’ corresponding to a targeted IP/ RR at time ‘t+1’ would depend upon the growth of GDP, the response of revenue receipts to GDP and the evolving pattern of average interest rates. Depending upon the chosen degree of correction in IP/RR over a given time frame, the tolerable debt/GDP ratio can then be sequentially obtained. The required GFD could be derived as the difference between the two corresponding debt/GDP ratio (equation 10 and 11). Having derived the required GFD and given the revenue receipts, the total expenditure can be obtained as summation of the two. By netting out the interest payments component from GFD and total expenditure, respectively, the primary deficit and primary expenditure can be derived. The primary expenditure can further be distributed between the current and investment expenditures by adjusting the discretionary components to arrive at the desired composition.
Thus, various alternative scenarios of adjustment path based on the levels of IP/RR to be achieved by the terminal year can be conceived by making assumptions on three crucial parameters viz., ‘i’, RR and GDP. Three alternative scenarios for each of these parameters were assumed.
Real GDP:
1) High Growth - step up from 8.5 to 10.0 per cent, by 0.25 percentage points each year during 2008-09 to 2014-15;
2) Medium Growth - to step up from 7.5 to 9.0 per cent, by 0.25 percentage points each year during 2008-09 to 2014-15; and
3) Lower Growth - to step up from 6.5 to 8.0 per cent, by 0.25 percentage points each year during 2008-09 to 2014-15;
Inflation:
It would decelerate by 0.25 percentage points each year from 5.5 to 4.0 per cent during the period under consideration.
Nominal GDP:
Given the assumption on inflation, the nominal GDP growth rates corresponding to the above-mentioned three real GDP growth scenarios are:
1) 14 per cent;
2) 13 per cent and
3) 12 per cent.
Even with the current slow down expected in the real GDP growth rate and the pessimistic forecasts of growth and inflation rates next year, the three scenarios of nominal GDP growth considered here still remain relevant and likely.
Revenue Receipts:
Revenue receipts are assumed to grow in two alternative ways:
1) High Buoyancy Scenario wherein the revenue receipts grow annually by the estimated buoyancy with respect to real GDP growth and inflation (in terms of GDP deflator) during the period 1991 to 2008. The estimated buoyancies are 1.67 and 0.39 with respect to real GDP and price, respectively;8 This works out to growth in revenue receipts exceeding nominal GDP growth by about 2-4 percentage points during the forecast period.
2) Low Buoyancy Scenario wherein the revenue receipts grow by only one percentage point above the nominal GDP growth during the forecast period.
Average Interest Rate:
Three alternative scenarios for the average effective interest rate considered are:
1) It would remain the same at the base year level
2) It would reduce by 0.1 percentage point every year
3) It would behave based on a realistic forecast. The forecast is done in the following manner. From the available information on the profile of the maturity pattern and coupon rate on securities (market loans, securities issued under MSS and special securities converted into marketable securities) issued by the Government, the weighted average coupon rate of the past securities that would remain outstanding during the forecast period is known. Based on the trend observed during the last three-four years, the share of these old securities in the total outstanding liabilities would decline by about 1.16 percentage points each year to 35.0 percent in 2015-16 from 43 percent in 2007-08. Other liabilities (liabilities incurred without issue of securities) on an average have formed about 45.0 percent of the total liabilities, which is assumed to remain the same during the forecast period. The average interest rate on these liabilities is obtained as interest payment in that year divided by outstanding stock of the previous year and is assumed to remain at 7.2 percent (the average during 2005-06 to 2007-08). The rest of the outstanding liabilities would arise from fresh issue of securities which will increase from 12 percent in 2007-08 to 20 percent in 2015-16 and the rate of interest on them is assumed to remain constant at the 2007-08 level of 7.87 percent. The overall average interest rate is obtained as the average of the interest on these three groups of liabilities weighted by their respective proportion in the total.
Interest Payments to Revenue Receipts (IP/RR)
IP/RR is considered as the target variable of the Government, which is to be reduced to a particular target by the year 2014-15 and thereafter would be kept constant. It may be noted that the terminal year for all other fiscal variables like Debt/GDP ratio, GFD, PD, etc. is 2013-14 because, only then, the target for IP/RR in the subsequent year can be achieved. Three alternative targets which have been chosen for the present study are:
1) 22 per cent
2) 20 per cent and
3) 18 per cent.
From a combination of these assumed values of the parameters, 54 alternative scenarios of adjustment path are generated over the medium term. In all the scenarios the terminal year of adjustment is 2013-14. In order to gauge the fiscal comfort once the target has been achieved, for each of the scenarios, the interest rate and revenue receipts to GDP ratio in 2014-15 was fixed at the 2013-14 (terminal year) level and IP/RR in 2015-16 at 2014-15 or the targeted level. For simplicity, it was assumed that the non-debt capital receipts are zero during the forecast period. This assumption adds the much needed flexibility into the exercise in case the fiscal policy has to be countercyclical during the slow down phase and the strict targets of fiscal discipline have to be deferred temporarily. By appropriately using the non-debt creating capital receipts in the same or subsequent years, it would still be possible to follow the targeted fiscal adjustment path.
As would be expected, it is seen that the more the targeted reduction in the IP/RR ratio by the terminal year, the lower would be the tolerable debt/GDP ratio and thus greater the required reduction in GFD. However, if the rate of interest would decline, the same level of IP/RR can be achieved at a higher level of debt and GFD, since interest payments would be lower for a given level of debt. Similarly, the lower the rate of interest and lesser the targeted reduction in IP/RR, the higher would be the tolerable level of primary deficit of the Government. Thus, for a given targeted reduction in the current deficit, the level of investment that the Government can make would be determined by the level of GFD consistent with the chosen target of IP/RR.
With other things remaining the same, the lower the growth rate of the economy the lower would be the tolerable level of debt/GDP and GFD/GDP for any targeted reduction in IP/RR and given level of interest rate. Consequently, for a given level of current deficit, the ability of the Government to make investment would be lesser at lower rate of growth. And if the revenue buoyancy would also decline, the tolerable level of deficit and debt would lower further, and consequently, the ability of the Government to incur expenditure for investment purposes would all the more be lesser. These scenarios summarised in Tables 6A and 6B are elaborated further in the following.
Starting from a situation of 14.0 per cent growth in nominal GDP, constant interest rate and the continuance of high revenue buoyancy, the required reduction in debt/GDP ratio would range from about 6 to 17 percentage points by the terminal year, depending upon the IP/RR target of 22 to 18 per cent. The lower the IP/RR target the higher the required reduction in deficit and debt to GDP ratio. For IP/ RR target of 22 percent, the Government would likely be able to maintain GFD of over 4 percent of GDP and run a primary deficit of over 1.0 percent. The Government would thus be able to maintain the level of investment of over 4.0 percent of GDP provided the current deficit is brought down to zero by the terminal year. However, for lower IP/RR targets of 18.0 percent, the GFD/GDP would have to be drastically brought down to less 2.0 percent and there would be the need to generate primary surplus. The ability of the Government to make investment would also be severely curtailed until and unless sufficient current surplus is generated.
Should the interest rate also decline to the extent of the forecast, the tolerable level of deficit and debt would be somewhat higher and, therefore, the required reduction in them would also be lesser. Still substantial squeeze in investment expenditure would be required if the IP/RR is to be brought down to 20.0 percent or below. However, if the rate of interest softens more than the forecast, say by 0.1 percentage points each year up to 2013-14, the Government would be able to incur a higher primary expenditure and run a deficit of about 5.5 percent of GDP and yet reduce IP/RR by about 11.0 percentage points to 22.0 percent. By bringing down the current deficit to zero, the Government can maintain the level of investment close to 5.5 percent of GDP by 2014-15. However, if the Government wants to bring down the IP/RR to either 20 percent or lower, it would still require curtailing primary expenditure and run a lower deficit and debt, and consequently, much lower investment expenditure.
It may, however, be noted that once the required reduction in IP/ RR is achieved and it is maintained at that level in the following year (2014-15), the Government would be able to run a much higher level of deficit and investment even when revenue receipts to GDP ratio is kept constant. For instance, under the growth scenario of 14.0 percent, the Government in the immediate year succeeding the terminal year could be in a position to run GFD/GDP ratio ranging from 5.0 percent to 6.5 percent depending upon the three interest rate environment and the targeted reduction in IP/RR that is to be sustained. Assuming the current deficit is maintained at zero, the corresponding investment to GDP ratio could thus be raised substantially to the level of GFD. This situation, however, crucially hinges upon the maintenance of GDP growth and the revenue buoyancy.
For the same level of IP/RR target, a one percent decline in GDP growth to 13.0 percent would require additional reduction in debt/GDP ratio by about two percentage points and GFD/GDP by about a half to one percentage point, depending upon the interest rate environment. Thus, for a similar targeted reduction in the current deficit, the ability of the Government to undertake investment expenditure would also decline. Needless to say, a further decline in GDP growth would make the required reduction in deficit and debt to achieve the same level of IP/RR to be much larger. Generation of primary surplus would also be required until and unless interest rate declines sufficiently and the IP/RR target is also less restrictive. As the primary expenditure would be required to be brought down sufficiently, the investment expenditure would have to be curtailed significantly from the base year level even under the most favorable interest rate environment and least restrictive targeted correction in IP/RR of 22.0 percent. The ability of the Government to incur a higher deficit once the targeted reduction in IP/RR has been achieved would also be lesser. The greater the degree of deceleration in the growth of the economy and the more unfavorable is the interest rate environment; the lower would be tolerable level of GFD in the post-terminal year. At nominal GDP growth of 12.0 percent, the tolerable GFD/ GDP ratio to maintain the IP/RR at the targeted level in the post-terminal year would range from 3.8 to 5.0 percent; much lower than the base year level and that could be obtained under higher growth scenario of 14.0 percent.
Given the growth rate, the tolerable level of deficit and debt for a given targeted reduction in IP/RR would also crucially hinge on the revenue buoyancy, and may even turn out to be more crucial than the growth of GDP as far as the process of fiscal consolidation is concerned. If the revenue buoyancy would decline such that revenue grows only by one percentage point more than the nominal GDP growth, it is revealed from the exercise that the required reduction in debt and deficit to achieve the same target of IP/RR would be much larger. Depending upon the alternative combination of IP/RR target and interest rate environment, the required reduction in debt to GDP ratio by 2013-14 at nominal GDP growth of 14.0 percent would range from 14.0 percentage points to 21 percentage points, as against the range of 6 to 17 percentage points when revenue buoyancy is sustained. Therefore, the corresponding terminal year tolerable level of GFD would range from 3.79 percent to 0.74 percent as compared to base year level of 7.41 percent. At such magnitudes of correction, primary expenditure would have to be severely curtailed by a range of 2.0 to 4.5 percentage points of GDP in order to generate primary surplus. The ability of the Government to make investment would also be severely limited. Assuming balanced current account, the investment to GDP ratio could range from 0.5 to 3.5 percent only as against 1.5 to 5.2 percent in the case of non-decline in revenue buoyancy, the base year level of the investment ratio being 5.7 percent. Yet, once the IP/RR target has been achieved, the Government would be able to raise the level of GFD in the range of 4.4 to 5.8 percent in the subsequent year if the GDP growth is maintained, which will enable raising the level of investment expenditure albeit lower than base year level.
Under the more pessimistic scenario of decline in revenue buoyancy accompanied by deceleration in growth, the tolerable level of deficit and debt would be all the more lower. With one percentage point decline in GDP growth, to achieve the tolerable level of deficit and debt corresponding to the targeted IP/RR, the Government would be required to cut down the primary expenditure substantially. Even under 0.1 percentage point decline in interest rate each year and the least restrictive IP/RR target of 22.0 percent, the primary expenditure would need to be brought down by at least 2.5 percentage points of GDP, while it would be by about 5.0 percentage points for IP/RR of 18.0 percent with constant interest rate. The corresponding GFD could slightly be above 3.0 percent of GDP, which would also be the cap on investment expenditure with a zero current deficit. But with IP/RR target of 18.0 percent and constant interest rate, the tolerable level of GFD would be almost zero. Should the growth of GDP decline further by one percentage point, the Government would be severely constrained to incur deficit. The Government would at the most run GFD of the less than 3.0 percent of GDP even under declining rate of interest and the least restrictive reduction in IP/RR. However, once the target has been achieved, the Government would be able to run a higher deficit ranging from 3.7 to 4.9 percent of GDP.
From the 54 alternative scenarios, the most lenient scenario turns out to be the one when the nominal GDP grows at 14.0 per cent, interest rate declines by 0.1 per cent each year while the revenue buoyancy is sustained and the targeted level of IP/RR is 22.0 per cent by 2013-14. The Government would be required to reduce the debt/GDP ratio to about 46.0 per cent by 2013-14, which can be achieved at a GFD/GDP ratio of over 5.0 per cent. This would also be consistent with a higher primary expenditure to GDP ratio than the base year and a primary deficit of above 2.0 per cent of GDP. By bringing down the current deficit to zero, the Government would be able to slowly raise the investment expenditure to near the base year level of about 5.7 per cent of GDP. Even with constant revenue receipts to GDP ratio, the same targeted IP/RR can be maintained in the subsequent years at a higher deficit of over 6.0 percent.
On the other hand, under the most pessimistic scenario of 12 percent nominal growth of GDP, decline in revenue buoyancy while interest rate remaining constant and stiffer targeted reduction in IP/RR to 18.0 percent, the required correction in debt/GDP ratio would be by about 21 percentage points to 31.0 per cent. This would require almost a balanced fiscal deficit to be achieved by cutting down the primary expenditure by more than 5.0 percentage points of GDP to less than 10.0 percent. Until and unless the Government generates enough current surpluses, expenditure for investment purposes would have to be severely curtailed. Yet, the generation of the current surplus would be all the more difficult in view of the required large scale cut in primary expenditure and the inherent downward rigidity in the current component of the primary expenditure, particularly so when the reduction is to be done in a short span of 4-5 years.
It is evident from the above scenarios that the Government could face a trade-off between the various alternative combinations of growth, revenue buoyancy and targeted IP/RR. The trade-off emerging from the framework is summarised in Table 7. Starting from a situation of nominal GDP growth of 14.0 percent under constant interest rate, a one percent decline in nominal GDP growth to 13.0 percent would necessitate lowering debt/GDP ratio further by a range of 1.4 to 1.8 percentage points up to the terminal year depending upon the targeted IP/RR. Consequently, GFD/GDP ratio needs to be reduced by additional 0.6 to 0.8 percentage points of GDP and the primary deficit by 0.5 to 0.7 percentage points. Given the current deficit, the required additional reduction in debt and deficit would translate into curtailment in the investment expenditure by 0.6 to 0.8 percentage points of GDP. Two percentage points deceleration in growth rate would almost double the required additional reduction in each of the above deficit indicators.
Table 6A: Alternative Fiscal Correction Path Under Three Different Assumptions of Growth and Interest Rate – High Revenue Buoyancy Scenario |
(in percent) |
Base Year (2007-08) |
Debt in base year |
GFD in base year |
PD in base year |
CD in base year |
ID in base year |
PE in base year |
IP in base year |
(as % of GDP) |
52.0 |
7.41 |
3.72 |
1.40 |
6.00 |
14.94 |
3.68 |
High Revenue Buoyancy Growth Rate: 14% & Constant Interest Rate |
Scenarios – IP/RR Target |
Debt Target |
GFD Target |
PD Target |
CD Target |
ID Target |
PE Target |
IP Target |
|
2013-14 |
2014-15 |
2013-14 |
2014-15 |
2013-14 |
2014-15 |
2013-14 |
2014-15 |
2013-14 |
2014-15 |
2013-14 |
2014-15 |
2013-14 |
2014-15 |
1. |
IP/RR 22.0% |
42.89 |
42.89 |
4.42 |
6.00 |
1.36 |
3.06 |
0.00 |
0.00 |
4.40 |
6.21 |
14.31 |
16.45 |
3.06 |
2.95 |
2. |
IP/RR 20.0% |
39.03 |
38.99 |
3.12 |
5.42 |
0.28 |
2.74 |
0.00 |
0.00 |
3.10 |
5.63 |
13.23 |
16.14 |
2.84 |
2.68 |
3. |
IP/RR 18.0% |
35.07 |
35.11 |
1.80 |
4.95 |
-0.83 |
2.55 |
0.00 |
0.00 |
1.78 |
5.16 |
12.12 |
15.94 |
2.62 |
2.41 |
Growth Rate: 14% & Interest Rate reduction by 0.1% |
|
Debt Target |
GFD Target |
PD Target |
CD Target |
ID Target |
PE Target |
IP Target |
|
2013-14 |
2014-15 |
2013-14 |
2014-15 |
2013-14 |
2014-15 |
2013-14 |
2014-15 |
2013-14 |
2014-15 |
2013-14 |
2014-15 |
2013-14 |
2014-15 |
4. |
IP/RR 22.0% |
46.45 |
46.48 |
5.44 |
6.54 |
2.38 |
3.59 |
0.00 |
0.00 |
5.42 |
6.75 |
15.33 |
16.99 |
3.06 |
2.95 |
5. |
IP/RR 20.0% |
42.27 |
42.26 |
3.99 |
5.90 |
1.15 |
3.22 |
0.00 |
0.00 |
3.97 |
6.11 |
14.10 |
16.62 |
2.84 |
2.68 |
6. |
IP/RR 18.0% |
37.96 |
38.01 |
2.51 |
5.37 |
-0.12 |
2.96 |
0.00 |
0.00 |
2.49 |
5.58 |
12.84 |
16.36 |
2.62 |
2.41 |
Growth Rate: 14% & Interest Rate based on forecast |
|
Debt Target |
GFD Target |
PD Target |
CD Target |
ID Target |
PE Target |
IP Target |
|
2013-14 |
2014-15 |
2013-14 |
2014-15 |
2013-14 |
2014-15 |
2013-14 |
2014-15 |
2013-14 |
2014-15 |
2013-14 |
2014-15 |
2013-14 |
2014-15 |
7. |
IP/RR 22.0% |
43.91 |
43.93 |
4.65 |
6.17 |
1.59 |
3.23 |
0.00 |
0.00 |
4.63 |
6.38 |
14.54 |
16.62 |
3.06 |
2.95 |
8. |
IP/RR 20.0% |
39.95 |
39.94 |
3.32 |
5.57 |
0.47 |
2.89 |
0.00 |
0.00 |
3.30 |
5.78 |
13.43 |
16.29 |
2.84 |
2.68 |
9. |
IP/RR 18.0% |
35.85 |
35.94 |
1.93 |
5.13 |
-0.69 |
2.72 |
0.00 |
0.00 |
1.91 |
5.34 |
12.27 |
16.12 |
2.62 |
2.41 |
Table 6A: Alternative Fiscal Correction Path Under Three Different Assumptions of Growth and Interest Rate – High Revenue Buoyancy Scenario (Contd.) |
(in percent) |
|
Growth Rate: 13% & Constant Interest Rate |
|
Debt Target |
GFD Target |
PD Target |
CD Target |
ID Target |
PE Target |
IP Target |
|
2013-
14 |
2014-15 |
2013-
14 |
2014-15 |
2013-
14 |
2014-15 |
2013-
14 |
2014-15 |
2013-
14 |
2014-15 |
2013-
14 |
2014-15 |
2013-
14 |
2014-15 |
10. IP/RR 22.0% |
41.13 |
41.25 |
3.59 |
5.49 |
0.62 |
2.64 |
0.00 |
0.00 |
3.57 |
5.70 |
13.21 |
15.60 |
2.97 |
2.85 |
11. IP/RR 20.0% |
37.43 |
37.50 |
2.41 |
4.95 |
-0.36 |
2.36 |
0.00 |
0.00 |
2.39 |
5.16 |
12.24 |
15.32 |
2.77 |
2.59 |
12. IP/RR 18.0% |
33.63 |
33.77 |
1.19 |
4.53 |
-1.37 |
2.20 |
0.00 |
0.00 |
1.17 |
4.74 |
11.23 |
15.16 |
2.55 |
2.33 |
|
Growth Rate: 13% & Interest Rate reduction by 0.1% |
|
Debt Target |
GFD Target |
PD Target |
CD Target |
ID Target |
PE Target |
IP Target |
|
2013-
14 |
2014-15 |
2013-
14 |
2014-15 |
2013-
14 |
2014-15 |
2013-
14 |
2014-15 |
2013-
14 |
2014-15 |
2013-
14 |
2014-15 |
2013-
14 |
2014-15 |
13. IP/RR 22.0% |
44.54 |
44.70 |
4.52 |
5.97 |
1.55 |
3.12 |
0.00 |
0.00 |
4.50 |
6.18 |
14.15 |
16.08 |
2.97 |
2.85 |
14. IP/RR 20.0% |
40.53 |
40.64 |
3.19 |
5.39 |
0.43 |
2.79 |
0.00 |
0.00 |
3..17 |
5.60 |
13.03 |
15.75 |
2.77 |
2.59 |
15. IP/RR 18.0% |
36.40 |
36.57 |
1.83 |
4.93 |
-0.72 |
2.60 |
0.00 |
0.00 |
1.81 |
5.14 |
11.87 |
15.56 |
2.55 |
2.33 |
|
Growth Rate: 13% & Interest Rate based on forecast |
|
Debt Target |
GFD Target |
PD Target |
CD Target |
ID Target |
PE Target |
IP Target |
|
2013-
14 |
2014-15 |
2013-
14 |
2014-15 |
2013-
14 |
2014-15 |
2013-
14 |
2014-15 |
2013-
14 |
2014-15 |
2013-
14 |
2014-15 |
2013-
14 |
2014-15 |
16. IP/RR 22.0% |
42.10 |
42.25 |
3.80 |
5.64 |
0.83 |
2.79 |
0.00 |
0.00 |
3.78 |
5.85 |
13.42 |
15.75 |
2.97 |
2.85 |
17. IP/RR 20.0% |
38.31 |
38.41 |
2.58 |
5.09 |
-0.19 |
2.49 |
0.00 |
0.00 |
2.56 |
5.30 |
12.41 |
15.45 |
2.77 |
2.59 |
18. IP/RR 18.0% |
34.41 |
34.56 |
1.32 |
4.65 |
-1.23 |
2.32 |
0.00 |
0.00 |
1.30 |
4.86 |
11.37 |
15.28 |
2.55 |
2.33 |
Table 6A: Alternative Fiscal Correction Path Under Three Different Assumptions of Growth and Interest Rate – High Revenue Buoyancy Scenario (Contd.) |
(in percent) |
|
Growth Rate: 12% & Constant Interest Rate |
|
Debt Target |
GFD Target |
PD Target |
CD Target |
ID Target |
PE Target |
IP Target |
|
2013-
14 |
2014-15 |
2013-
14 |
2014-15 |
2013-
14 |
2014-15 |
2013-
14 |
2014-15 |
2013-
14 |
2014-15 |
2013-
14 |
2014-15 |
2013-
14 |
2014-15 |
19. IP/RR 22.0% |
39.40 |
39.32 |
2.82 |
4.63 |
-0.07 |
1.88 |
0.00 |
0.00 |
2.80 |
4.84 |
12.17 |
14.40 |
2.89 |
2.76 |
20. IP/RR 20.0% |
35.85 |
35.74 |
1.73 |
4.18 |
-0.95 |
1.67 |
0.00 |
0.00 |
1.71 |
4.39 |
11.29 |
14.20 |
2.69 |
2.51 |
21. IP/RR 18.0% |
32.22 |
32.18 |
0.62 |
3.83 |
-1.86 |
1.58 |
0.00 |
0.00 |
0.60 |
4.04 |
10.38 |
14.10 |
2.48 |
2.25 |
|
Growth Rate: 12% & Interest Rate reduction by 0.1% |
|
Debt Target |
GFD Target |
PD Target |
CD Target |
ID Target |
PE Target |
IP Target |
|
2013-
14 |
2014-15 |
2013-
14 |
2014-15 |
2013-
14 |
2014-15 |
2013-
14 |
2014-15 |
2013-
14 |
2014-15 |
2013-
14 |
2014-15 |
2013-
14 |
2014-15 |
22. IP/RR 22.0% |
42.67 |
42.60 |
3.66 |
5.04 |
0.77 |
2.29 |
0.00 |
0.00 |
3.64 |
5.25 |
13.01 |
14.81 |
2.89 |
2.76 |
23. IP/RR 20.0% |
38.83 |
38.73 |
2.44 |
4.55 |
-0.24 |
2.04 |
0.00 |
0.00 |
2.42 |
4.76 |
12.00 |
14.57 |
2.69 |
2.51 |
24. IP/RR 18.0% |
34.87 |
34.85 |
1.19 |
4.17 |
-1.29 |
1.91 |
0.00 |
0.00 |
1.17 |
4.38 |
10.96 |
14.44 |
2.48 |
2.25 |
|
Growth Rate: 12% & Interest Rate based on forecast |
|
Debt Target |
GFD Target |
PD Target |
CD Target |
ID Target |
PE Target |
IP Target |
|
2013-
14 |
2014-15 |
2013-
14 |
2014-15 |
2013-
14 |
2014-15 |
2013-
14 |
2014-15 |
2013-
14 |
2014-15 |
2013-
14 |
2014-15 |
2013-
14 |
2014-15 |
25. IP/RR 22.0% |
40.33 |
40.26 |
3.00 |
4.76 |
0.11 |
2.00 |
0.00 |
0.00 |
2.98 |
4.97 |
12.36 |
14.53 |
2.89 |
2.76 |
26. IP/RR 20.0% |
36.70 |
36.60 |
1.88 |
4.29 |
-0.80 |
1.78 |
0.00 |
0.00 |
1.86 |
4.50 |
11.44 |
14.31 |
2.69 |
2.51 |
27. IP/RR 18.0% |
32.96 |
32.94 |
0.73 |
3.93 |
-1.75 |
1.68 |
0.00 |
0.00 |
0.71 |
4.14 |
10.50 |
14.21 |
2.48 |
2.25 |
GFD : Gross Fiscal Deficit. PD: Primary Deficit. CD: Current Deficit.
ID : Investment Deficit PE: Primary Expenditure. IP : Interest Payments.
Note: In all the scenarios the terminal year of adjustment is 2013-14. In order to gauge the fiscal comfort once the target has been achieved, for each of the scenarios, the interest rate, revenue receipts to GDP ratio and the IP/RR in 2014-15 was fixed at the 2013-14 (terminal year) level. |
Table 6B : Alternative Fiscal Correction Path Under Three Different Assumptions of Growth and Interest Rate – Low Revenue Buoyancy Scenario |
(in percent) |
Base Year (2007-08) |
Debt in base year |
GFD in base year |
PD in base year |
CD in base year |
ID in base year |
PE in base year |
IP in base year |
(as % of GDP) |
52.0 |
7.41 |
3.72 |
1.40 |
6.00 |
14.94 |
3.68 |
Low Revenue Buoyancy Growth Rate: 14% & Constant Interest Rate |
Scenarios – IP/RR Target |
Debt Target |
GFD Target |
PD Target |
CD Target |
ID Target |
PE Target |
IP Target |
|
2013-14 |
2014-15 |
2013-14 |
2014-15 |
2013-14 |
2014-15 |
2013-14 |
2014-15 |
2013-14 |
2014-15 |
2013-14 |
2014-15 |
2013-14 |
2014-15 |
28.IP/RR 22.0% |
38.44 |
38.42 |
2.94 |
5.36 |
0.14 |
2.72 |
0.00 |
0.00 |
2.92 |
5.57 |
12.04 |
14.72 |
2.81 |
2.64 |
29.IP/RR 20.0% |
34.98 |
34.92 |
1.86 |
4.84 |
-0.75 |
2.43 |
0.00 |
0.00 |
1.84 |
5.05 |
11.15 |
14.44 |
2.61 |
2.40 |
30.IP/RR 18.0% |
31.43 |
31.45 |
0.74 |
4.42 |
-1.67 |
2.26 |
0.00 |
0.00 |
0.72 |
4.63 |
10.23 |
14.27 |
2.41 |
2.16 |
|
Growth Rate: 14% & Interest Rate reduction by 0.1% |
|
Debt Target |
GFD Target |
PD Target |
CD Target |
ID Target |
PE Target |
IP Target |
|
2013-14 |
2014-15 |
2013-14 |
2014-15 |
2013-14 |
2014-15 |
2013-14 |
2014-15 |
2013-14 |
2014-15 |
2013-14 |
2014-15 |
2013-14 |
2014-15 |
31.IP/RR 22.0% |
41.63 |
41.63 |
3.79 |
5.83 |
0.98 |
3.19 |
0.00 |
0.00 |
3.77 |
6.04 |
12.89 |
15.19 |
2.81 |
2.64 |
32.IP/RR 20.0% |
37.88 |
37.84 |
2.57 |
5.26 |
-0.04 |
2.86 |
0.00 |
0.00 |
2.55 |
5.47 |
11.86 |
14.86 |
2.61 |
2.40 |
33.IP/RR 18.0% |
34.02 |
34.06 |
1.32 |
4.81 |
-1.09 |
2.65 |
0.00 |
0.00 |
1.30 |
5.02 |
10.81 |
14.65 |
2.41 |
2.16 |
|
Growth Rate: 14% & Interest Rate based on forecast |
|
Debt Target |
GFD Target |
PD Target |
CD Target |
ID Target |
PE Target |
IP Target |
|
2013-14 |
2014-15 |
2013-14 |
2014-15 |
2013-14 |
2014-15 |
2013-14 |
2014-15 |
2013-14 |
2014-15 |
2013-14 |
2014-15 |
2013-14 |
2014-15 |
34.IP/RR 22.0% |
39.35 |
39.34 |
3.13 |
5.50 |
0.32 |
2.86 |
0.00 |
0.00 |
3.11 |
5.71 |
12.23 |
14.87 |
2.81 |
2.64 |
35.IP/RR 20.0% |
35.81 |
35.76 |
2.01 |
4.97 |
-0.60 |
2.56 |
0.00 |
0.00 |
1.99 |
5.18 |
11.30 |
14.57 |
2.61 |
2.40 |
36.IP/RR 18.0% |
32.13 |
32.19 |
0.85 |
4.57 |
-1.56 |
2.41 |
0.00 |
0.00 |
0.83 |
4.78 |
10.34 |
14.42 |
2.41 |
2.16 |
Table 6B : Alternative Fiscal Correction Path Under Three Different Assumptions of Growth and Interest Rate – Low Revenue Buoyancy Scenario (Contd.) |
(in percent) |
|
Growth Rate: 13% & Constant Interest Rate |
|
Debt Target |
GFD Target |
PD Target |
CD Target |
ID Target |
PE Target |
IP Target |
|
2013-14 |
2014-15 |
2013-14 |
2014-15 |
2013-14 |
2014-15 |
2013-14 |
2014-15 |
2013-14 |
2014-15 |
2013-14 |
2014-15 |
2013-14 |
2014-15 |
37.IP/RR 22.0% |
38.12 |
38.08 |
2.54 |
4.91 |
-0.27 |
2.27 |
0.00 |
0.00 |
2.52 |
5.12 |
11.64 |
14.28 |
2.81 |
2.64 |
38.IP/RR 20.0% |
34.69 |
34.62 |
1.50 |
4.43 |
-1.11 |
2.03 |
0.00 |
0.00 |
1.48 |
4.64 |
10.79 |
14.04 |
2.61 |
2.40 |
39.IP/RR 18.0% |
31.17 |
31.17 |
0.42 |
4.06 |
-1.99 |
1.90 |
0.00 |
0.00 |
0.40 |
4.27 |
9.92 |
13.91 |
2.41 |
2.16 |
|
Growth Rate: 13% & Interest Rate reduction by 0.1% |
|
Debt Target |
GFD Target |
PD Target |
CD Target |
ID Target |
PE Target |
IP Target |
|
2013-14 |
2014-15 |
2013-14 |
2014-15 |
2013-14 |
2014-15 |
2013-14 |
2014-15 |
2013-14 |
2014-15 |
2013-14 |
2014-15 |
2013-14 |
2014-15 |
40.IP/RR 22.0% |
41.28 |
41.26 |
3.35 |
5.35 |
0.54 |
2.70 |
0.00 |
0.00 |
3.33 |
5.56 |
12.45 |
14.71 |
2.81 |
2.64 |
41.IP/RR 20.0% |
37.56 |
37.51 |
2.18 |
4.82 |
-0.43 |
2.42 |
0.00 |
0.00 |
2.16 |
5.03 |
11.47 |
14.43 |
2.61 |
2.40 |
42.IP/RR 18.0% |
33.74 |
33.76 |
0.97 |
4.41 |
-1.44 |
2.25 |
0.00 |
0.00 |
0.95 |
4.62 |
10.47 |
14.26 |
2.41 |
2.16 |
|
Growth Rate: 13% & Interest Rate based on forecast |
|
Debt Target |
GFD Target |
PD Target |
CD Target |
ID Target |
PE Target |
IP Target |
|
2013-
14 |
2014-15 |
2013-
14 |
2014-15 |
2013-
14 |
2014-15 |
2013-
14 |
2014-15 |
2013-
14 |
2014-15 |
2013-
14 |
2014-15 |
2013-
14 |
2014-15 |
43. IP/RR 22.0% |
39.02 |
39.00 |
2.72 |
5.04 |
-0.09 |
2.40 |
0.00 |
0.00 |
2.70 |
5.25 |
11.82 |
14.41 |
2.81 |
2.64 |
44. IP/RR 20.0% |
35.51 |
35.45 |
1.64 |
4.55 |
-0.97 |
2.15 |
0.00 |
0.00 |
1.62 |
4.76 |
10.94 |
14.16 |
2.61 |
2.40 |
45. IP/RR 18.0% |
31.89 |
31.91 |
0.53 |
4.16 |
-1.88 |
2.00 |
0.00 |
0.00 |
0.51 |
4.37 |
10.03 |
14.02 |
2.41 |
2.16 |
Table 6B: Alternative Fiscal Correction Path Under Three Different Assumptions of Growth and Interest Rate – Low Revenue Buoyancy Scenario (Concld.) |
(in percent) |
|
Growth Rate: 12% & Constant Interest Rate |
|
Debt Target |
GFD Target |
PD Target |
CD Target |
ID Target |
PE Target |
IP Target |
|
2013-
14 |
2014-15 |
2013-
14 |
2014-15 |
2013-
14 |
2014-15 |
2013-
14 |
2014-15 |
2013-
14 |
2014-15 |
2013-
14 |
2014-15 |
2013-
14 |
2014-15 |
46. IP/RR 22.0% |
37.80 |
37.74 |
2.15 |
4.47 |
-0.67 |
1.83 |
0.00 |
0.00 |
2.13 |
4.68 |
11.25 |
13.85 |
2.81 |
2.64 |
47. IP/RR 20.0% |
34.40 |
34.31 |
1.15 |
4.03 |
-1.47 |
1.63 |
0.00 |
0.00 |
1.13 |
4.24 |
10.44 |
13.64 |
2.61 |
2.41 |
48. IP/RR 18.0% |
30.91 |
30.90 |
0.11 |
3.70 |
-2.30 |
1.54 |
0.00 |
0.00 |
0.09 |
3.91 |
9.61 |
13.55 |
2.41 |
2.16 |
|
Growth Rate: 12% & Interest Rate reduction by 0.1% |
|
Debt Target |
GFD Target |
PD Target |
CD Target |
ID Target |
PE Target |
IP Target |
|
2013-
14 |
2014-15 |
2013-
14 |
2014-15 |
2013-
14 |
2014-15 |
2013-
14 |
2014-15 |
2013-
14 |
2014-15 |
2013-
14 |
2014-15 |
2013-
14 |
2014-15 |
49. IP/RR 22.0% |
40.93 |
40.90 |
2.92 |
4.87 |
0.11 |
2.23 |
0.00 |
0.00 |
2.90 |
5.08 |
12.02 |
14.24 |
2.81 |
2.64 |
50. IP/RR 20.0% |
37.25 |
37.18 |
1.79 |
4.39 |
-0.82 |
1.98 |
0.00 |
0.00 |
1.77 |
4.60 |
11.09 |
14.00 |
2.61 |
2.41 |
51. IP/RR 18.0% |
33.45 |
33.46 |
0.63 |
4.02 |
-1.78 |
1.86 |
0.00 |
0.00 |
0.61 |
4.23 |
10.13 |
13.88 |
2.41 |
2.16 |
|
Growth Rate: 12% & Interest Rate based on forecast |
|
Debt Target |
GFD Target |
PD Target |
CD Target |
ID Target |
PE Target |
IP Target |
|
2013-
14 |
2014-15 |
2013-
14 |
2014-15 |
2013-
14 |
2014-15 |
2013-
14 |
2014-15 |
2013-
14 |
2014-15 |
2013-
14 |
2014-15 |
2013-
14 |
2014-15 |
52. IP/RR 22.0% |
38.69 |
38.65 |
2.31 |
4.60 |
-0.50 |
1.95 |
0.00 |
0.00 |
2.29 |
4.81 |
11.41 |
13.97 |
2.81 |
2.64 |
53. IP/RR 20.0% |
35.21 |
35.14 |
1.28 |
4.14 |
-1.33 |
1.74 |
0.00 |
0.00 |
1.26 |
4.35 |
10.58 |
13.75 |
2.61 |
2.41 |
54. IP/RR 18.0% |
31.62 |
31.62 |
0.22 |
3.80 |
-2.20 |
1.63 |
0.00 |
0.00 |
0.20 |
4.01 |
9.72 |
13.65 |
2.41 |
2.16 |
GFD : Gross Fiscal Deficit. PD: Primary Deficit. CD: Current Deficit.
ID : Investment Deficit PE: Primary Expenditure. IP : Interest Payments.
Note: In all the scenarios the terminal year of adjustment is 2013-14. In order to gauge the fiscal comfort once the target has
been achieved, for each of the scenarios, the interest rate, revenue receipts to GDP ratio and the IP/RR in 2014-15 was
fixed at the 2013-14 (terminal year) level. |
Table 7: Required Additional Correction in Deficit Indicators under Lower Growth and Lower Revenue Buoyancy |
|
(in percent) |
|
Constant Interest Rate |
Interest Rate decline by 0.1% |
Interest Rate based on forecast |
|
High Revenue Buoyancy |
Low Revenue Buoyancy |
High Revenue Buoyancy |
Low Revenue Buoyancy |
High Revenue Buoyancy |
Low Revenue Buoyancy |
|
IP/RR 22.0% |
IP/RR 22.0% |
IP/RR 22.0% |
Deficit Indic-ators |
Lower
Gr. Rate
by 1% |
Lower
Gr. Rate
by 2% |
Lower
Gr. Rate
by 1% |
Lower
Gr. Rate
by 2% |
Lower
Gr. Rate
by 1% |
Lower
Gr. Rate
by 2% |
Lower
Gr. Rate
by 1% |
Lower
Gr. Rate
by 2% |
Lower
Gr. Rate
by 1% |
Lower
Gr. Rate
by 2% |
Lower
Gr. Rate
by 1% |
Lower
Gr. Rate
by 2% |
Debt |
1.76 |
3.49 |
4.77 |
5.09 |
-1.65 |
0.22 |
1.61 |
1.96 |
0.79 |
2.56 |
3.87 |
4.20 |
GFD |
0.83 |
1.60 |
1.88 |
2.27 |
-0.10 |
0.76 |
1.07 |
1.50 |
0.62 |
1.42 |
3.89 |
2.11 |
PD |
0.74 |
1.43 |
1.63 |
2.03 |
-0.19 |
0.59 |
0.82 |
1.25 |
0.53 |
1.25 |
1.45 |
1.86 |
ID |
0.81 |
1.59 |
1.86 |
2.26 |
-0.12 |
0.74 |
1.05 |
1.48 |
0.60 |
1.40 |
1.68 |
2.09 |
|
IP/RR 20.0% |
IP/RR 20.0% |
IP/RR 20.0% |
|
Lower
Gr. Rate
by 1% |
Lower
Gr. Rate
by 2% |
Lower
Gr. Rate
by 1% |
Lower
Gr. Rate
by 2% |
Lower
Gr. Rate
by 1% |
Lower
Gr. Rate
by 2% |
Lower
Gr. Rate
by 1% |
Lower
Gr. Rate
by 2% |
Lower
Gr. Rate
by 1% |
Lower
Gr. Rate
by 2% |
Lower
Gr. Rate
by 1% |
Lower
Gr. Rate
by 2% |
Debt |
1.60 |
3.18 |
4.34 |
4.63 |
-1.50 |
0.20 |
1.47 |
1.78 |
0.72 |
2.33 |
3.52 |
3.82 |
GFD |
0.71 |
1.39 |
1.62 |
1.97 |
-0.07 |
0.68 |
0.94 |
1.33 |
0.54 |
1.24 |
1.48 |
1.84 |
PD |
0.64 |
1.23 |
1.39 |
1.75 |
-0.15 |
0.52 |
0.71 |
1.10 |
0.47 |
1.08 |
1.25 |
1.61 |
ID |
0.70 |
1.37 |
1.60 |
1.96 |
-0.09 |
0.66 |
0.92 |
1.31 |
0.52 |
1.22 |
1.46 |
1.82 |
|
IP/RR 18.0% |
IP/RR 18.0% |
IP/RR 18.0% |
|
Lower
Gr. Rate
by 1% |
Lower
Gr. Rate
by 2% |
Lower
Gr. Rate
by 1% |
Lower
Gr. Rate
by 2% |
Lower
Gr. Rate
by 1% |
Lower
Gr. Rate
by 2% |
Lower
Gr. Rate
by 1% |
Lower
Gr. Rate
by 2% |
Lower
Gr. Rate
by 1% |
Lower
Gr. Rate
by 2% |
Lower
Gr. Rate
by 1% |
Lower
Gr. Rate
by 2% |
Debt |
1.44 |
2.85 |
3.90 |
4.16 |
-1.33 |
0.20 |
1.33 |
1.62 |
0.66 |
2.11 |
3.18 |
3.45 |
GFD |
0.61 |
1.18 |
1.38 |
1.69 |
-0.03 |
0.61 |
0.83 |
1.17 |
0.48 |
1.07 |
1.27 |
1.58 |
PD |
0.54 |
1.03 |
1.16 |
1.47 |
-0.11 |
0.46 |
0.61 |
0.95 |
0.40 |
0.92 |
1.05 |
1.37 |
ID |
0.60 |
1.16 |
1.36 |
1.67 |
-0.04 |
0.59 |
0.81 |
1.15 |
0.46 |
1.05 |
1.25 |
1.57 |
Gr.: Growth. GFD: Gross Fiscal Deficit. PD: Primary Deficit. ID: Investment Deficit. |
If the growth deceleration is combined with lower revenue buoyancy (i.e., revenue receipts growth is only one percentage point above nominal GDP growth), the tolerable level of debt and deficit goes down substantially. Consequently, the additional reduction in debt to GDP ratio due to lower revenue buoyancy would range from 3.9 to 4.77 percentage points for one percent deceleration in growth and from 4.2 to 5.1 percentage points with two percentage points deceleration in growth. The corresponding additional reduction in GFD/GDP, primary deficit and investment expenditure would be by about 1.4 times for one percent deceleration in growth and 2.3 times for two percent deceleration in growth.
Interestingly, however, if the high revenue buoyancy is sustained and interest rate also declines by 0.1 percentage point each year, the Government despite the growth deceleration by one percent would be able to achieve the same IP/RR targets at a higher debt/GDP ratio (higher by 1.3 to 1.7 percentage points). Consequently, other deficit indicators could also be higher. But if the growth decelerates by two percent, despite the decline in interest rate each year by 0.1 percentage points, the Government would be required to reduce the level of debt and deficit to GDP ratio to achieve the same level of IP/RR targets. Obviously, if the revenue buoyancy also declines along with the decline in growth rate, the required reduction in debt and deficits would be much larger even under this declining interest rate scenario.
Should the interest rate behave as per the projection and decline slowly during the forecast period, decline in growth and revenue buoyancy would necessitate a lower debt and deficit to achieve the targeted levels of IP/RR. Under high revenue buoyancy, one percentage point reduction in growth rate would mean 2/3rd to 4/5th of a percentage point reduction in debt/GDP ratio, while for two percentage points reduction in growth rate, debt/GDP ratio would have to be reduced by more than 2.0 percentage points. With lower revenue buoyancy, one percent decline in growth would require about 3-4 percentage points reduction in debt/GDP ratio, which would increase to about 3.5 to 4.2 percentage points with decline in growth rate by two percentage points. The required reduction in deficit indicators would correspondingly increase for lower growth and lower revenue buoyancy.
It is thus clearly evident that the tolerable level of deficit and debt for any targeted reduction in interest payment to revenue receipts ratio, among others, would crucially hinge upon the average growth of GDP during the forecast period. The alternative reduction path generated in the exercise is based on the assumption that the average GDP growth is maintained in each of the year during the projection period. However, it is likely that there would be year to year to fluctuation or the average GDP growth is over the period of a business cycle. To allow for this fluctuation in the GDP growth, the correction in each year may be allowed to vary depending upon the emerging GDP growth scenario in that year. If the actual GDP growth exceeds the average, a larger correction in IP/ RR can be made, while in the case of lower than average growth the correction may be relaxed to the desired extent. However, barring the case of extraordinary circumstances, it needs to be ensured that the targeted reduction in IP/RR is achieved over the considered or targeted time frame. For prolonged cycles of higher or lower growth in GDP than the expected average, there is, thus, some flexibility to incorporate countercyclical fiscal policy stance into the fiscal architecture in the post FRBM period.
SECTION V
CONCLUDING REMARKS
In designing a meaningful framework on fiscal consolidation during the post-FRBM period, there is the need for reconciling discrepancies between the movement in fiscal deficit and debt, which is presently not the case in India. The paper makes an attempt at this reconciliation by including the off-budget liabilities and MSS explicitly as above the line items and excluding the NSSF utilised by the States from the outstanding liabilities of the Central Government. Although this adjustment largely reconciles the discrepancies, it has not been possible to completely remove them given the state of fiscal statistics in the public domain in the country. The paper also emphasises that the chosen target variable should be the burden of interest payments on revenue receipts, as the Government would be in much better position to decide on how much of the current revenues it can afford for paying interest on its borrowing in the coming years while it would be difficult to define a sustainable debt/GDP ratio in terms of a precise number. Another advantage of using the interest payments to revenue receipt (IP/RR) ratio as the target variable is that it could also be used at State level unlike the debt/GSDP ratio because IP/RR avoids all measurement and comparability issues that surround the debt/GSDP ratio (Dholakia, 2003). Moreover, the use of IP/RR can facilitate the same logic of considering the comfort level of governments to create appropriate fiscal architecture at the State level too with enough flexibility to account for differing socio-economic and fiscal conditions among States.
Once the targeted level of this chosen variable has been decided, the paper provides a framework to derive the tolerable level of deficit and debt from the emerging growth and interest rate scenario. Given this tolerable level of deficit, the components of expenditure can be calibrated by making adjustments in the discretionary component. However, in view of the significant proportion of the presently defined revenue expenditure in the budget being investment in nature while defense capital outlay being primarily consumption in nature, expenditure should be reclassified into the current and investment expenditures, as followed in the Economic and Functional Classification of the budget to make them consistent with national income accounting. The Government could then at the least target a zero current deficit by 2013-14 so that the entire net borrowing goes to meet the investment expenditure, the so-called “Golden Rule”.
From the framework provided in this paper, a menu of choice is obtained depending on the targeted reduction in interest payments to revenue receipts ratio under alternative assumptions of growth, interest rates and revenue buoyancy. In the most favorable environment of 14.0 percent nominal growth of GDP, continuance of high revenue buoyancy, softening of the interest rate by 0.1 percentage points each year and the lenient target for IP/RR of 22.0 percent by 2013-14, the projection shows that the Government would be able to run a deficit of close to 5.5 percent of GDP by 2013-14 and over 6.5 in the following year even when revenue receipts to GDP stops increasing and interest rate stops declining from the level of 2013-14. By bringing down the current deficit to zero, the entire borrowing can be deployed for investment purposes, which would be higher than the base year level of 2007-08. A stiffer targeted reduction in IP/RR, however, would reduce the tolerable level of deficit and debt significantly.
On the other hand, under the most pessimistic scenario of decline in nominal growth to 12.0 percent, lower revenue buoyancy and constant interest rate, even with the lenient target for IP/RR of 22.0 percent, the tolerable level of GFD would only be a little over 2.0 per cent of GDP, which would severely restrict the capacity of the Government to make investment expenditure. An IP/RR target of 18.0 percent appears to be highly infeasible under such a pessimistic scenario, as the Government may be required to bring down the fiscal deficit to almost zero by the targeted year, and therefore, investment expenditure to a negligible level.
There are, however, a number of possibilities which lay in between these two extreme scenarios. The view here is that the nominal growth of GDP may be sustained at 14.0 per cent. The interest rate may decline somewhat by an average of 0.03 to 0.04 percentage point each year, as indicated by the forecast in the next 4-5 years ahead. This leads us to the likely scenario to be one of the scenarios 7 to 9 in the exercise depending upon the targeted IP/RR if it is to be believed that the revenue buoyancy would continue to be high as in the past. However, the likely scenario would be one of the scenarios 34 to 36 in the exercise if it is to be believed that the revenue buoyancy would decline but remain one percentage point above the GDP growth. The revenue buoyancy may be considered as a genuinely uncertain variable. When compared, the scenarios 8 and 9 corresponding to IP/RR target of 20 per cent and 18 per cent respectively with high revenue buoyancy are very similar to the scenarios 34 and 35 corresponding to IP/ RR target of 22 per cent and 20 per cent, respectively, with lower revenue buoyoncy. The IP/RR target of 18.0 per cent appears to be unreasonably stiff particularly if the revenue buoyancy declines, as it would require restricting GFD/GDP ratio to less than 0.5 per cent and Debt/GDP ratio to 31 per cent by 2013-14, and consequently, investment expenditure to a significantly lower level than base year despite zero current account deficits. To fix such a stiff IP/RR target may not be advisable. Therefore, a reasonable IP/RR target appears to be 20.0 per cent by 2013-14 and be maintained at that level in the future. If revenue buoyancy continues to be high, the tolerable level of debt would be about 40.0 per cent of GDP and the GFD slightly above 3.0 per cent of GDP by the year 2013-14. If, however, the revenue buoyancy declines, the tolerable Debt/GDP ratio would be around 35 per cent and GFD would be around 1.5 per cent of GDP by the year 2013-14. Once the IP/ RR target has been achieved, a GFD of over 5.5 per cent of GDP in the first case and about 4.5 per cent in the second case would be affordable without jeopardising the debt to GDP ratio even when interest rate and revenue receipts to GDP remain constant. In the post 2009 FRBM period, the medium term fiscal architect implied by the target of 20 per cent IP/RR appears to be challenging but achievable under normal expectations about future. Moreover, the fiscal architecture based on the framework suggested here provides the flexibility of incorporating the countercyclical fiscal policy stance if required in future to tackle the slow down in the growth of the economy like in the present.
References
Comptroller and Auditor General of India: Report on the Accounts of the Union Government, various issues.
Dholakia, Ravindra H. (2003): Measurement Issues in Comparing Fiscal Performance of States”, Economic and Political Weekly, March 8-14, pp. 991-995.
Dholakia, Ravindra H., Ram Mohan T.T, and Navendu Karan (2004): Fiscal Sustainability of Debt of States, Report Submitted to the Twelfth Finance Commission, Indian Institute of Management, Ahmedabad.
Dholakia Ravindra H. and Navendu Karan (2005): “Consistent Measurement of Fiscal Deficit and Debt of States in India”, Economic and Political Weekly, June 18, pp-2577-2586.
Government of India: Budget Documents of Government of India, various issues.
Government of India: An Economic and Functional Classification of the Central Government Budget, Ministry of Finance, New Delhi, various issues.
Government of India: Finance Accounts of the Union Government, Comptroller General of Accounts, Government of India, various issues.
Misra, B.M. and J. K. Khundrakpam (2008) “Fiscal Consolidation by Central and State Governments: The Medium-Term Outlook”, Paper presented at Seminar on “Issues Before the Thirteenth Finance Commission” organized by the National Institute of Public Finance and Policy at New Delhi on May 24.
Ram Mohan T.T., Ravindra H. Dholakia, and Navendu Karan (2005): “Is India’s Central Debt Sustainable? Revisiting an Old Debate”, Economic and Political Weekly, March 5, pp. 951-959.
Rangarajan, C. and D. K. Srivastava (2003): ‘Dynamics of Debt Accumulation in India: Impact of Primary Deficit, Growth and Interest Rate’, Economic and Political Weekly, November 15, pp. 4851-4858.
Rangarajan, C. and D. K. Srivastava (2005): “Fiscal Deficit and Government Debt”, Economic and Political Weekly, July 2, pp-2919-2933.
Rao M. Govinda and Pratap R. Jena (2008), “Fiscal Consolidation by Central and States Governments”, Paper presented at Seminar on “Issues Before the Thirteenth Finance Commission” organized by the National Institute of Public Finance and Policy at New Delhi on May 24.
RBI (2007): Handbook of Statistics on the Indian Economy 2006-07, RBI, Mumbai.
Reserve Bank of India (2005): Report of the Working Group on Compilation of State Government Liabilities, Mumbai.
Twelfth Finance Commission (2004): Report of the Twelfth Finance Commission, November.
Appendix
Scenario 1- Constant Interest rate, IP/RR reduction by 2.27%, Nominal GDP growth of 14%-High Revenue Buoyancy Scenario |
Year |
Int. Rate |
IP/ RR |
RR/ GDP |
IP/ GDP |
Debt/ GDP |
GDP Rs.Tri.) |
Debt (Rs.Tri) |
Dt-D(t-l) |
GFD/ GDP |
TE /GDP |
PD |
PE |
CD/ GDP |
ID /GDP |
PRB/ GDP |
1 |
2 |
3 |
4 |
5 =
3*4 |
6=
5/2 |
7 |
8=
(5*7)/2 |
9 |
10=
9/7 |
11 =
4+10 |
12=
10-5 |
13=
11-5 |
14 |
15 =
10-14 |
16=
14-5 |
2007-08 |
8.24 |
32.8 |
11.2 |
3.68 |
51.97 |
47 |
24.37 |
3.42 |
7.40 |
18.62 |
3.72 |
14.94 |
1.40 |
6.00 |
-2.28 |
2008-09 |
7.83 |
31.6 |
11.4 |
3.60 |
49.64 |
53 |
26.33 |
1.96 |
3.69 |
15.08 |
0.09 |
11.48 |
1.17 |
2.52 |
-2.43 |
2009-10 |
7.83 |
29.3 |
11.6 |
3.41 |
46.86 |
60 |
28.33 |
2.00 |
3.78 |
15.41 |
0.37 |
12.00 |
0.94 |
2.84 |
-2.47 |
2010-11 |
7.83 |
27.1 |
11.9 |
3.22 |
44.05 |
69 |
30.36 |
2.03 |
3.35 |
15.25 |
0.13 |
12.03 |
0.71 |
2.64 |
-2.51 |
2011-12 |
7.83 |
24.8 |
12.2 |
3.03 |
41.17 |
79 |
32.34 |
1.99 |
2.88 |
15.09 |
-0.14 |
12.06 |
0.48 |
2.40 |
-2.55 |
2012-13 |
7.83 |
22.5 |
12.6 |
2.83 |
38.19 |
90 |
34.20 |
1.86 |
2.37 |
14.92 |
-0.46 |
12.09 |
0.25 |
2.12 |
-2.58 |
2013-14 |
7.83 |
20.3 |
13.0 |
2.62 |
35.07 |
102 |
35.81 |
1.61 |
1.80 |
14.75 |
-0.83 |
12.12 |
0.00 |
1.80 |
-2.62 |
2014-15 |
7.83 |
18.0 |
13.4 |
2.41 |
35.11 |
116 |
40.87 |
5.06 |
4.95 |
18.35 |
2.55 |
15.94 |
0.00 |
4.95 |
-2.41 |
Scenario 2- Constant Interest rate, IP/RR reduction by 1.93%, Nominal GDP growth of 14% |
Year |
Int. Rate |
IP/ RR |
RR/ GDP |
IP/ GDP |
Debt/ GDP |
GDP
(Rs.Tri. |
Debt (Rs. Tri) |
Dt-D(t-l) |
GFD/ GDP |
TE/ GDP |
PD |
PE |
CD/ GDP |
ID/ GDP |
PRB/ GDP |
1 |
2 |
3 |
4 |
5 =
3*4 |
6=
5/2 |
7 |
8=
(5*7)/2 |
9 |
10=
9/7 |
11 =
4+10 |
12=
10-5 |
13=
11-5 |
14 |
15 =
10-14 |
16=
14-5 |
2007-08 |
8.24 |
32.8 |
11.2 |
3.68 |
51.97 |
47 |
24.37 |
3.42 |
7.40 |
18.62 |
3.72 |
14.94 |
1.40 |
6.00 |
-2.28 |
2008-09 |
7.83 |
31.6 |
11.4 |
3.60 |
50.19 |
53 |
26.62 |
2.25 |
4.24 |
15.63 |
0.64 |
12.03 |
1.17 |
3.07 |
-2.43 |
2009-10 |
7.83 |
29.7 |
11.6 |
3.45 |
48.02 |
60 |
29.03 |
2.41 |
4.55 |
16.17 |
1.10 |
12.72 |
0.94 |
3.61 |
-2.51 |
2010-11 |
7.83 |
27.7 |
11.9 |
3.30 |
45.84 |
69 |
31.59 |
2.56 |
4.24 |
16.13 |
0.94 |
12.83 |
0.71 |
3.53 |
-2.59 |
2011-12 |
7.83 |
25.8 |
12.2 |
3.15 |
43.63 |
79 |
34.28 |
2.69 |
3.90 |
16.11 |
0.75 |
12.96 |
0.48 |
3.42 |
-2.67 |
2012-13 |
7.83 |
23.9 |
12.6 |
3.00 |
41.37 |
90 |
37.05 |
2.78 |
3.53 |
16.09 |
0.53 |
13.09 |
0.25 |
3.28 |
-2.75 |
2013-14 |
7.83 |
22.0 |
13.0 |
2.84 |
39.03 |
102 |
39.85 |
2.80 |
3.12 |
16.08 |
0.28 |
13.23 |
0.00 |
3.12 |
-2.84 |
2014-15 |
7.83 |
20.0 |
13.4 |
2.68 |
38.99 |
116 |
45.39 |
5.53 |
5.42 |
18.82 |
2.74 |
16.14 |
0.00 |
5.42 |
-2.68 |
Scenario 3- Constant Interest rate, IP/RR reduction by 1.60%, Nominal GDP growth of 14% |
Year |
Int. Rate |
IP/ RR |
RR/ GDP |
IP/ GDP |
Debt/ GDP |
GDP
(Rs.Tri.) |
Debt (Rs.Tri) |
Dt-D(t-l) |
GFD/ GDP |
TE/ GDP |
PD |
PE |
CD/ GDP |
ID/ GDP |
PRB/ GDP |
1 |
2 |
3 |
4 |
5 =
3*4 |
6=
5/2 |
7 |
8=
(5*7)/2 |
9 |
10=
9/7 |
11 =
4+10 |
12=
10-5 |
13=
11-5 |
14 |
15 =
10-14 |
16=
14-5 |
2007-08 |
8.24 |
32.8 |
11.2 |
3.68 |
51.97 |
47 |
24.37 |
3.42 |
7.40 |
18.62 |
3.72 |
14.94 |
1.40 |
6.00 |
-2.28 |
2008-09 |
7.83 |
31.6 |
11.4 |
3.60 |
50.75 |
53 |
26.91 |
2.54 |
4.79 |
16.19 |
1.19 |
12.59 |
1.17 |
3.62 |
-2.43 |
2009-10 |
7.83 |
30.0 |
11.6 |
3.49 |
49.16 |
60 |
29.72 |
2.80 |
5.29 |
16.91 |
1.80 |
13.43 |
0.94 |
4.35 |
-2.55 |
2010-11 |
7.83 |
28.4 |
11.9 |
3.38 |
47.60 |
69 |
32.80 |
3.08 |
5.10 |
16.99 |
1.72 |
13.62 |
0.71 |
4.39 |
-2.67 |
2011-12 |
7.83 |
26.8 |
12.2 |
3.27 |
46.04 |
79 |
36.17 |
3.37 |
4.89 |
17.10 |
1.62 |
13.83 |
0.48 |
4.41 |
-2.79 |
2012-13 |
7.83 |
25.2 |
12.6 |
3.16 |
44.48 |
90 |
39.84 |
3.67 |
4.67 |
17.22 |
1.50 |
14.06 |
0.25 |
4.42 |
-2.91 |
2013-14 |
7.83 |
23.6 |
13.0 |
3.06 |
42.89 |
102 |
43.79 |
3.95 |
4.42 |
17.37 |
1.36 |
14.31 |
0.00 |
4.42 |
-3.06 |
2014-15 |
7.83 |
22.0 |
13.4 |
2.95 |
42.89 |
116 |
49.93 |
6.13 |
6.00 |
19.40 |
3.06 |
16.45 |
0.00 |
6.00 |
-2.95 |
Scenario 4- Interest rate reduction by 0.1 %, IP/RR reduction by 2.27%, Nominal GDP growth of 14% |
Year |
Int. Rate |
IP/ RR |
RR/ GDP |
IP/ GDP |
Debt/ GDP |
GDP
(Rs. Tri.) |
Debt (Rs.Tri) |
Dt-D(t-l) |
GFD/ GDP |
TE/ GDP |
PD |
PE |
CD/ GDP |
ID/ GDP |
PRB/ GDP |
1 |
2 |
3 |
4 |
5 =
3*4 |
6=
5/2 |
7 |
8=
(5*7)/2 |
9 |
10=
9/7 |
11 =
4+10 |
12=
10-5 |
13=
11-5 |
14 |
15 =
10-14 |
16=
14-5 |
2007-08 |
8.24 |
32.8 |
11.2 |
3.68 |
51.97 |
47 |
24.37 |
3.42 |
7.40 |
18.62 |
3.72 |
14.94 |
1.40 |
6.00 |
-2.28 |
2008-09 |
7.83 |
31.6 |
11.4 |
3.60 |
50.26 |
53 |
26.65 |
2.28 |
4.30 |
15.70 |
0.70 |
12.10 |
1.17 |
3.13 |
-2.43 |
2009-10 |
7.73 |
29.3 |
11.6 |
3.41 |
48.07 |
60 |
29.06 |
2.41 |
4.54 |
16.16 |
1.13 |
12.75 |
0.94 |
3.60 |
-2.47 |
2010-11 |
7.63 |
27.1 |
11.9 |
3.22 |
45.78 |
69 |
31.55 |
2.49 |
4.12 |
16.02 |
0.90 |
12.80 |
0.71 |
3.41 |
-2.51 |
2011-12 |
7.53 |
24.8 |
12.2 |
3.03 |
43.36 |
79 |
34.07 |
2.52 |
3.65 |
15.86 |
0.63 |
12.83 |
0.48 |
3.17 |
-2.55 |
2012-13 |
7.43 |
22.5 |
12.6 |
2.83 |
40.77 |
90 |
36.52 |
2.45 |
3.12 |
15.67 |
0.29 |
12.85 |
0.25 |
2.87 |
-2.58 |
2013-14 |
7.33 |
20.3 |
13.0 |
2.62 |
37.96 |
102 |
38.76 |
2.25 |
2.51 |
15.46 |
-0.12 |
12.84 |
0.00 |
2.51 |
-2.62 |
2014-15 |
7.23 |
18.0 |
13.4 |
2.41 |
38.01 |
116 |
44.24 |
5.48 |
5.37 |
18.77 |
2.96 |
16.36 |
0.00 |
5.37 |
-2.41 |
Scenario 5- Interest rate reduction by 0.1% , IP/RR reduction by 1.93%, Nominal GDP growth of 14% |
Year |
Int. Rate |
IP/ RR |
RR/ GDP |
IP/ GDP |
Debt/ GDP |
GDP
(Rs.Tri.) |
Debt (Rs.Tri) |
Dt-D(t-l) |
GFD/ GDP |
TE/ GDP |
PD |
PE |
CD/ GDP |
ID/ GDP |
PRB/ GDP |
1 |
2 |
3 |
4 |
5 =
3*4 |
6=
5/2 |
7 |
8=
(5*7)/2 |
9 |
10=
9/7 |
11 =
4+10 |
12=
10-5 |
13=
11-5 |
14 |
15 =
10-14 |
16=
14-5 |
2007-08 |
8.24 |
32.8 |
11.2 |
3.68 |
51.97 |
47 |
24.37 |
3.42 |
7.40 |
18.62 |
3.72 |
14.94 |
1.40 |
6.00 |
-2.28 |
2008-09 |
7.83 |
31.6 |
11.4 |
3.60 |
50.84 |
53 |
26.96 |
2.59 |
4.89 |
16.28 |
1.29 |
12.68 |
1.17 |
3.72 |
-2.43 |
2009-10 |
7.73 |
29.7 |
11.6 |
3.45 |
49.28 |
60 |
29.79 |
2.83 |
5.33 |
16.96 |
1.88 |
13.51 |
0.94 |
4.39 |
-2.51 |
2010-11 |
7.63 |
27.7 |
11.9 |
3.30 |
47.66 |
69 |
32.85 |
3.06 |
5.06 |
16.96 |
1.76 |
13.66 |
0.71 |
4.35 |
-2.59 |
2011-12 |
7.53 |
25.8 |
12.2 |
3.15 |
45.98 |
79 |
36.12 |
3.28 |
4.75 |
16.96 |
1.60 |
13.81 |
0.48 |
4.27 |
-2.67 |
2012-13 |
7.43 |
23.9 |
12.6 |
3.00 |
44.19 |
90 |
39.58 |
3.46 |
4.40 |
16.96 |
1.40 |
13.96 |
0.25 |
4.15 |
-2.75 |
2013-14 |
7.33 |
22.0 |
13.0 |
2.84 |
42.27 |
102 |
43.16 |
3.58 |
3.99 |
16.95 |
1.15 |
14.10 |
0.00 |
3.99 |
-2.84 |
2014-15 |
7.23 |
20.0 |
13.4 |
2.68 |
42.26 |
116 |
49.19 |
6.03 |
5.90 |
19.30 |
3.22 |
16.62 |
0.00 |
5.90 |
-2.68 |
Scenario 6- Interest rate reduction by 0.1%, IP/RR reduction by 1.60%, Nominal GDP growth of 14% |
Year |
Int. Rate |
IP/ RR |
RR/ GDP |
IP/ GDP |
Debt/ GDP |
GDP
(Rs.Tri.) |
Debt (Rs.Tri) |
Dt-D(t-l) |
GFD/ GDP |
TE/ GDP |
PD |
PE |
CD/ GDP |
ID/ GDP |
PRB/ GDP |
1 |
2 |
3 |
4 |
5 =
3*4 |
6=
5/2 |
7 |
8=
(5*7)/2 |
9 |
10=
9/7 |
11 =
4+10 |
12=
10-5 |
13=
11-5 |
14 |
15 =
10-14 |
16=
14-5 |
2007-08 |
8.24 |
32.8 |
11.2 |
3.68 |
51.97 |
47 |
24.37 |
3.42 |
7.40 |
18.62 |
3.72 |
14.94 |
1.40 |
6.00 |
-2.28 |
2008-09 |
7.83 |
31.6 |
11.4 |
3.60 |
51.41 |
53 |
27.26 |
2.89 |
5.45 |
16.84 |
1.85 |
13.24 |
1.17 |
4.28 |
-2.43 |
2009-10 |
7.73 |
30.0 |
11.6 |
3.49 |
50.45 |
60 |
30.50 |
3.24 |
6.10 |
17.73 |
2.61 |
14.24 |
0.94 |
5.16 |
-2.55 |
2010-11 |
7.63 |
28.4 |
11.9 |
3.38 |
49.49 |
69 |
34.11 |
3.61 |
5.97 |
17.87 |
2.59 |
14.49 |
0.71 |
5.26 |
-2.67 |
2011-12 |
7.53 |
26.8 |
12.2 |
3.27 |
48.52 |
79 |
38.12 |
4.01 |
5.82 |
18.03 |
2.55 |
14.76 |
0.48 |
5.34 |
-2.79 |
2012-13 |
7.43 |
25.2 |
12.6 |
3.16 |
47.51 |
90 |
42.56 |
4.44 |
5.65 |
18.20 |
2.48 |
15.04 |
0.25 |
5.40 |
-2.91 |
2013-14 |
7.33 |
23.6 |
13.0 |
3.06 |
46.45 |
102 |
47.43 |
4.87 |
5.44 |
18.39 |
2.38 |
15.33 |
0.00 |
5.44 |
-3.06 |
2014-15 |
7.23 |
22.0 |
13.4 |
2.95 |
46.48 |
116 |
54.11 |
6.68 |
6.54 |
19.94 |
3.59 |
16.99 |
0.00 |
6.54 |
-2.95 |
Scenario 7- Interest rate based on forecast, IP/RR reduction by 2.27%, Nominal GDP growth of 14% |
Year |
Int. Rate |
IP/ RR |
RR/ GDP |
IP/ GDP |
Debt/ GDP |
GDP
(Rs.Tri.) |
Debt (Rs.Tri) |
Dt-D(t-l) |
GFD/ GDP |
TE/ GDP |
PD |
PE |
CD/ GDP |
ID/ GDP |
PRB/ GDP |
1 |
2 |
3 |
4 |
5 =
3*4 |
6=
5/2 |
7 |
8=
(5*7)/2 |
9 |
10=
9/7 |
11 =
4+10 |
12=
10-5 |
13=
11-5 |
14 |
15 =
10-14 |
16=
14-5 |
2007-08 |
8.24 |
32.8 |
11.2 |
3.68 |
51.97 |
47 |
24.37 |
3.42 |
7.40 |
18.62 |
3.72 |
14.94 |
1.40 |
6.00 |
-2.28 |
2008-09 |
7.83 |
31.6 |
11.4 |
3.60 |
49.73 |
53 |
26.37 |
2.00 |
3.77 |
15.17 |
0.17 |
11.57 |
1.17 |
2.60 |
-2.43 |
2009-10 |
7.82 |
29.3 |
11.6 |
3.41 |
46.95 |
60 |
28.38 |
2.01 |
3.79 |
15.42 |
0.38 |
12.01 |
0.94 |
2.85 |
-2.47 |
2010-11 |
7.81 |
27.1 |
11.9 |
3.22 |
44.63 |
69 |
30.76 |
2.37 |
3.92 |
15.82 |
0.71 |
12.60 |
0.71 |
3.21 |
-2.51 |
2011-12 |
7.73 |
24.8 |
12.2 |
3.02 |
41.92 |
79 |
32.93 |
2.18 |
3.16 |
15.37 |
0.14 |
12.34 |
0.48 |
2.68 |
-2.54 |
2012-13 |
7.69 |
22.5 |
12.6 |
2.83 |
38.93 |
90 |
34.87 |
1.94 |
2.46 |
15.02 |
-0.36 |
12.19 |
0.25 |
2.21 |
-2.58 |
2013-14 |
7.67 |
20.2 |
13.0 |
2.62 |
35.85 |
102 |
36.60 |
1.73 |
1.93 |
14.89 |
-0.69 |
12.27 |
0.00 |
1.93 |
-2.62 |
2014-15 |
7.65 |
18.0 |
13.4 |
2.41 |
35.94 |
116 |
41.84 |
5.24 |
5.13 |
18.53 |
2.72 |
16.12 |
0.00 |
5.13 |
-2.41 |
Scenario 8- Interest rate based on forecast, IP/RR reduction by 1.93%, Nominal GDP growth of 14% |
Year |
Int. Rate |
IP/ RR |
RR/ GDP |
IP/ GDP |
Debt/ GDP |
GDP
(Rs.Tri.) |
Debt (Rs.Tri) |
Dt-D(t-l) |
GFD/ GDP |
TE/ GDP |
PD |
PE |
CD/ GDP |
ID/ GDP |
PRB/ GDP |
1 |
2 |
3 |
4 |
5 =
3*4 |
6=
5/2 |
7 |
8=
(5*7)/2 |
9 |
10=
9/7 |
11 =
4+10 |
12=
10-5 |
13=
11-5 |
14 |
15 =
10-14 |
16=
14-5 |
2007-08 |
8.24 |
32.8 |
11.2 |
3.68 |
51.97 |
47 |
24.37 |
3.42 |
7.40 |
18.62 |
3.72 |
14.94 |
1.40 |
6.00 |
-2.28 |
2008-09 |
7.83 |
31.6 |
11.4 |
3.60 |
50.31 |
53 |
26.68 |
2.31 |
4.36 |
15.75 |
0.76 |
12.15 |
1.17 |
3.19 |
-2.43 |
2009-10 |
7.82 |
29.7 |
11.6 |
3.45 |
48.14 |
60 |
29.10 |
2.42 |
4.57 |
16.19 |
1.12 |
12.74 |
0.94 |
3.63 |
-2.51 |
2010-11 |
7.81 |
27.7 |
11.9 |
3.30 |
46.48 |
69 |
32.03 |
2.93 |
4.85 |
16.74 |
1.55 |
13.44 |
0.71 |
4.14 |
-2.59 |
2011-12 |
7.73 |
25.8 |
12.2 |
3.15 |
44.47 |
79 |
34.94 |
2.91 |
4.22 |
16.43 |
1.07 |
13.28 |
0.48 |
3.74 |
-2.67 |
2012-13 |
7.69 |
23.9 |
12.6 |
3.00 |
42.23 |
90 |
37.82 |
2.88 |
3.67 |
16.23 |
0.67 |
13.23 |
0.25 |
3.42 |
-2.75 |
2013-14 |
7.67 |
22.0 |
13.0 |
2.84 |
39.95 |
102 |
40.80 |
2.97 |
3.32 |
16.27 |
0.47 |
13.43 |
0.00 |
3.32 |
-2.84 |
2014-15 |
7.65 |
20.0 |
13.4 |
2.68 |
39.94 |
116 |
46.49 |
5.69 |
5.57 |
18.97 |
2.89 |
16.29 |
0.00 |
5.57 |
-2.68 |
Scenario 9- Interest rate based on forecast, IP/RR reduction by 1.60%, Nominal GDP growth of 14% |
Year |
Int. Rate |
IP/ RR |
RR/ GDP |
IP/ GDP |
Debt/ GDP |
GDP
(Rs.Tri.) |
Debt (Rs.Tri) |
Dt-D(t-l) |
GFD/ GDP |
TE/ GDP |
PD |
PE |
CD/ GDP |
ID/ GDP |
PRB/ GDP |
1 |
2 |
3 |
4 |
5 =
3*4 |
6=
5/2 |
7 |
8=
(5*7)/2 |
9 |
10=
9/7 |
11 =
4+10 |
12=
10-5 |
13=
11-5 |
14 |
15 =
10-14 |
16=
14-5 |
2007-08 |
8.24 |
32.8 |
11.2 |
3.68 |
51.97 |
47 |
24.37 |
3.42 |
7.40 |
18.62 |
3.72 |
14.94 |
1.40 |
6.00 |
-2.28 |
2008-09 |
7.83 |
31.6 |
11.4 |
3.60 |
50.87 |
53 |
26.98 |
2.61 |
4.92 |
16.31 |
1.31 |
12.71 |
1.17 |
3.75 |
-2.43 |
2009-10 |
7.82 |
30.0 |
11.6 |
3.49 |
49.29 |
60 |
29.80 |
2.82 |
5.31 |
16.94 |
1.82 |
13.45 |
0.94 |
4.37 |
-2.55 |
2010-11 |
7.81 |
28.4 |
11.9 |
3.38 |
48.26 |
69 |
33.26 |
3.47 |
5.73 |
17.63 |
2.35 |
14.25 |
0.71 |
5.02 |
-2.67 |
2011-12 |
7.73 |
26.8 |
12.2 |
3.27 |
46.93 |
79 |
36.87 |
3.61 |
5.24 |
17.44 |
1.97 |
14.17 |
0.48 |
4.76 |
-2.79 |
2012-13 |
7.69 |
25.2 |
12.6 |
3.16 |
45.41 |
90 |
40.67 |
3.80 |
4.83 |
17.39 |
1.67 |
14.22 |
0.25 |
4.58 |
-2.91 |
2013-14 |
7.67 |
23.6 |
13.0 |
3.06 |
43.91 |
102 |
44.83 |
4.16 |
4.65 |
17.60 |
1.59 |
14.54 |
0.00 |
4.65 |
-3.06 |
2014-15 |
7.65 |
22.0 |
13.4 |
2.95 |
43.93 |
116 |
51.14 |
6.30 |
6.17 |
19.57 |
3.23 |
16.62 |
0.00 |
6.17 |
-2.95 |
Scenario 10- Constant Interest rate, IP/RR reduction by 2.27%, Nominal GDP growth of 13% |
Year |
Int. Rate |
IP/ RR |
RR/ GDP |
IP/ GDP |
Debt/ GDP |
GDP
(Rs.Tri.) |
Debt (Rs.Tri) |
Dt-D(t-l) |
GFD/ GDP |
TE/ GDP |
PD |
PE |
CD/ GDP |
ID/ GDP |
PRB/ GDP |
1 |
2 |
3 |
4 |
5 =
3*4 |
6=
5/2 |
7 |
8=
(5*7)/2 |
9 |
10=
9/7 |
11 =
4+10 |
12=
10-5 |
13=
11-5 |
14 |
15 =
10-14 |
16=
14-5 |
2007-08 |
8.24 |
32.8 |
11.2 |
3.68 |
51.97 |
47 |
24.37 |
3.42 |
7.40 |
18.62 |
3.72 |
14.94 |
1.40 |
6.00 |
-2.28 |
2008-09 |
7.83 |
31.6 |
11.4 |
3.60 |
48.93 |
53 |
25.95 |
1.58 |
2.97 |
14.37 |
-0.63 |
10.77 |
1.17 |
1.80 |
-2.43 |
2009-10 |
7.83 |
29.3 |
11.6 |
3.39 |
45.93 |
60 |
27.53 |
1.58 |
2.97 |
14.53 |
-0.42 |
11.14 |
0.94 |
2.03 |
-2.45 |
2010-11 |
7.83 |
27.1 |
11.8 |
3.18 |
42.94 |
68 |
29.07 |
1.55 |
2.58 |
14.34 |
-0.60 |
11.16 |
0.71 |
1.87 |
-2.47 |
2011-12 |
7.83 |
24.8 |
12.0 |
2.98 |
39.91 |
77 |
30.53 |
1.46 |
2.16 |
14.16 |
-0.82 |
11.18 |
0.48 |
1.68 |
-2.50 |
2012-13 |
7.83 |
22.5 |
12.3 |
2.77 |
36.82 |
86 |
31.83 |
1.30 |
1.69 |
13.97 |
-1.07 |
11.21 |
0.25 |
1.44 |
-2.52 |
2013-14 |
7.83 |
20.3 |
12.6 |
2.55 |
33.63 |
98 |
32.86 |
1.03 |
1.19 |
13.78 |
-1.37 |
11.23 |
0.00 |
1.19 |
-2.55 |
2014-15 |
7.83 |
18.0 |
13.0 |
2.33 |
33.77 |
110 |
37.28 |
4.43 |
4.53 |
17.49 |
2.20 |
15.16 |
0.00 |
4.53 |
-2.33 |
Scenario 11- Constant Interest rate, IP/RR reduction by 1.93%, Nominal GDP growth of 13% |
Year |
Int. Rate |
IP/ RR |
RR/ GDP |
IP/ GDP |
Debt/ GDP |
GDP
(Rs.Tri.) |
Debt (Rs.Tri) |
Dt-D(t-l) |
GFD/ GDP |
TE/ GDP |
PD |
PE |
CD/ GDP |
ID/ GDP |
PRB/ GDP |
1 |
2 |
3 |
4 |
5 =
3*4 |
6=
5/2 |
7 |
8=
(5*7)/2 |
9 |
10=
9/7 |
11 =
4+10 |
12=
10-5 |
13=
11-5 |
14 |
15 =
10-14 |
16=
14-5 |
2007-08 |
8.24 |
32.8 |
11.2 |
3.68 |
51.97 |
47 |
24.37 |
3.42 |
7.40 |
18.62 |
3.72 |
14.94 |
1.40 |
6.00 |
-2.28 |
2008-09 |
7.83 |
31.6 |
11.4 |
3.60 |
49.48 |
53 |
26.24 |
1.86 |
3.52 |
14.91 |
-0.08 |
11.31 |
1.17 |
2.35 |
-2.43 |
2009-10 |
7.83 |
29.7 |
11.6 |
3.43 |
47.07 |
60 |
28.20 |
1.97 |
3.71 |
15.27 |
0.28 |
11.84 |
0.94 |
2.77 |
-2.49 |
2010-11 |
7.83 |
27.7 |
11.8 |
3.26 |
44.68 |
68 |
30.25 |
2.05 |
3.42 |
15.19 |
0.16 |
11.92 |
0.71 |
2.71 |
-2.55 |
2011-12 |
7.83 |
25.8 |
12.0 |
3.10 |
42.29 |
77 |
32.36 |
2.11 |
3.11 |
15.11 |
0.02 |
12.02 |
0.48 |
2.63 |
-2.62 |
2012-13 |
7.83 |
23.9 |
12.3 |
2.93 |
39.89 |
86 |
34.49 |
2.12 |
2.78 |
15.05 |
-0.16 |
12.12 |
0.25 |
2.53 |
-2.68 |
2013-14 |
7.83 |
22.0 |
12.6 |
2.77 |
37.43 |
98 |
36.57 |
2.08 |
2.41 |
15.00 |
-0.36 |
12.24 |
0.00 |
2.41 |
-2.77 |
2014-15 |
7.83 |
20.0 |
13.0 |
2.59 |
37.50 |
110 |
41.41 |
4.84 |
4.95 |
17.91 |
2.36 |
15.32 |
0.00 |
4.95 |
-2.59 |
Scenario 12- Constant Interest rate, IP/RR reduction by 1.60%, Nominal GDP growth of 13% |
Year |
Int. Rate |
IP/ RR |
RR/ GDP |
IP/ GDP |
Debt/ GDP |
GDP
(Rs. Tri.) |
Debt (Rs.Tri) |
Dt-D(t-l) |
GFD/ GDP |
TE/ GDP |
PD |
PE |
CD/ GDP |
ID/ GDP |
PRB/ GDP |
|
|
|
|
|
|
|
|
|
|
|
|
|
|
|
|
1 |
2 |
3 |
4 |
5 =
3*4 |
6=
5/2 |
7 |
8=
(5*7)/2 |
9 |
10=
9/7 |
11 =
4+10 |
12=
10-5 |
13=
11-5 |
14 |
15 =
10-14 |
16=
14-5 |
2007-08 |
8.24 |
32.8 |
11.2 |
3.68 |
51.97 |
47 |
24.37 |
3.42 |
7.40 |
18.62 |
3.72 |
14.94 |
1.40 |
6.00 |
-2.28 |
2008-09 |
7.83 |
31.6 |
11.4 |
3.60 |
50.03 |
53 |
26.53 |
2.16 |
4.07 |
15.46 |
0.47 |
11.86 |
1.17 |
2.90 |
-2.43 |
2009-10 |
7.83 |
30.0 |
11.6 |
3.47 |
48.18 |
60 |
28.87 |
2.35 |
4.42 |
15.98 |
0.96 |
12.52 |
0.94 |
3.48 |
-2.53 |
2010-11 |
7.83 |
28.4 |
11.8 |
3.34 |
46.39 |
68 |
31.41 |
2.54 |
4.24 |
16.00 |
0.90 |
12.66 |
0.71 |
3.53 |
-2.63 |
2011-12 |
7.83 |
26.8 |
12.0 |
3.22 |
44.63 |
77 |
34.15 |
2.74 |
4.04 |
16.04 |
0.83 |
12.83 |
0.48 |
3.56 |
-2.74 |
2012-13 |
7.83 |
25.2 |
12.3 |
3.09 |
42.88 |
86 |
37.08 |
2.93 |
3.83 |
16.10 |
0.73 |
13.01 |
0.25 |
3.58 |
-2.84 |
2013-14 |
7.83 |
23.6 |
12.6 |
2.97 |
41.13 |
98 |
40.18 |
3.10 |
3.59 |
16.19 |
0.62 |
13.21 |
0.00 |
3.59 |
-2.97 |
2014-15 |
7.83 |
22.0 |
13.0 |
2.85 |
41.25 |
110 |
45.55 |
5.36 |
5.49 |
18.45 |
2.64 |
15.60 |
0.00 |
5.49 |
-2.85 |
Scenario 13- Interest rate reduction by 0.1%, IP/RR reduction by 2.27%, Nominal GDP growth of 13% |
Year |
Int. Rate |
IP/ RR |
RR/ GDP |
IP/ GDP |
Debt/ GDP |
GDP
(Rs. Tri.) |
Debt (Rs.Tri) |
Dt-D(t-l) |
GFD/ GDP |
TE/ GDP |
PD |
PE |
CD/ GDP |
ID/ GDP |
PRB/ GDP |
1 |
2 |
3 |
4 |
5 =
3*4 |
6=
5/2 |
7 |
8=
(5*7)/2 |
9 |
10=
9/7 |
11 =
4+10 |
12=
10-5 |
13=
11-5 |
14 |
15 =
10-14 |
16=
14-5 |
2007-08 |
8.24 |
32.8 |
11.2 |
3.68 |
51.97 |
47 |
24.37 |
3.42 |
7.40 |
18.62 |
3.72 |
14.94 |
1.40 |
6.00 |
-2.28 |
2008-09 |
7.83 |
31.6 |
11.4 |
3.60 |
49.54 |
53 |
26.27 |
1.90 |
3.58 |
14.98 |
-0.02 |
11.38 |
1.17 |
2.41 |
-2.43 |
2009-10 |
7.73 |
29.3 |
11.6 |
3.39 |
47.11 |
60 |
28.23 |
1.96 |
3.70 |
15.26 |
0.31 |
11.87 |
0.94 |
2.76 |
-2.45 |
2010-11 |
7.63 |
27.1 |
11.8 |
3.18 |
44.62 |
68 |
30.22 |
1.98 |
3.31 |
15.07 |
0.13 |
11.89 |
0.71 |
2.60 |
-2.47 |
2011-12 |
7.53 |
24.8 |
12.0 |
2.98 |
42.03 |
77 |
32.16 |
1.95 |
2.87 |
14.87 |
-0.10 |
11.90 |
0.48 |
2.39 |
-2.50 |
2012-13 |
7.43 |
22.5 |
12.3 |
2.77 |
39.30 |
86 |
33.98 |
1.82 |
2.38 |
14.66 |
-0.38 |
11.90 |
0.25 |
2.13 |
-2.52 |
2013-14 |
7.33 |
20.3 |
12.6 |
2.55 |
36.40 |
98 |
35.56 |
1.58 |
1.83 |
14.42 |
-0.72 |
11.87 |
0.00 |
1.83 |
-2.55 |
2014-15 |
7.23 |
18.0 |
13.0 |
2.33 |
36.57 |
110 |
40.38 |
4.81 |
4.93 |
17.89 |
2.60 |
15.56 |
0.00 |
4.93 |
-2.33 |
Scenario 14- Interest rate rate reduction by 0.1%, IP/RR reduction by 1.93%, Nominal GDP growth of 13% |
Year |
Int. Rate |
IP/ RR |
RR/ GDP |
IP/ GDP |
Debt/ GDP |
GDP
(Rs.Tri.) |
Debt
(Rs.Tri) |
Dt-D(t-l) |
GFD/ GDP |
TE/ GDP |
PD |
PE |
CD/ GDP |
ID/ GDP |
PRB/ GDP |
1 |
2 |
3 |
4 |
5 =
3*4 |
6=
5/2 |
7 |
8=
(5*7)/2 |
9 |
10=
9/7 |
11 =
4+10 |
12=
10-5 |
13=
11-5 |
14 |
15 =
10-14 |
16=
14-5 |
2007-08 |
8.24 |
32.8 |
11.2 |
3.68 |
51.97 |
47 |
24.37 |
3.42 |
7.40 |
18.62 |
3.72 |
14.94 |
1.40 |
6.00 |
-2.28 |
2008-09 |
7.83 |
31.6 |
11.4 |
3.60 |
50.11 |
53 |
26.58 |
2.20 |
4.16 |
15.55 |
0.56 |
11.95 |
1.17 |
2.99 |
-2.43 |
2009-10 |
7.73 |
29.7 |
11.6 |
3.43 |
48.30 |
60 |
28.94 |
2.37 |
4.46 |
16.02 |
1.03 |
12.59 |
0.94 |
3.52 |
-2.49 |
2010-11 |
7.63 |
27.7 |
11.8 |
3.26 |
46.46 |
68 |
31.46 |
2.52 |
4.20 |
15.96 |
0.94 |
12.70 |
0.71 |
3.49 |
-2.55 |
2011-12 |
7.53 |
25.8 |
12.0 |
3.10 |
44.57 |
77 |
34.10 |
2.64 |
3.91 |
15.91 |
0.81 |
12.81 |
0.48 |
3.43 |
-2.62 |
2012-13 |
7.43 |
23.9 |
12.3 |
2.93 |
42.60 |
86 |
36.84 |
2.73 |
3.57 |
15.85 |
0.64 |
12.92 |
0.25 |
3.32 |
-2.68 |
2013-14 |
7.33 |
22.0 |
12.6 |
2.77 |
40.53 |
98 |
39.60 |
2.76 |
3.19 |
15.79 |
0.43 |
13.03 |
0.00 |
3.19 |
-2.77 |
2014-15 |
7.23 |
20.0 |
13.0 |
2.59 |
40.64 |
110 |
44.86 |
5.27 |
5.39 |
18.35 |
2.79 |
15.75 |
0.00 |
5.39 |
-2.59 |
Scenario 15- Interest rate reduction by 0.1%, IP/RR reduction by 1.60%, Nominal GDP growth of 13% |
Year |
Int. Rate |
IP/ RR |
RR/ GDP |
IP/ GDP |
Debt/ GDP |
GDP
(Rs.Tri.) |
Debt (Rs.Tri) |
Dt-D(t-l) |
GFD/ GDP |
TE/ GDP |
PD |
PE |
CD/ GDP |
ID/ GDP |
PRB/ GDP |
1 |
2 |
3 |
4 |
5 =
3*4 |
6=
5/2 |
7 |
8=
(5*7)/2 |
9 |
10=
9/7 |
11 =
4+10 |
12=
10-5 |
13=
11-5 |
14 |
15 =
10-14 |
16=
14-5 |
2007-08 |
8.24 |
32.8 |
11.2 |
3.68 |
51.97 |
47 |
24.37 |
3.42 |
7.40 |
18.62 |
3.72 |
14.94 |
1.40 |
6.00 |
-2.28 |
2008-09 |
7.83 |
31.6 |
11.4 |
3.60 |
50.67 |
53 |
26.87 |
2.50 |
4.71 |
16.11 |
1.11 |
12.51 |
1.17 |
3.54 |
-2.43 |
2009-10 |
7.73 |
30.0 |
11.6 |
3.47 |
49.45 |
60 |
29.63 |
2.76 |
5.20 |
16.76 |
1.74 |
13.30 |
0.94 |
4.26 |
-2.53 |
2010-11 |
7.63 |
28.4 |
11.8 |
3.34 |
48.24 |
68 |
32.67 |
3.03 |
5.06 |
16.83 |
1.72 |
13.49 |
0.71 |
4.35 |
-2.63 |
2011-12 |
7.53 |
26.8 |
12.0 |
3.22 |
47.03 |
77 |
35.99 |
3.32 |
4.91 |
16.91 |
1.69 |
13.69 |
0.48 |
4.43 |
-2.74 |
2012-13 |
7.43 |
25.2 |
12.3 |
3.09 |
45.81 |
86 |
39.61 |
3.62 |
4.73 |
17.01 |
1.63 |
13.91 |
0.25 |
4.48 |
-2.84 |
2013-14 |
7.33 |
23.6 |
12.6 |
2.97 |
44.54 |
98 |
43.52 |
3.91 |
4.52 |
17.12 |
1.55 |
14.15 |
0.00 |
4.52 |
-2.97 |
2014-15 |
7.23 |
22.0 |
13.0 |
2.85 |
44.70 |
110 |
49.35 |
5.84 |
5.97 |
18.93 |
3.12 |
16.08 |
0.00 |
5.97 |
-2.85 |
Scenario 16- Interest rate based on forecast, IP/RR reduction by 2.27%, Nominal GDP growth of 13% |
Year |
Int. Rate |
IP/ RR |
RR/ GDP |
IP/ GDP |
Debt/ GDP |
GDP
(Rs.Tri.) |
Debt
(Rs.Tri) |
Dt-D(t-l) |
GFD/ GDP |
TE/ GDP |
PD |
PE |
CD/ GDP |
ID/ GDP |
PRB/ GDP |
1 |
2 |
3 |
4 |
5 =
3*4 |
6=
5/2 |
7 |
8=
(5*7)/2 |
9 |
10=
9/7 |
11 =
4+10 |
12=
10-5 |
13=
11-5 |
14 |
15 =
10-14 |
16=
14-5 |
2007-08 |
8.24 |
32.8 |
11.2 |
3.68 |
51.97 |
47 |
24.37 |
3.42 |
7.40 |
18.62 |
3.72 |
14.94 |
1.40 |
6.00 |
-2.28 |
2008-09 |
7.83 |
31.6 |
11.4 |
3.60 |
49.02 |
53 |
26.00 |
1.63 |
3.07 |
14.46 |
-0.53 |
10.86 |
1.17 |
1.90 |
-2.43 |
2009-10 |
7.82 |
29.3 |
11.6 |
3.39 |
46.03 |
60 |
27.58 |
1.58 |
2.99 |
14.55 |
-0.40 |
11.16 |
0.94 |
2.05 |
-2.45 |
2010-11 |
7.81 |
27.1 |
11.8 |
3.18 |
43.51 |
68 |
29.47 |
1.88 |
3.14 |
14.91 |
-0.04 |
11.72 |
0.71 |
2.43 |
-2.47 |
2011-12 |
7.73 |
24.8 |
12.0 |
2.98 |
40.66 |
77 |
31.11 |
1.64 |
2.43 |
14.43 |
-0.55 |
11.45 |
0.48 |
1.95 |
-2.50 |
2012-13 |
7.69 |
22.5 |
12.3 |
2.77 |
37.56 |
86 |
32.48 |
1.37 |
1.79 |
14.07 |
-0.98 |
11.30 |
0.25 |
1.54 |
-2.52 |
2013-14 |
7.67 |
20.3 |
12.6 |
2.55 |
34.41 |
98 |
33.62 |
1.14 |
1.32 |
13.92 |
-1.23 |
11.37 |
0.00 |
1.32 |
-2.55 |
2014-15 |
7.65 |
18.0 |
13.0 |
2.33 |
34.56 |
110 |
38.16 |
4.54 |
4.65 |
17.61 |
2.32 |
15.28 |
0.00 |
4.65 |
-2.33 |
Scenario 17- Interest rate based on forecast, IP/RR reduction by 1.93%, Nominal GDP growth of 13% |
Year |
Int. Rate |
IP/ RR |
RR/ GDP |
IP/ GDP |
Debt/ GDP |
GDP
(Rs.Tri.) |
Debt (Rs.Tri) |
Dt-D(t-l) |
GFD/ GDP |
TE/ GDP |
PD |
PE |
CD/ GDP |
ID/ GDP |
PRB/ GDP |
1 |
2 |
3 |
4 |
5 =
3*4 |
6=
5/2 |
7 |
8=
(5*7)/2 |
9 |
10=
9/7 |
11 =
4+10 |
12=
10-5 |
13=
11-5 |
14 |
15 =
10-14 |
16=
14-5 |
2007-08 |
8.24 |
32.8 |
11.2 |
3.68 |
51.97 |
47 |
24.37 |
3.42 |
7.40 |
18.62 |
3.72 |
14.94 |
1.40 |
6.00 |
-2.28 |
2008-09 |
7.83 |
31.6 |
11.4 |
3.60 |
49.59 |
53 |
26.30 |
1.93 |
3.63 |
15.03 |
0.03 |
11.43 |
1.17 |
2.46 |
-2.43 |
2009-10 |
7.82 |
29.7 |
11.6 |
3.43 |
47.19 |
60 |
28.28 |
1.98 |
3.73 |
15.29 |
0.30 |
11.86 |
0.94 |
2.79 |
-2.49 |
2010-11 |
7.81 |
27.7 |
11.8 |
3.26 |
45.30 |
68 |
30.68 |
2.40 |
4.01 |
15.77 |
0.75 |
12.51 |
0.71 |
3.30 |
-2.55 |
2011-12 |
7.73 |
25.8 |
12.0 |
3.10 |
43.11 |
77 |
32.99 |
2.31 |
3.41 |
15.41 |
0.31 |
12.32 |
0.48 |
2.93 |
-2.62 |
2012-13 |
7.69 |
23.9 |
12.3 |
2.93 |
40.71 |
86 |
35.20 |
2.22 |
2.90 |
15.17 |
-0.04 |
12.24 |
0.25 |
2.65 |
-2.68 |
2013-14 |
7.67 |
22.0 |
12.6 |
2.77 |
38.31 |
98 |
37.43 |
2.23 |
2.58 |
15.17 |
-0.19 |
12.41 |
0.00 |
2.58 |
-2.77 |
2014-15 |
7.65 |
20.0 |
13.0 |
2.59 |
38.41 |
110 |
42.40 |
4.97 |
5.09 |
18.05 |
2.49 |
15.45 |
0.00 |
5.09 |
-2.59 |
Scenario 18- Interest rate based on forecast, IP/RR reduction by 1.60%, Nominal GDP growth of 13% |
Year |
Int. Rate |
IP/ RR |
RR/ GDP |
IP/ GDP |
Debt/ GDP |
GDP
(Rs.Tri.) |
Debt (Rs.Tri) |
Dt-D(t-l) |
GFD/ GDP |
TE/ GDP |
PD |
PE |
CD/ GDP |
ID/ GDP |
PRB/ GDP |
1 |
2 |
3 |
4 |
5 =
3*4 |
6=
5/2 |
7 |
8=
(5*7)/2 |
9 |
10=
9/7 |
11 =
4+10 |
12=
10-5 |
13=
11-5 |
14 |
15 =
10-14 |
16=
14-5 |
2007-08 |
8.24 |
32.8 |
11.2 |
3.68 |
51.97 |
47 |
24.37 |
3.42 |
7.40 |
18.62 |
3.72 |
14.94 |
1.40 |
6.00 |
-2.28 |
2008-09 |
7.83 |
31.6 |
11.4 |
3.60 |
50.14 |
53 |
26.59 |
2.22 |
4.19 |
15.58 |
0.59 |
11.98 |
1.17 |
3.02 |
-2.43 |
2009-10 |
7.82 |
30.0 |
11.6 |
3.47 |
48.31 |
60 |
28.95 |
2.36 |
4.44 |
16.00 |
0.98 |
12.54 |
0.94 |
3.50 |
-2.53 |
2010-11 |
7.81 |
28.4 |
11.8 |
3.34 |
47.04 |
68 |
31.85 |
2.91 |
4.85 |
16.61 |
1.51 |
13.27 |
0.71 |
4.14 |
-2.63 |
2011-12 |
7.73 |
26.8 |
12.0 |
3.22 |
45.49 |
77 |
34.81 |
2.96 |
4.37 |
16.37 |
1.15 |
13.15 |
0.48 |
3.89 |
-2.74 |
2012-13 |
7.69 |
25.2 |
12.3 |
3.09 |
43.77 |
86 |
37.85 |
3.04 |
3.97 |
16.25 |
0.88 |
13.16 |
0.25 |
3.72 |
-2.84 |
2013-14 |
7.67 |
23.6 |
12.6 |
2.97 |
42.10 |
98 |
41.13 |
3.28 |
3.80 |
16.40 |
0.83 |
13.42 |
0.00 |
3.80 |
-2.97 |
2014-15 |
7.65 |
22.0 |
13.0 |
2.85 |
42.25 |
110 |
46.64 |
5.51 |
5.64 |
18.60 |
2.79 |
15.75 |
0.00 |
5.64 |
-2.85 |
Scenario 19- Constant Interest rate, IP/RR reduction by 2.27%, Nominal GDP growth of 12% |
Year |
Int. Rate |
IP/ RR |
RR/ GDP |
IP/ GDP |
Debt/ GDP |
GDP
(Rs.Tri.) |
Debt
(Rs.Tri) |
Dt-D(t-l) |
GFD/ GDP |
TE/ GDP |
PD |
PE |
CD/ GDP |
ID/ GDP |
PRB/ GDP |
1 |
2 |
3 |
4 |
5 =
3*4 |
6=
5/2 |
7 |
8=
(5*7)/2 |
9 |
10=
9/7 |
11 =
4+10 |
12=
10-5 |
13=
11-5 |
14 |
15 =
10-14 |
16=
14-5 |
2007-08 |
8.24 |
32.8 |
11.2 |
3.68 |
51.97 |
47 |
24.37 |
3.42 |
7.40 |
18.62 |
3.72 |
14.94 |
1.40 |
6.00 |
-2.28 |
2008-09 |
7.83 |
31.6 |
11.4 |
3.60 |
48.22 |
53 |
25.57 |
1.20 |
2.26 |
13.66 |
-1.34 |
10.06 |
1.17 |
1.09 |
-2.43 |
2009-10 |
7.83 |
29.3 |
11.5 |
3.37 |
45.01 |
59 |
26.73 |
1.16 |
2.19 |
13.68 |
-1.18 |
10.31 |
0.94 |
1.25 |
-2.43 |
2010-11 |
7.83 |
27.1 |
11.6 |
3.15 |
41.83 |
67 |
27.83 |
1.09 |
1.84 |
13.47 |
-1.30 |
10.32 |
0.71 |
1.13 |
-2.44 |
2011-12 |
7.83 |
24.8 |
11.8 |
2.92 |
38.66 |
75 |
28.80 |
0.98 |
1.47 |
13.27 |
-1.46 |
10.34 |
0.48 |
0.99 |
-2.44 |
2012-13 |
7.83 |
22.5 |
12.0 |
2.70 |
35.47 |
83 |
29.59 |
0.79 |
1.06 |
13.06 |
-1.64 |
10.36 |
0.25 |
0.81 |
-2.45 |
2013-14 |
7.83 |
20.3 |
12.2 |
2.48 |
32.22 |
93 |
30.11 |
0.51 |
0.62 |
12.86 |
-1.86 |
10.38 |
0.00 |
0.62 |
-2.48 |
2014-15 |
7.83 |
18.0 |
12.5 |
2.25 |
32.18 |
105 |
33.69 |
3.58 |
3.83 |
16.36 |
1.58 |
14.10 |
0.00 |
3.83 |
-2.25 |
Scenario 20- Constant Interest rate, IP/RR reduction by 1.93%, Nominal GDP growth of 12% |
Year |
Int. Rate |
IP/ RR |
RR/ GDP |
IP/ GDP |
Debt/ GDP |
GDP
(Rs.Tri.) |
Debt
(Rs.Tri) |
Dt-D(t-l) |
GFD/ GDP |
TE/ GDP |
PD |
PE |
CD/ GDP |
ID/ GDP |
PRB/ GDP |
1 |
2 |
3 |
4 |
5 =
3*4 |
6=
5/2 |
7 |
8=
(5*7)/2 |
9 |
10=
9/7 |
11 =
4+10 |
12=
10-5 |
13=
11-5 |
14 |
15 =
10-14 |
16=
14-5 |
2007-08 |
8.24 |
32.8 |
11.2 |
3.68 |
51.97 |
47 |
24.37 |
3.42 |
7.40 |
18.62 |
3.72 |
14.94 |
1.40 |
6.00 |
-2.28 |
2008-09 |
7.83 |
31.6 |
11.4 |
3.60 |
48.76 |
53 |
25.85 |
1.48 |
2.80 |
14.19 |
-0.80 |
10.59 |
1.17 |
1.63 |
-2.43 |
2009-10 |
7.83 |
29.7 |
11.5 |
3.41 |
46.12 |
59 |
27.39 |
1.53 |
2.89 |
14.39 |
-0.52 |
10.98 |
0.94 |
1.95 |
-2.47 |
2010-11 |
7.83 |
27.7 |
11.6 |
3.23 |
43.53 |
67 |
28.96 |
1.57 |
2.64 |
14.27 |
-0.59 |
11.04 |
0.71 |
1.93 |
-2.52 |
2011-12 |
7.83 |
25.8 |
11.8 |
3.04 |
40.97 |
75 |
30.53 |
1.57 |
2.36 |
14.16 |
-0.68 |
11.11 |
0.48 |
1.88 |
-2.56 |
2012-13 |
7.83 |
23.9 |
12.0 |
2.87 |
38.42 |
83 |
32.06 |
1.54 |
2.06 |
14.06 |
-0.80 |
11.20 |
0.25 |
1.81 |
-2.62 |
2013-14 |
7.83 |
22.0 |
12.2 |
2.69 |
35.85 |
93 |
33.51 |
1.45 |
1.73 |
13.98 |
-0.95 |
11.29 |
0.00 |
1.73 |
-2.69 |
2014-15 |
7.83 |
20.0 |
12.5 |
2.51 |
35.74 |
105 |
37.41 |
3.90 |
4.18 |
16.70 |
1.67 |
14.20 |
0.00 |
4.18 |
-2.51 |
Scenario 21- Constant Interest rate, IP/RR reduction by 1.60%, Nominal GDP growth of 12% |
Year |
Int. Rate |
IP/ RR |
RR/ GDP |
IP/ GDP |
Debt/ GDP |
GDP
(Rs.Tri.) |
Debt
(Rs.Tri) |
Dt-D(t-l) |
GFD/ GDP |
TE/ GDP |
PD |
PE |
CD/ GDP |
ID/ GDP |
PRB/ GDP |
1 |
2 |
3 |
4 |
5 =
3*4 |
6=
5/2 |
7 |
8=
(5*7)/2 |
9 |
10=
9/7 |
11 =
4+10 |
12=
10-5 |
13=
11-5 |
14 |
15 =
10-14 |
16=
14-5 |
2007-08 |
8.24 |
32.8 |
11.2 |
3.68 |
51.97 |
47 |
24.37 |
3.42 |
7.40 |
18.62 |
3.72 |
14.94 |
1.40 |
6.00 |
-2.28 |
2008-09 |
7.83 |
31.6 |
11.4 |
3.60 |
49.30 |
53 |
26.14 |
1.77 |
3.34 |
14.73 |
-0.26 |
11.13 |
1.17 |
2.17 |
-2.43 |
2009-10 |
7.83 |
30.0 |
11.5 |
3.45 |
47.21 |
59 |
28.04 |
1.90 |
3.58 |
15.07 |
0.13 |
11.63 |
0.94 |
2.64 |
-2.51 |
2010-11 |
7.83 |
28.4 |
11.6 |
3.30 |
45.20 |
67 |
30.07 |
2.03 |
3.41 |
15.04 |
0.11 |
11.74 |
0.71 |
2.70 |
-2.59 |
2011-12 |
7.83 |
26.8 |
11.8 |
3.16 |
43.24 |
75 |
32.21 |
2.15 |
3.23 |
15.03 |
0.07 |
11.86 |
0.48 |
2.75 |
-2.68 |
2012-13 |
7.83 |
25.2 |
12.0 |
3.02 |
41.31 |
83 |
34.47 |
2.26 |
3.03 |
15.03 |
0.01 |
12.01 |
0.25 |
2.78 |
-2.77 |
2013-14 |
7.83 |
23.6 |
12.2 |
2.89 |
39.40 |
93 |
36.82 |
2.35 |
2.82 |
15.06 |
-0.07 |
12.17 |
0.00 |
2.82 |
-2.89 |
2014-15 |
7.83 |
22.0 |
12.5 |
2.76 |
39.32 |
105 |
41.15 |
4.33 |
4.63 |
17.16 |
1.88 |
14.40 |
0.00 |
4.63 |
-2.76 |
Scenario 22- Interest rate reduction by 0.1%, IP/RR reduction by 2.27%, Nominal GDP growth of 12% |
Year |
Int. Rate |
IP/ RR |
RR/ GDP |
IP/ GDP |
Debt/ GDP |
GDP
(Rs.Tri.) |
Debt (Rs.Tri) |
Dt-D(t-l) |
GFD/ GDP |
TE/ GDP |
PD |
PE |
CD/ GDP |
ID/ GDP |
PRB/ GDP |
1 |
2 |
3 |
4 |
5 =
3*4 |
6=
5/2 |
7 |
8=
(5*7)/2 |
9 |
10=
9/7 |
11 =
4+10 |
12=
10-5 |
13=
11-5 |
14 |
15 =
10-14 |
16=
14-5 |
2007-08 |
8.24 |
32.8 |
11.2 |
3.68 |
51.97 |
47 |
24.37 |
3.42 |
7.40 |
18.62 |
3.72 |
14.94 |
1.40 |
6.00 |
-2.28 |
2008-09 |
7.83 |
31.6 |
11.4 |
3.60 |
48.82 |
53 |
25.89 |
1.52 |
2.86 |
14.26 |
-0.74 |
10.65 |
1.17 |
1.69 |
-2.43 |
2009-10 |
7.73 |
29.3 |
11.5 |
3.37 |
46.16 |
59 |
27.42 |
1.53 |
2.88 |
14.38 |
-0.49 |
11.01 |
0.94 |
1.94 |
-2.43 |
2010-11 |
7.63 |
27.1 |
11.6 |
3.15 |
43.47 |
67 |
28.92 |
1.50 |
2.53 |
14.16 |
-0.62 |
11.01 |
0.71 |
1.82 |
-2.44 |
2011-12 |
7.53 |
24.8 |
11.8 |
2.92 |
40.72 |
75 |
30.34 |
1.42 |
2.13 |
13.93 |
-0.79 |
11.00 |
0.48 |
1.65 |
-2.44 |
2012-13 |
7.43 |
22.5 |
12.0 |
2.70 |
37.87 |
83 |
31.60 |
1.26 |
1.69 |
13.69 |
-1.01 |
10.99 |
0.25 |
1.44 |
-2.45 |
2013-14 |
7.33 |
20.3 |
12.2 |
2.48 |
34.87 |
93 |
32.59 |
0.99 |
1.19 |
13.44 |
-1.29 |
10.96 |
0.00 |
1.19 |
-2.48 |
2014-15 |
7.23 |
18.0 |
12.5 |
2.25 |
34.85 |
105 |
36.48 |
3.89 |
4.17 |
16.69 |
1.91 |
14.44 |
0.00 |
4.17 |
-2.25 |
Scenario 23- Interest rate rate reduction by 0.1%, IP/RR reduction by 1.93%, Nominal GDP growth of 12% |
Year |
Int. Rate |
IP/ RR |
RR/ GDP |
IP/ GDP |
Debt/ GDP |
GDP
(Rs.Tri.) |
Debt (Rs. Tri) |
Dt-D(t-l) |
GFD/ GDP |
TE/ GDP |
PD |
PE |
CD/ GDP |
ID/ GDP |
PRB/ GDP |
1 |
2 |
3 |
4 |
5 =
3*4 |
6=
5/2 |
7 |
8=
(5*7)/2 |
9 |
10=
9/7 |
11 =
4+10 |
12=
10-5 |
13=
11-5 |
14 |
15 =
10-14 |
16=
14-5 |
2007-08 |
8.24 |
32.8 |
11.2 |
3.68 |
51.97 |
47 |
24.37 |
3.42 |
7.40 |
18.62 |
3.72 |
14.94 |
1.40 |
6.00 |
-2.28 |
2008-09 |
7.83 |
31.6 |
11.4 |
3.60 |
49.39 |
53 |
26.19 |
1.82 |
3.43 |
14.82 |
-0.17 |
11.22 |
1.17 |
2.26 |
-2.43 |
2009-10 |
7.73 |
29.7 |
11.5 |
3.41 |
47.32 |
59 |
28.11 |
1.92 |
3.62 |
15.11 |
0.21 |
11.70 |
0.94 |
2.68 |
-2.47 |
2010-11 |
7.63 |
27.7 |
11.6 |
3.23 |
45.26 |
67 |
30.11 |
2.00 |
3.37 |
15.00 |
0.15 |
11.77 |
0.71 |
2.66 |
-2.52 |
2011-12 |
7.53 |
25.8 |
11.8 |
3.04 |
43.18 |
75 |
32.17 |
2.06 |
3.10 |
14.89 |
0.05 |
11.85 |
0.48 |
2.62 |
-2.56 |
2012-13 |
7.43 |
23.9 |
12.0 |
2.87 |
41.04 |
83 |
34.25 |
2.08 |
2.79 |
14.79 |
-0.08 |
11.93 |
0.25 |
2.54 |
-2.62 |
2013-14 |
7.33 |
22.0 |
12.2 |
2.69 |
38.83 |
93 |
36.29 |
2.04 |
2.44 |
14.69 |
-0.24 |
12.00 |
0.00 |
2.44 |
-2.69 |
2014-15 |
7.23 |
20.0 |
12.5 |
2.51 |
38.73 |
105 |
40.54 |
4.25 |
4.55 |
17.07 |
2.04 |
14.57 |
0.00 |
4.55 |
-2.51 |
Scenario 24- Interest rate reduction by 0.1%, IP/RR reduction by 1.60%, Nominal GDP growth of 12% |
Year |
Int. Rate |
IP/ RR |
RR/ GDP |
IP/ GDP |
Debt/ GDP |
GDP
(Rs.Tri.) |
Debt (Rs.Tri) |
Dt-D(t-l) |
GFD/ GDP |
TE/ GDP |
PD |
PE |
CD/ GDP |
ID/ GDP |
PRB/ GDP |
1 |
2 |
3 |
4 |
5 =
3*4 |
6=
5/2 |
7 |
8=
(5*7)/2 |
9 |
10=
9/7 |
11 =
4+10 |
12=
10-5 |
13=
11-5 |
14 |
15 =
10-14 |
16=
14-5 |
2007-08 |
8.24 |
32.8 |
11.2 |
3.68 |
51.97 |
47 |
24.37 |
3.42 |
7.40 |
18.62 |
3.72 |
14.94 |
1.40 |
6.00 |
-2.28 |
2008-09 |
7.83 |
31.6 |
11.4 |
3.60 |
49.93 |
53 |
26.48 |
2.11 |
3.98 |
15.37 |
0.38 |
11.77 |
1.17 |
2.81 |
-2.43 |
2009-10 |
7.73 |
30.0 |
11.5 |
3.45 |
48.45 |
59 |
28.78 |
2.30 |
4.33 |
15.82 |
0.88 |
12.37 |
0.94 |
3.39 |
-2.51 |
2010-11 |
7.63 |
28.4 |
11.6 |
3.30 |
47.00 |
67 |
31.26 |
2.49 |
4.19 |
15.82 |
0.89 |
12.52 |
0.71 |
3.48 |
-2.59 |
2011-12 |
7.53 |
26.8 |
11.8 |
3.16 |
45.57 |
75 |
33.95 |
2.68 |
4.03 |
15.83 |
0.87 |
12.67 |
0.48 |
3.55 |
-2.68 |
2012-13 |
7.43 |
25.2 |
12.0 |
3.02 |
44.13 |
83 |
36.82 |
2.88 |
3.86 |
15.86 |
0.83 |
12.84 |
0.25 |
3.61 |
-2.77 |
2013-14 |
7.33 |
23.6 |
12.2 |
2.89 |
42.67 |
93 |
39.88 |
3.05 |
3.66 |
15.90 |
0.77 |
13.01 |
0.00 |
3.66 |
-2.89 |
2014-15 |
7.23 |
22.0 |
12.5 |
2.76 |
42.60 |
105 |
44.59 |
4.71 |
5.04 |
17.57 |
2.29 |
14.81 |
0.00 |
5.04 |
-2.76 |
Scenario 25- Interest rate based on forecast, IP/RR reduction by 2.27%, Nominal GDP growth of 12% |
Year |
Int. Rate |
IP/ RR |
RR/ GDP |
IP/ GDP |
Debt/ GDP |
GDP
(Rs.Tri.) |
Debt (Rs.Tri) |
Dt-D(t-l) |
GFD/ GDP |
TE/ GDP |
PD |
PE |
CD/ GDP |
ID/ GDP |
PRB/ GDP |
1 |
2 |
3 |
4 |
5 =
3*4 |
6=
5/2 |
7 |
8=
(5*7)/2 |
9 |
10=
9/7 |
11 =
4+10 |
12=
10-5 |
13=
11-5 |
14 |
15 =
10-14 |
16=
14-5 |
2007-08 |
8.24 |
32.8 |
11.2 |
3.68 |
51.97 |
47 |
24.37 |
3.42 |
7.40 |
18.62 |
3.72 |
14.94 |
1.40 |
6.00 |
-2.28 |
2008-09 |
7.83 |
31.6 |
11.4 |
3.60 |
48.31 |
53 |
25.62 |
1.25 |
2.35 |
13.75 |
-1.25 |
10.15 |
1.17 |
1.18 |
-2.43 |
2009-10 |
7.82 |
29.3 |
11.5 |
3.37 |
45.10 |
59 |
26.79 |
1.17 |
2.20 |
13.69 |
-1.17 |
10.32 |
0.94 |
1.26 |
-2.43 |
2010-11 |
7.81 |
27.1 |
11.6 |
3.15 |
42.39 |
67 |
28.20 |
1.42 |
2.38 |
14.01 |
-0.76 |
10.86 |
0.71 |
1.67 |
-2.44 |
2011-12 |
7.73 |
24.8 |
11.8 |
2.92 |
39.39 |
75 |
29.35 |
1.14 |
1.72 |
13.52 |
-1.21 |
10.59 |
0.48 |
1.24 |
-2.44 |
2012-13 |
7.69 |
22.5 |
12.0 |
2.70 |
36.19 |
83 |
30.19 |
0.85 |
1.14 |
13.14 |
-1.56 |
10.44 |
0.25 |
0.89 |
-2.45 |
2013-14 |
7.67 |
20.3 |
12.2 |
2.48 |
32.96 |
93 |
30.81 |
0.61 |
0.73 |
12.98 |
-1.75 |
10.50 |
0.00 |
0.73 |
-2.48 |
2014-15 |
7.65 |
18.0 |
12.5 |
2.25 |
32.94 |
105 |
34.48 |
3.67 |
3.93 |
16.46 |
1.68 |
14.21 |
0.00 |
3.93 |
-2.25 |
Scenario 26- Interest rate based on forecast, IP/RR reduction by 1.93%, Nominal GDP growth of 12% |
Year |
Int. Rate |
IP/ RR |
RR/ GDP |
IP/ GDP |
Debt/ GDP |
GDP
(Rs.Tri.) |
Debt (Rs.Tri) |
Dt-D(t-l) |
GFD/ GDP |
TE/ GDP |
PD |
PE |
CD/ GDP |
ID/ GDP |
PRB/ GDP |
1 |
2 |
3 |
4 |
5-
3*4 |
6-
5/2 |
7 |
8-
(5*7)/2 |
9 |
10-
9/7 |
11-
4+10 |
12-
10-5 |
13-
11-5 |
14 |
15-
10-14 |
16-
14-5 |
2007-08 |
8.24 |
32.8 |
11.2 |
3.68 |
51.97 |
47 |
24.37 |
3.42 |
7.40 |
18.62 |
3.72 |
14.94 |
1.40 |
6.00 |
-2.28 |
2008-09 |
7.83 |
31.6 |
11.4 |
3.60 |
48.87 |
53 |
25.92 |
1.54 |
2.91 |
14.31 |
-0.69 |
10.71 |
1.17 |
1.74 |
-2.43 |
2009-10 |
7.82 |
29.7 |
11.5 |
3.41 |
46.23 |
59 |
27.46 |
1.54 |
2.91 |
14.40 |
-0.50 |
10.99 |
0.94 |
1.97 |
-2.47 |
2010-11 |
7.81 |
27.7 |
11.6 |
3.23 |
44.14 |
67 |
29.36 |
1.90 |
3.20 |
14.83 |
-0.02 |
11.61 |
0.71 |
2.49 |
-2.52 |
2011-12 |
7.73 |
25.8 |
11.8 |
3.04 |
41.77 |
75 |
31.12 |
1.76 |
2.64 |
14.44 |
-0.41 |
11.39 |
0.48 |
2.16 |
-2.56 |
2012-13 |
7.69 |
23.9 |
12.0 |
2.87 |
39.22 |
83 |
32.73 |
1.61 |
2.16 |
14.17 |
-0.70 |
11.30 |
0.25 |
1.91 |
-2.62 |
2013-14 |
7.67 |
22.0 |
12.2 |
2.69 |
36.70 |
93 |
34.30 |
1.57 |
1.88 |
14.13 |
-0.80 |
11.44 |
0.00 |
1.88 |
-2.69 |
2014-15 |
7.65 |
20.0 |
12.5 |
2.51 |
36.60 |
105 |
38.31 |
4.01 |
4.29 |
16.82 |
1.78 |
14.31 |
0.00 |
4.29 |
-2.51 |
Scenario 27- Interest rate based on forecast, IP/RR reduction by 1.60%, Nominal GDP growth of 12% |
Year |
Int. Rate |
IP/ RR |
RR/ GDP |
IP/ GDP |
Debt/ GDP |
GDP
(Rs.Tri.) |
Debt (Rs. Tri) |
Dt-D(t-l) |
GFD/ GDP |
TE/ GDP |
PD |
PE |
CD/ GDP |
ID/ GDP |
PRB/ GDP |
1 |
2 |
3 |
4 |
5 =
3*4 |
6=
5/2 |
7 |
8=
(5*7)/2 |
9 |
10=
9/7 |
11 =
4+10 |
12=
10-5 |
13=
11-5 |
14 |
15 =
10-14 |
16=
14-5 |
2007-08 |
8.24 |
32.8 |
11.2 |
3.68 |
51.97 |
47 |
24.37 |
3.42 |
7.40 |
18.62 |
3.72 |
14.94 |
1.40 |
6.00 |
-2.28 |
2008-09 |
7.83 |
31.6 |
11.4 |
3.60 |
49.41 |
53 |
26.20 |
1.83 |
3.46 |
14.85 |
-0.14 |
11.25 |
1.17 |
2.29 |
-2.43 |
2009-10 |
7.82 |
30.0 |
11.5 |
3.45 |
47.33 |
59 |
28.11 |
1.91 |
3.60 |
15.09 |
0.15 |
11.64 |
0.94 |
2.66 |
-2.51 |
2010-11 |
7.81 |
28.4 |
11.6 |
3.30 |
45.83 |
67 |
30.49 |
2.38 |
4.00 |
15.63 |
0.70 |
12.32 |
0.71 |
3.29 |
-2.59 |
2011-12 |
7.73 |
26.8 |
11.8 |
3.16 |
44.07 |
75 |
32.84 |
2.35 |
3.53 |
15.33 |
0.37 |
12.17 |
0.48 |
3.05 |
-2.68 |
2012-13 |
7.69 |
25.2 |
12.0 |
3.02 |
42.17 |
83 |
35.19 |
2.35 |
3.16 |
15.16 |
0.13 |
12.13 |
0.25 |
2.91 |
-2.77 |
2013-14 |
7.67 |
23.6 |
12.2 |
2.89 |
40.33 |
93 |
37.69 |
2.50 |
3.00 |
15.25 |
0.11 |
12.36 |
0.00 |
3.00 |
-2.89 |
2014-15 |
7.65 |
22.0 |
12.5 |
2.76 |
40.26 |
105 |
42.14 |
4.45 |
4.76 |
17.29 |
2.00 |
14.53 |
0.00 |
4.76 |
-2.76 |
Scenario 28- Constant Interest rate, IP/RR reduction by 2.27%, Nominal GDP growth of 14%-Low Revenue Buoyancy Scenario |
Year |
Int. Rate |
IP/ RR |
RR/ GDP |
IP/ GDP |
Debt/ GDP |
GDP
(Rs.Tri.) |
Debt (Rs.Tri) |
Dt-D(t-l) |
GFD/ GDP |
TE/ GDP |
PD |
PE |
CD/ GDP |
ID/ GDP |
PRB/ GDP |
1 |
2 |
3 |
4 |
5 =
3*4 |
6=
5/2 |
7 |
8=
(5*7)/2 |
9 |
10=
9/7 |
11 =
4+10 |
12=
10-5 |
13=
11-5 |
14 |
15 =
10-14 |
16=
14-5 |
2007-08 |
8.24 |
32.8 |
11.2 |
3.68 |
51.97 |
47 |
24.37 |
3.42 |
7.4 |
18.62 |
3.72 |
14.94 |
1.40 |
6.00 |
-2.28 |
2008-09 |
7.83 |
31.6 |
11.4 |
3.60 |
49.08 |
53 |
26.03 |
1.66 |
3.12 |
14.52 |
-0.48 |
10.92 |
1.17 |
1.95 |
-2.43 |
2009-10 |
7.83 |
29.3 |
11.5 |
3.37 |
45.68 |
60 |
27.61 |
1.59 |
2.99 |
14.49 |
-0.38 |
11.12 |
0.94 |
2.05 |
-2.43 |
2010-11 |
7.83 |
27.1 |
11.6 |
3.14 |
42.21 |
69 |
29.09 |
1.48 |
2.45 |
14.04 |
-0.69 |
10.90 |
0.71 |
1.74 |
-2.43 |
2011-12 |
7.83 |
24.8 |
11.7 |
2.90 |
38.68 |
79 |
30.39 |
1.30 |
1.89 |
13.58 |
-1.01 |
10.68 |
0.48 |
1.41 |
-2.42 |
2012-13 |
7.83 |
22.5 |
11.8 |
2.66 |
35.09 |
90 |
31.43 |
1.04 |
1.32 |
13.12 |
-1.34 |
10.46 |
0.25 |
1.07 |
-2.41 |
2013-14 |
7.83 |
20.3 |
11.9 |
2.41 |
31.43 |
102 |
32.09 |
0.66 |
0.74 |
12.64 |
-1.67 |
10.23 |
0.00 |
0.74 |
-2.41 |
2014-15 |
7.83 |
18.0 |
12.0 |
2.16 |
31.45 |
116 |
36.61 |
4.51 |
4.42 |
16.43 |
2.26 |
14.27 |
0.00 |
4.42 |
-2.16 |
Scenario 29- Constant Interest rate, IP/RR reduction by 1.93%, Nominal GDP growth of 14% |
Year |
Int. Rate |
IP/ RR |
RR/ GDP |
IP/ GDP |
Debt/ GDP |
GDP
(Rs.Tri.) |
Debt (Rs. Tri) |
Dt-D(t-l) |
GFD/ GDP |
TE/ GDP |
PD |
PE |
CD/ GDP |
ID/ GDP |
PRB/ GDP |
1 |
2 |
3 |
4 |
5 =
3*4 |
6=
5/2 |
7 |
8=
(5*7)/2 |
9 |
10=
9/7 |
11 =
4+10 |
12=
10-5 |
13=
11-5 |
14 |
15 =
10-14 |
16=
14-5 |
2007-08 |
8.24 |
32.8 |
11.2 |
3.68 |
51.97 |
47 |
24.37 |
3.42 |
7.4 |
18.62 |
3.72 |
14.94 |
1.40 |
6.00 |
-2.28 |
2008-09 |
7.83 |
31.6 |
11.4 |
3.60 |
49.62 |
53 |
26.32 |
1.94 |
3.67 |
15.06 |
0.07 |
11.46 |
1.17 |
2.50 |
-2.43 |
2009-10 |
7.83 |
29.7 |
11.5 |
3.41 |
46.80 |
60 |
28.29 |
1.98 |
3.73 |
15.22 |
0.32 |
11.81 |
0.94 |
2.79 |
-2.47 |
2010-11 |
7.83 |
27.7 |
11.6 |
3.22 |
43.93 |
69 |
30.27 |
1.98 |
3.28 |
14.87 |
0.06 |
11.65 |
0.71 |
2.57 |
-2.51 |
2011-12 |
7.83 |
25.8 |
11.7 |
3.02 |
41.00 |
79 |
32.21 |
1.94 |
2.81 |
14.51 |
-0.21 |
11.49 |
0.48 |
2.33 |
-2.54 |
2012-13 |
7.83 |
23.9 |
11.8 |
2.82 |
38.02 |
90 |
34.05 |
1.84 |
2.34 |
14.14 |
-0.48 |
11.32 |
0.25 |
2.09 |
-2.57 |
2013-14 |
7.83 |
22.0 |
11.9 |
2.61 |
34.98 |
102 |
35.71 |
1.66 |
1.86 |
13.76 |
-0.75 |
11.15 |
0.00 |
1.86 |
-2.61 |
2014-15 |
7.83 |
20.0 |
12.0 |
2.40 |
34.92 |
116 |
40.65 |
4.94 |
4.84 |
16.84 |
2.43 |
14.44 |
0.00 |
4.84 |
-2.40 |
Scenario 30- Constant Interest rate, IP/RR reduction by 1.60%, Nominal GDP growth of 14% |
Year |
Int. Rate |
IP/ RR |
RR/ GDP |
IP/ GDP |
Debt/ GDP |
GDP
(Rs.Tri.) |
Debt
(Rs.Tri) |
Dt-D(t-l) |
GFD/ GDP |
TE/ GDP |
PD |
PE |
CD/ GDP |
ID/ GDP |
PRB/ GDP |
1 |
2 |
3 |
4 |
5 =
3*4 |
6=
5/2 |
7 |
8=
(5*7)/2 |
9 |
10=
9/7 |
11 =
4+10 |
12=
10-5 |
13=
11-5 |
14 |
15 =
10-14 |
16=
14-5 |
2007-08 |
8.24 |
32.8 |
11.2 |
3.68 |
51.97 |
47 |
24.37 |
3.42 |
7.4 |
18.62 |
3.72 |
14.94 |
1.40 |
6.00 |
-2.28 |
2008-09 |
7.83 |
31.6 |
11.4 |
3.60 |
50.18 |
53 |
26.61 |
2.24 |
4.22 |
15.61 |
0.62 |
12.01 |
1.17 |
3.05 |
-2.43 |
2009-10 |
7.83 |
30.0 |
11.5 |
3.45 |
47.92 |
60 |
28.97 |
2.36 |
4.45 |
15.94 |
1.00 |
12.49 |
0.94 |
3.51 |
-2.51 |
2010-11 |
7.83 |
28.4 |
11.6 |
3.29 |
45.61 |
69 |
31.44 |
2.47 |
4.08 |
15.68 |
0.79 |
12.38 |
0.71 |
3.37 |
-2.58 |
2011-12 |
7.83 |
26.8 |
11.7 |
3.13 |
43.27 |
79 |
33.99 |
2.56 |
3.71 |
15.41 |
0.58 |
12.27 |
0.48 |
3.23 |
-2.65 |
2012-13 |
7.83 |
25.2 |
11.8 |
2.97 |
40.87 |
90 |
36.61 |
2.62 |
3.33 |
15.13 |
0.36 |
12.16 |
0.25 |
3.08 |
-2.72 |
2013-14 |
7.83 |
23.6 |
11.9 |
2.81 |
38.44 |
102 |
39.25 |
2.64 |
2.94 |
14.85 |
0.14 |
12.04 |
0.00 |
2.94 |
-2.81 |
2014-15 |
7.83 |
22.0 |
12.0 |
2.64 |
38.42 |
116 |
44.72 |
5.47 |
5.36 |
17.36 |
2.72 |
14.72 |
0.00 |
5.36 |
-2.64 |
Scenario 31- Interest rate reduction by 0.1 %, IP/RR reduction by 2.27%, Nominal GDP growth of 14% |
Year |
Int. Rate |
IP/ RR |
RR/ GDP |
IP/ GDP |
Debt/ GDP |
GDP
(Rs.Tri.) |
Debt (Rs.Tri) |
Dt-D(t-l) |
GFD/ GDP |
TE/ GDP |
PD |
PE |
CD/ GDP |
ID/ GDP |
PRB/ GDP |
1 |
2 |
3 |
4 |
5 =
3*4 |
6=
5/2 |
7 |
8=
(5*7)/2 |
9 |
10=
9/7 |
11 =
4+10 |
12=
10-5 |
13=
11-5 |
14 |
15 =
10-14 |
16=
14-5 |
2007-08 |
8.24 |
32.8 |
11.2 |
3.68 |
51.97 |
47 |
24.37 |
3.42 |
7.4 |
18.62 |
3.72 |
14.94 |
1.40 |
6.00 |
-2.28 |
2008-09 |
7.83 |
31.6 |
11.4 |
3.60 |
49.69 |
53 |
26.35 |
1.98 |
3.73 |
15.12 |
0.13 |
11.52 |
1.17 |
2.56 |
-2.43 |
2009-10 |
7.73 |
29.3 |
11.5 |
3.37 |
46.85 |
60 |
28.32 |
1.97 |
3.72 |
15.21 |
0.35 |
11.84 |
0.94 |
2.78 |
-2.43 |
2010-11 |
7.63 |
27.1 |
11.6 |
3.14 |
43.87 |
69 |
30.24 |
1.91 |
3.16 |
14.76 |
0.03 |
11.62 |
0.71 |
2.45 |
-2.43 |
2011-12 |
7.53 |
24.8 |
11.7 |
2.90 |
40.75 |
79 |
32.01 |
1.78 |
2.58 |
14.27 |
-0.32 |
11.37 |
0.48 |
2.10 |
-2.42 |
2012-13 |
7.43 |
22.5 |
11.8 |
2.66 |
37.46 |
90 |
33.55 |
1.54 |
1.96 |
13.76 |
-0.69 |
11.10 |
0.25 |
1.71 |
-2.41 |
2013-14 |
7.33 |
20.3 |
11.9 |
2.41 |
34.02 |
102 |
34.74 |
1.18 |
1.32 |
13.22 |
-1.09 |
10.81 |
0.00 |
1.32 |
-2.41 |
2014-15 |
7.23 |
18.0 |
12.0 |
2.16 |
34.06 |
116 |
39.64 |
4.91 |
4.81 |
16.81 |
2.65 |
14.65 |
0.00 |
4.81 |
-2.16 |
Scenario 32- Interest rate reduction by 0.1% , IP/RR reduction by 1.93%, Nominal GDP growth of 14% |
Year |
Int. Rate |
IP/ RR |
RR/ GDP |
IP/ GDP |
Debt/ GDP |
GDP
(Rs.Tri.) |
Debt (Rs.Tri) |
Dt-D(t-l) |
GFD/ GDP |
TE/ GDP |
PD |
PE |
CD/ GDP |
ID/ GDP |
PRB/ GDP |
1 |
2 |
3 |
4 |
5 =
3*4 |
6=
5/2 |
7 |
8=
(5*7)/2 |
9 |
10=
9/7 |
11 =
4+10 |
12=
10-5 |
13=
11-5 |
14 |
15 =
10-14 |
16=
14-5 |
2007-08 |
8.24 |
32.8 |
11.2 |
3.68 |
51.97 |
47 |
24.37 |
3.42 |
7.4 |
18.62 |
3.72 |
14.94 |
1.40 |
6.00 |
-2.28 |
2008-09 |
7.83 |
31.6 |
11.4 |
3.60 |
50.27 |
53 |
26.66 |
2.28 |
4.31 |
15.70 |
0.71 |
12.10 |
1.17 |
3.14 |
-2.43 |
2009-10 |
7.73 |
29.7 |
11.5 |
3.41 |
48.03 |
60 |
29.04 |
2.38 |
4.49 |
15.98 |
1.08 |
12.57 |
0.94 |
3.55 |
-2.47 |
2010-11 |
7.63 |
27.7 |
11.6 |
3.22 |
45.68 |
69 |
31.48 |
2.44 |
4.04 |
15.64 |
0.83 |
12.42 |
0.71 |
3.33 |
-2.51 |
2011-12 |
7.53 |
25.8 |
11.7 |
3.02 |
43.21 |
79 |
33.95 |
2.47 |
3.58 |
15.27 |
0.56 |
12.25 |
0.48 |
3.10 |
-2.54 |
2012-13 |
7.43 |
23.9 |
11.8 |
2.82 |
40.61 |
90 |
36.37 |
2.43 |
3.09 |
14.89 |
0.27 |
12.07 |
0.25 |
2.84 |
-2.57 |
2013-14 |
7.33 |
22.0 |
11.9 |
2.61 |
37.88 |
102 |
38.68 |
2.31 |
2.57 |
14.48 |
-0.04 |
11.86 |
0.00 |
2.57 |
-2.61 |
2014-15 |
7.23 |
20.0 |
12.0 |
2.40 |
37.84 |
116 |
44.05 |
5.37 |
5.26 |
17.27 |
2.86 |
14.86 |
0.00 |
5.26 |
-2.40 |
Scenario 33- Interest rate reduction by 0.1%, IP/RR reduction by 1.60%, Nominal GDP growth of 14% |
Year |
Int. Rate |
IP/ RR |
RR/ GDP |
IP/ GDP |
Debt/ GDP |
GDP
(Rs.Tri.) |
Debt (Rs.Tri) |
Dt-D(t-l) |
GFD/ GDP |
TE/ GDP |
PD |
PE |
CD/ GDP |
ID/ GDP |
PRB/ GDP |
1 |
2 |
3 |
4 |
5 =
3*4 |
6=
5/2 |
7 |
8=
(5*7)/2 |
9 |
10=
9/7 |
11 =
4+10 |
12=
10-5 |
13=
11-5 |
14 |
15 =
10-14 |
16=
14-5 |
2007-08 |
8.24 |
32.8 |
11.2 |
3.68 |
51.97 |
47 |
24.37 |
3.42 |
7.4 |
18.62 |
3.72 |
14.94 |
1.40 |
6.00 |
-2.28 |
2008-09 |
7.83 |
31.6 |
11.4 |
3.60 |
50.82 |
53 |
26.95 |
2.58 |
4.87 |
16.26 |
1.27 |
12.66 |
1.17 |
3.70 |
-2.43 |
2009-10 |
7.73 |
30.0 |
11.5 |
3.45 |
49.17 |
60 |
29.73 |
2.77 |
5.23 |
16.72 |
1.78 |
13.28 |
0.94 |
4.29 |
-2.51 |
2010-11 |
7.63 |
28.4 |
11.6 |
3.29 |
47.43 |
69 |
32.69 |
2.96 |
4.90 |
16.49 |
1.61 |
13.20 |
0.71 |
4.19 |
-2.58 |
2011-12 |
7.53 |
26.8 |
11.7 |
3.13 |
45.59 |
79 |
35.82 |
3.13 |
4.55 |
16.24 |
1.41 |
13.11 |
0.48 |
4.07 |
-2.65 |
2012-13 |
7.43 |
25.2 |
11.8 |
2.97 |
43.66 |
90 |
39.11 |
3.28 |
4.18 |
15.98 |
1.21 |
13.00 |
0.25 |
3.93 |
-2.72 |
2013-14 |
7.33 |
23.6 |
11.9 |
2.81 |
41.63 |
102 |
42.50 |
3.40 |
3.79 |
15.69 |
0.98 |
12.89 |
0.00 |
3.79 |
-2.81 |
2014-15 |
7.23 |
22.0 |
12.0 |
2.64 |
41.63 |
116 |
48.45 |
5.95 |
5.83 |
17.83 |
3.19 |
15.19 |
0.00 |
5.83 |
-2.64 |
Scenario 34- Interest rate based on forecast, IP/RR reduction by 2.27%, Nominal GDP growth of 14% |
Year |
Int. Rate |
IP/ RR |
RR/ GDP |
IP/ GDP |
Debt/ GDP |
GDP
(Rs.Tri.) |
Debt (Rs.Tri) |
Dt-D(t-l) |
GFD/ GDP |
TE/ GDP |
PD |
PE |
CD/ GDP |
ID/ GDP |
PRB/ GDP |
1 |
2 |
3 |
4 |
5 =
3*4 |
6=
5/2 |
7 |
8=
(5*7)/2 |
9 |
10=
9/7 |
11 =
4+10 |
12=
10-5 |
13=
11-5 |
14 |
15 =
10-14 |
16=
14-5 |
2007-08 |
8.24 |
32.8 |
11.2 |
3.68 |
51.97 |
47 |
24.37 |
3.42 |
7.4 |
18.62 |
3.72 |
14.94 |
1.40 |
6.00 |
-2.28 |
2008-09 |
7.83 |
31.6 |
11.4 |
3.60 |
49.17 |
53 |
26.07 |
1.70 |
3.21 |
14.60 |
-0.39 |
11.00 |
1.17 |
2.04 |
-2.43 |
2009-10 |
7.82 |
29.3 |
11.5 |
3.37 |
45.76 |
60 |
27.66 |
1.59 |
3.00 |
14.50 |
-0.37 |
11.12 |
0.94 |
2.06 |
-2.43 |
2010-11 |
7.81 |
27.1 |
11.6 |
3.14 |
42.77 |
69 |
29.47 |
1.81 |
2.99 |
14.59 |
-0.14 |
11.45 |
0.71 |
2.28 |
-2.43 |
2011-12 |
7.73 |
24.8 |
11.7 |
2.90 |
39.39 |
79 |
30.95 |
1.47 |
2.14 |
13.83 |
-0.76 |
10.94 |
0.48 |
1.66 |
-2.42 |
2012-13 |
7.69 |
22.5 |
11.8 |
2.66 |
35.78 |
90 |
32.04 |
1.09 |
1.39 |
13.19 |
-1.26 |
10.54 |
0.25 |
1.14 |
-2.41 |
2013-14 |
7.67 |
20.2 |
11.9 |
2.41 |
32.13 |
102 |
32.80 |
0.76 |
0.85 |
12.75 |
-1.56 |
10.34 |
0.00 |
0.85 |
-2.41 |
2014-15 |
7.65 |
18.0 |
12.0 |
2.16 |
32.19 |
116 |
37.47 |
4.67 |
4.57 |
16.58 |
2.41 |
14.42 |
0.00 |
4.57 |
-2.16 |
Scenario 35- Interest rate based on forecast, IP/RR reduction by 1.93%, Nominal GDP growth of 14% |
Year |
Int. Rate |
IP/ RR |
RR/ GDP |
IP/ GDP |
Debt/ GDP |
GDP
(Rs.Tri.) |
Debt (Rs. Tri) |
Dt-D(t-l) |
GFD/ GDP |
TE/ GDP |
PD |
PE |
CD/ GDP |
ID/ GDP |
PRB/ GDP |
1 |
2 |
3 |
4 |
5 =
3*4 |
6=
5/2 |
7 |
8=
(5*7)/2 |
9 |
10=
9/7 |
11 =
4+10 |
12=
10-5 |
13=
11-5 |
14 |
15 =
10-14 |
16=
14-5 |
2007-08 |
8.24 |
32.8 |
11.2 |
3.68 |
51.97 |
47 |
24.37 |
3.42 |
7.4 |
18.62 |
3.72 |
14.94 |
1.40 |
6.00 |
-2.28 |
2008-09 |
7.83 |
31.6 |
11.4 |
3.60 |
49.74 |
53 |
26.38 |
2.01 |
3.78 |
15.18 |
0.18 |
11.58 |
1.17 |
2.61 |
-2.43 |
2009-10 |
7.82 |
29.7 |
11.5 |
3.41 |
46.92 |
60 |
28.37 |
1.99 |
3.75 |
15.24 |
0.34 |
11.83 |
0.94 |
2.81 |
-2.47 |
2010-11 |
7.81 |
27.7 |
11.6 |
3.22 |
44.54 |
69 |
30.70 |
2.33 |
3.86 |
15.45 |
0.64 |
12.24 |
0.71 |
3.15 |
-2.51 |
2011-12 |
7.73 |
25.8 |
11.7 |
3.02 |
41.79 |
79 |
32.83 |
2.14 |
3.10 |
14.80 |
0.08 |
11.78 |
0.48 |
2.62 |
-2.54 |
2012-13 |
7.69 |
23.9 |
11.8 |
2.82 |
38.81 |
90 |
34.76 |
1.92 |
2.45 |
14.25 |
-0.37 |
11.43 |
0.25 |
2.20 |
-2.57 |
2013-14 |
7.67 |
22.0 |
11.9 |
2.61 |
35.81 |
102 |
36.56 |
1.80 |
2.01 |
13.91 |
-0.60 |
11.30 |
0.00 |
2.01 |
-2.61 |
2014-15 |
7.65 |
20.0 |
12.0 |
2.40 |
35.76 |
116 |
41.63 |
5.07 |
4.97 |
16.97 |
2.56 |
14.57 |
0.00 |
4.97 |
-2.40 |
Scenario 36- Interest rate based on forecast. IP/RR reduction bv 1.60%. Nominal GDP growth of 14% |
Year |
Int. Rate |
IP/ RR |
RR/ GDP |
IP/ GDP |
Debt/ GDP |
GDP
(Rs.Tri.) |
Debt (Rs.Tri) |
Dt-D(t-l) |
GFD/ GDP |
TE/ GDP |
PD |
PE |
CD/ GDP |
ID/ GDP |
PRB/ GDP |
1 |
2 |
3 |
4 |
5 =
3*4 |
6=
5/2 |
7 |
8=
(5*7)/2 |
9 |
10=
9/7 |
11 =
4+10 |
12=
10-5 |
13=
11-5 |
14 |
15 =
10-14 |
16=
14-5 |
2007-08 |
8.24 |
32.8 |
11.2 |
3.68 |
51.97 |
47 |
24.37 |
3.42 |
7.4 |
18.62 |
3.72 |
14.94 |
1.40 |
6.00 |
-2.28 |
2008-09 |
7.83 |
31.6 |
11.4 |
3.60 |
50.29 |
53 |
26.67 |
2.30 |
4.34 |
15.73 |
0.74 |
12.13 |
1.17 |
3.17 |
-2.43 |
2009-10 |
7.82 |
30.0 |
11.5 |
3.45 |
48.04 |
60 |
29.04 |
2.37 |
4.47 |
15.96 |
1.02 |
12.51 |
0.94 |
3.53 |
-2.51 |
2010-11 |
7.81 |
28.4 |
11.6 |
3.29 |
46.25 |
69 |
31.88 |
2.83 |
4.69 |
16.28 |
1.40 |
12.99 |
0.71 |
3.98 |
-2.58 |
2011-12 |
7.73 |
26.8 |
11.7 |
3.13 |
44.10 |
79 |
34.65 |
2.77 |
4.02 |
15.72 |
0.89 |
12.59 |
0.48 |
3.54 |
-2.65 |
2012-13 |
7.69 |
25.2 |
11.8 |
2.97 |
41.72 |
90 |
37.37 |
2.72 |
3.46 |
15.26 |
0.49 |
12.29 |
0.25 |
3.21 |
-2.72 |
2013-14 |
7.67 |
23.6 |
11.9 |
2.81 |
39.35 |
102 |
40.18 |
2.81 |
3.13 |
15.03 |
0.32 |
12.23 |
0.00 |
3.13 |
-2.81 |
2014-15 |
7.65 |
22.0 |
12.0 |
2.64 |
39.34 |
116 |
45.79 |
5.62 |
5.50 |
17.51 |
2.86 |
14.87 |
0.00 |
5.50 |
-2.64 |
Scenario 37- Constant Interest rate, IP/RR reduction by 2.27%, Nominal GDP growth of 13% |
Year |
Int. Rate |
IP/ RR |
RR/ GDP |
IP/ GDP |
Debt/ GDP |
GDP
(Rs.Tri.) |
Debt (Rs.Tri) |
Dt-D(t-l) |
GFD/ GDP |
TE/ GDP |
PD |
PE |
CD/ GDP |
ID/ GDP |
PRB/ GDP |
1 |
2 |
3 |
4 |
5 =
3*4 |
6=
5/2 |
7 |
8=
(5*7)/2 |
9 |
10=
9/7 |
11 =
4+10 |
12=
10-5 |
13=
11-5 |
14 |
15 =
10-14 |
16=
14-5 |
2007-08 |
8.24 |
32.8 |
11.2 |
3.68 |
51.97 |
47 |
24.37 |
3.42 |
7.4 |
18.62 |
3.72 |
14.94 |
1.40 |
6.00 |
-2.28 |
2008-09 |
7.83 |
31.6 |
11.4 |
3.60 |
48.65 |
53 |
25.80 |
1.43 |
2.70 |
14.09 |
-0.91 |
10.49 |
1.17 |
1.53 |
-2.43 |
2009-10 |
7.83 |
29.3 |
11.5 |
3.37 |
45.29 |
60 |
27.14 |
1.34 |
2.52 |
14.01 |
-0.85 |
10.64 |
0.94 |
1.58 |
-2.43 |
2010-11 |
7.83 |
27.1 |
11.6 |
3.14 |
41.85 |
68 |
28.34 |
1.20 |
2.01 |
13.61 |
-1.13 |
10.47 |
0.71 |
1.30 |
-2.43 |
2011-12 |
7.83 |
24.8 |
11.7 |
2.90 |
38.36 |
77 |
29.35 |
1.01 |
1.49 |
13.19 |
-1.41 |
10.29 |
0.48 |
1.01 |
-2.42 |
2012-13 |
7.83 |
22.5 |
11.8 |
2.66 |
34.80 |
86 |
30.09 |
0.74 |
0.96 |
12.76 |
-1.70 |
10.11 |
0.25 |
0.71 |
-2.41 |
2013-14 |
7.83 |
20.3 |
11.9 |
2.41 |
31.17 |
98 |
30.45 |
0.37 |
0.42 |
12.33 |
-1.99 |
9.92 |
0.00 |
0.42 |
-2.41 |
2014-15 |
7.83 |
18.0 |
12.0 |
2.16 |
31.17 |
110 |
34.42 |
3.96 |
4.06 |
16.07 |
1.90 |
13.91 |
0.00 |
4.06 |
-2.16 |
Scenario 38- Constant Interest rate, IP/RR reduction by 1.93%, Nominal GDP growth of 13% |
Year |
Int. Rate |
IP/ RR |
RR/ GDP |
IP/ GDP |
Debt/ GDP |
GDP
(Rs.Tri.) |
Debt (Rs.Tri) |
Dt-D(t-l) |
GFD/ GDP |
TE/ GDP |
PD |
PE |
CD/ GDP |
ID/ GDP |
PRB/ GDP |
1 |
2 |
3 |
4 |
5 =
3*4 |
6=
5/2 |
7 |
8=
(5*7)/2 |
9 |
10=
9/7 |
11 =
4+10 |
12=
10-5 |
13=
11-5 |
14 |
15 =
10-14 |
16=
14-5 |
2007-08 |
8.24 |
32.8 |
11.2 |
3.68 |
51.97 |
47 |
24.37 |
3.42 |
7.4 |
18.62 |
3.72 |
14.94 |
1.40 |
6.00 |
-2.28 |
2008-09 |
7.83 |
31.6 |
11.4 |
3.60 |
49.19 |
53 |
26.09 |
1.72 |
3.23 |
14.63 |
-0.37 |
11.03 |
1.17 |
2.06 |
-2.43 |
2009-10 |
7.83 |
29.7 |
11.5 |
3.41 |
46.40 |
60 |
27.80 |
1.72 |
3.24 |
14.73 |
-0.17 |
11.32 |
0.94 |
2.30 |
-2.47 |
2010-11 |
7.83 |
27.7 |
11.6 |
3.22 |
43.55 |
68 |
29.49 |
1.69 |
2.82 |
14.41 |
-0.40 |
11.20 |
0.71 |
2.11 |
-2.51 |
2011-12 |
7.83 |
25.8 |
11.7 |
3.02 |
40.65 |
77 |
31.11 |
1.61 |
2.38 |
14.08 |
-0.63 |
11.06 |
0.48 |
1.90 |
-2.54 |
2012-13 |
7.83 |
23.9 |
11.8 |
2.82 |
37.70 |
86 |
32.60 |
1.49 |
1.95 |
13.75 |
-0.87 |
10.93 |
0.25 |
1.70 |
-2.57 |
2013-14 |
7.83 |
22.0 |
11.9 |
2.61 |
34.69 |
98 |
33.89 |
1.30 |
1.50 |
13.41 |
-1.11 |
10.79 |
0.00 |
1.50 |
-2.61 |
2014-15 |
7.83 |
20.0 |
12.0 |
2.40 |
34.62 |
110 |
38.22 |
4.33 |
4.43 |
16.44 |
2.03 |
14.04 |
0.00 |
4.43 |
-2.40 |
Scenario 39- Constant Interest rate, IP/RR reduction by 1.60%, Nominal GDP growth of 13% |
Year |
Int. Rate |
IP/ RR |
RR/ GDP |
IP/ GDP |
Debt/ GDP |
GDP
(Rs.Tri.) |
Debt (Rs.Tri) |
Dt-D(t-l) |
GFD/ GDP |
TE/ GDP |
PD |
PE |
CD/ GDP |
ID/ GDP |
PRB/ GDP |
1 |
2 |
3 |
4 |
5 =
3*4 |
6=
5/2 |
7 |
8=
(5*7)/2 |
9 |
10=
9/7 |
11 =
4+10 |
12=
10-5 |
13=
11-5 |
14 |
15 =
10-14 |
16=
14-5 |
2007-08 |
8.24 |
32.8 |
11.2 |
3.68 |
51.97 |
47 |
24.37 |
3.42 |
7.4 |
18.62 |
3.72 |
14.94 |
1.40 |
6.00 |
-2.28 |
2008-09 |
7.83 |
31.6 |
11.4 |
3.60 |
49.74 |
53 |
26.38 |
2.01 |
3.78 |
15.17 |
0.18 |
11.57 |
1.17 |
2.61 |
-2.43 |
2009-10 |
7.83 |
30.0 |
11.5 |
3.45 |
47.50 |
60 |
28.47 |
2.09 |
3.94 |
15.43 |
0.49 |
11.99 |
0.94 |
3.00 |
-2.51 |
2010-11 |
7.83 |
28.4 |
11.6 |
3.29 |
45.22 |
68 |
30.62 |
2.16 |
3.60 |
15.20 |
0.31 |
11.90 |
0.71 |
2.89 |
-2.58 |
2011-12 |
7.83 |
26.8 |
11.7 |
3.14 |
42.90 |
77 |
32.83 |
2.20 |
3.25 |
14.95 |
0.12 |
11.82 |
0.48 |
2.77 |
-2.66 |
2012-13 |
7.83 |
25.2 |
11.8 |
2.97 |
40.53 |
86 |
35.05 |
2.22 |
2.90 |
14.70 |
-0.07 |
11.73 |
0.25 |
2.65 |
-2.72 |
2013-14 |
7.83 |
23.6 |
11.9 |
2.81 |
38.12 |
98 |
37.24 |
2.20 |
2.54 |
14.45 |
-0.27 |
11.64 |
0.00 |
2.54 |
-2.81 |
2014-15 |
7.83 |
22.0 |
12.0 |
2.64 |
38.08 |
110 |
42.04 |
4.80 |
4.91 |
16.92 |
2.27 |
14.28 |
0.00 |
4.91 |
-2.64 |
Scenario 40- Interest rate reduction by 0.1%, IP/RR reduction by 2.27%, Nominal GDP growth of 13% |
Year |
Int. Rate |
IP/ RR |
RR/ GDP |
IP/ GDP |
Debt/ GDP |
GDP
(Rs.Tri.) |
Debt (Rs.Tri) |
Dt-D(t-l) |
GFD/ GDP |
TE/ GDP |
PD |
PE |
CD/ GDP |
ID/ GDP |
PRB/ GDP |
1 |
2 |
3 |
4 |
5 =
3*4 |
6=
5/2 |
7 |
8=
(5*7)/2 |
9 |
10=
9/7 |
11 =
4+10 |
12=
10-5 |
13=
11-5 |
14 |
15 =
10-14 |
16=
14-5 |
2007-08 |
8.24 |
32.8 |
11.2 |
3.68 |
51.97 |
47 |
24.37 |
3.42 |
7.4 |
18.62 |
3.72 |
14.94 |
1.40 |
6.00 |
-2.28 |
2008-09 |
7.83 |
31.6 |
11.4 |
3.60 |
49.26 |
53 |
26.12 |
1.75 |
3.30 |
14.69 |
-0.30 |
11.09 |
1.17 |
2.13 |
-2.43 |
2009-10 |
7.73 |
29.3 |
11.5 |
3.37 |
46.45 |
60 |
27.83 |
1.71 |
3.23 |
14.72 |
-0.14 |
11.35 |
0.94 |
2.29 |
-2.43 |
2010-11 |
7.63 |
27.1 |
11.6 |
3.14 |
43.50 |
68 |
29.45 |
1.62 |
2.70 |
14.30 |
-0.43 |
11.16 |
0.71 |
1.99 |
-2.43 |
2011-12 |
7.53 |
24.8 |
11.7 |
2.90 |
40.40 |
77 |
30.91 |
1.46 |
2.15 |
13.85 |
-0.75 |
10.95 |
0.48 |
1.67 |
-2.42 |
2012-13 |
7.43 |
22.5 |
11.8 |
2.66 |
37.15 |
86 |
32.12 |
1.21 |
1.58 |
13.38 |
-1.08 |
10.72 |
0.25 |
1.33 |
-2.41 |
2013-14 |
7.33 |
20.3 |
11.9 |
2.41 |
33.74 |
98 |
32.96 |
0.84 |
0.97 |
12.88 |
-1.44 |
10.47 |
0.00 |
0.97 |
-2.41 |
2014-15 |
7.23 |
18.0 |
12.0 |
2.16 |
33.76 |
110 |
37.27 |
4.31 |
4.41 |
16.42 |
2.25 |
14.26 |
0.00 |
4.41 |
-2.16 |
Scenario 41- Interest rate rate reduction by 0.1%, IP/RR reduction by 1.93%, Nominal GDP growth of 13% |
Year |
Int. Rate |
IP/ RR |
RR/ GDP |
IP/ GDP |
Debt/ GDP |
GDP
(Rs.Tri.) |
Debt (Rs.Tri) |
Dt-D(t-l) |
GFD/ GDP |
TE/ GDP |
PD |
PE |
CD/ GDP |
ID/ GDP |
PRB/ GDP |
1 |
2 |
3 |
4 |
5 =
3*4 |
6=
5/2 |
7 |
8=
(5*7)/2 |
9 |
10=
9/7 |
11 =
4+10 |
12=
10-5 |
13=
11-5 |
14 |
15 =
10-14 |
16=
14-5 |
2007-08 |
8.24 |
32.8 |
11.2 |
3.68 |
51.97 |
47 |
24.37 |
3.42 |
7.4 |
18.62 |
3.72 |
14.94 |
1.40 |
6.00 |
-2.28 |
2008-09 |
7.83 |
31.6 |
11.4 |
3.60 |
49.83 |
53 |
26.42 |
2.05 |
3.87 |
15.26 |
0.27 |
11.66 |
1.17 |
2.70 |
-2.43 |
2009-10 |
7.73 |
29.7 |
11.5 |
3.41 |
47.62 |
60 |
28.53 |
2.11 |
3.98 |
15.47 |
0.57 |
12.06 |
0.94 |
3.04 |
-2.47 |
2010-11 |
7.63 |
27.7 |
11.6 |
3.22 |
45.29 |
68 |
30.67 |
2.13 |
3.56 |
15.16 |
0.34 |
11.94 |
0.71 |
2.85 |
-2.51 |
2011-12 |
7.53 |
25.8 |
11.7 |
3.02 |
42.84 |
77 |
32.78 |
2.11 |
3.12 |
14.82 |
0.10 |
11.80 |
0.48 |
2.64 |
-2.54 |
2012-13 |
7.43 |
23.9 |
11.8 |
2.82 |
40.27 |
86 |
34.82 |
2.04 |
2.66 |
14.46 |
-0.16 |
11.65 |
0.25 |
2.41 |
-2.57 |
2013-14 |
7.33 |
22.0 |
11.9 |
2.61 |
37.56 |
98 |
36.70 |
1.88 |
2.18 |
14.09 |
-0.43 |
11.47 |
0.00 |
2.18 |
-2.61 |
2014-15 |
7.23 |
20.0 |
12.0 |
2.40 |
37.51 |
110 |
41.41 |
4.71 |
4.82 |
16.83 |
2.42 |
14.43 |
0.00 |
4.82 |
-2.40 |
Scenario 42- Interest rate reduction by 0.1%, IP/RR reduction by 1.60%, Nominal GDP growth of 13% |
Year |
Int. Rate |
IP/ RR |
RR/ GDP |
IP/ GDP |
Debt/ GDP |
GDP
(Rs.Tri.) |
Debt (Rs.Tri) |
Dt-D(t-l) |
GFD/ GDP |
TE/ GDP |
PD |
PE |
CD/ GDP |
ID/ GDP |
PRB/ GDP |
1 |
2 |
3 |
4 |
5 =
3*4 |
6=
5/2 |
7 |
8=
(5*7)/2 |
9 |
10=
9/7 |
11 =
4+10 |
12=
10-5 |
13=
11-5 |
14 |
15 =
10-14 |
16=
14-5 |
2007-08 |
8.24 |
32.8 |
11.2 |
3.68 |
51.97 |
47 |
24.37 |
3.42 |
7.4 |
18.62 |
3.72 |
14.94 |
1.40 |
6.00 |
-2.28 |
2008-09 |
7.83 |
31.6 |
11.4 |
3.60 |
50.38 |
53 |
26.72 |
2.35 |
4.42 |
15.82 |
0.82 |
12.22 |
1.17 |
3.25 |
-2.43 |
2009-10 |
7.73 |
30.0 |
11.5 |
3.45 |
48.75 |
60 |
29.21 |
2.49 |
4.70 |
16.20 |
1.25 |
12.75 |
0.94 |
3.76 |
-2.51 |
2010-11 |
7.63 |
28.4 |
11.6 |
3.29 |
47.02 |
68 |
31.84 |
2.63 |
4.39 |
15.99 |
1.10 |
12.69 |
0.71 |
3.68 |
-2.58 |
2011-12 |
7.53 |
26.8 |
11.7 |
3.14 |
45.21 |
77 |
34.59 |
2.75 |
4.06 |
15.76 |
0.93 |
12.62 |
0.48 |
3.58 |
-2.66 |
2012-13 |
7.43 |
25.2 |
11.8 |
2.97 |
43.30 |
86 |
37.43 |
2.84 |
3.72 |
15.52 |
0.74 |
12.54 |
0.25 |
3.47 |
-2.72 |
2013-14 |
7.33 |
23.6 |
11.9 |
2.81 |
41.28 |
98 |
40.33 |
2.90 |
3.35 |
15.26 |
0.54 |
12.45 |
0.00 |
3.35 |
-2.81 |
2014-15 |
7.23 |
22.0 |
12.0 |
2.64 |
41.26 |
110 |
45.56 |
5.22 |
5.35 |
17.36 |
2.70 |
14.71 |
0.00 |
5.35 |
-2.64 |
Scenario 43- Interest rate based on forecast, IP/RR reduction by 2.27%, Nominal GDP growth of 13% |
Year |
Int. Rate |
IP/ RR |
RR/ GDP |
IP/ GDP |
Debt/ GDP |
GDP
(Rs.Tri.) |
Debt (Rs.Tri) |
Dt-D(t-l) |
GFD/ GDP |
TE/ GDP |
PD |
PE |
CD/ GDP |
ID/ GDP |
PRB/ GDP |
1 |
2 |
3 |
4 |
5 =
3*4 |
6=
5/2 |
7 |
8=
(5*7)/2 |
9 |
10=
9/7 |
11 =
4+10 |
12=
10-5 |
13=
11-5 |
14 |
15 =
10-14 |
16=
14-5 |
2007-08 |
8.24 |
32.8 |
11.2 |
3.68 |
51.97 |
47 |
24.37 |
3.42 |
7.4 |
18.62 |
3.72 |
14.94 |
1.40 |
6.00 |
-2.28 |
2008-09 |
7.83 |
31.6 |
11.4 |
3.60 |
48.74 |
53 |
25.85 |
1.48 |
2.79 |
14.18 |
-0.81 |
10.58 |
1.17 |
1.62 |
-2.43 |
2009-10 |
7.82 |
29.3 |
11.5 |
3.37 |
45.38 |
60 |
27.19 |
1.34 |
2.53 |
14.03 |
-0.84 |
10.66 |
0.94 |
1.59 |
-2.43 |
2010-11 |
7.81 |
27.1 |
11.6 |
3.14 |
42.42 |
68 |
28.72 |
1.53 |
2.55 |
14.15 |
-0.58 |
11.01 |
0.71 |
1.84 |
-2.43 |
2011-12 |
7.73 |
24.8 |
11.7 |
2.90 |
39.08 |
77 |
29.90 |
1.18 |
1.74 |
13.44 |
-1.16 |
10.54 |
0.48 |
1.26 |
-2.42 |
2012-13 |
7.69 |
22.5 |
11.8 |
2.66 |
35.50 |
86 |
30.70 |
0.79 |
1.04 |
12.84 |
-1.62 |
10.18 |
0.25 |
0.79 |
-2.41 |
2013-14 |
7.67 |
20.3 |
11.9 |
2.41 |
31.89 |
98 |
31.16 |
0.46 |
0.53 |
12.44 |
-1.88 |
10.03 |
0.00 |
0.53 |
-2.41 |
2014-15 |
7.65 |
18.0 |
12.0 |
2.16 |
31.91 |
110 |
35.23 |
4.07 |
4.16 |
16.18 |
2.00 |
14.02 |
0.00 |
4.16 |
-2.16 |
Scenario 44- Interest rate based on forecast, IP/RR reduction by 1.93%, Nominal GDP growth of 13% |
Year |
Int. Rate |
IP/ RR |
RR/ GDP |
IP/ GDP |
Debt/ GDP |
GDP
(Rs.Tri.) |
Debt (Rs.Tri) |
Dt-D(t-l) |
GFD/ GDP |
TE/ GDP |
PD |
PE |
CD/ GDP |
ID/ GDP |
PRB/ GDP |
1 |
2 |
3 |
4 |
5 =
3*4 |
6=
5/2 |
7 |
8=
(5*7)/2 |
9 |
10=
9/7 |
11 =
4+10 |
12=
10-5 |
13=
11-5 |
14 |
15 =
10-14 |
16=
14-5 |
2007-08 |
8.24 |
32.8 |
11.2 |
3.68 |
51.97 |
47 |
24.37 |
3.42 |
7.4 |
18.62 |
3.72 |
14.94 |
1.40 |
6.00 |
-2.28 |
2008-09 |
7.83 |
31.6 |
11.4 |
3.60 |
49.31 |
53 |
26.15 |
1.78 |
3.35 |
14.74 |
-0.25 |
11.14 |
1.17 |
2.18 |
-2.43 |
2009-10 |
7.82 |
29.7 |
11.5 |
3.41 |
46.52 |
60 |
27.88 |
1.73 |
3.26 |
14.75 |
-0.15 |
11.34 |
0.94 |
2.32 |
-2.47 |
2010-11 |
7.81 |
27.7 |
11.6 |
3.22 |
44.16 |
68 |
29.90 |
2.03 |
3.39 |
14.98 |
0.17 |
11.77 |
0.71 |
2.68 |
-2.51 |
2011-12 |
7.73 |
25.8 |
11.7 |
3.02 |
41.44 |
77 |
31.71 |
1.80 |
2.66 |
14.36 |
-0.36 |
11.34 |
0.48 |
2.18 |
-2.54 |
2012-13 |
7.69 |
23.9 |
11.8 |
2.82 |
38.48 |
86 |
33.27 |
1.57 |
2.05 |
13.85 |
-0.77 |
11.03 |
0.25 |
1.80 |
-2.57 |
2013-14 |
7.67 |
22.0 |
11.9 |
2.61 |
35.51 |
98 |
34.69 |
1.42 |
1.64 |
13.55 |
-0.97 |
10.94 |
0.00 |
1.64 |
-2.61 |
2014-15 |
7.65 |
20.0 |
12.0 |
2.40 |
35.45 |
110 |
39.14 |
4.45 |
4.55 |
16.56 |
2.15 |
14.16 |
0.00 |
4.55 |
-2.40 |
Scenario 45- Interest rate based on forecast, IP/RR reduction by 1.60%, Nominal GDP growth of 13% |
Year |
Int. Rate |
IP/ RR |
RR/ GDP |
IP/ GDP |
Debt/ GDP |
GDP
(Rs.Tri.) |
Debt (Rs.Tri) |
Dt-D(t-l) |
GFD/ GDP |
TE/ GDP |
PD |
PE |
CD/ GDP |
ID/ GDP |
PRB/ GDP |
1 |
2 |
3 |
4 |
5 =
3*4 |
6=
5/2 |
7 |
8=
(5*7)/2 |
9 |
10=
9/7 |
11 =
4+10 |
12=
10-5 |
13=
11-5 |
14 |
15 =
10-14 |
16=
14-5 |
2007-08 |
8.24 |
32.8 |
11.2 |
3.68 |
51.97 |
47 |
24.37 |
3.42 |
7.4 |
18.62 |
3.72 |
14.94 |
1.40 |
6.00 |
-2.28 |
2008-09 |
7.83 |
31.6 |
11.4 |
3.60 |
49.86 |
53 |
26.44 |
2.07 |
3.90 |
15.29 |
0.30 |
11.69 |
1.17 |
2.73 |
-2.43 |
2009-10 |
7.82 |
30.0 |
11.5 |
3.45 |
47.62 |
60 |
28.54 |
2.10 |
3.96 |
15.45 |
0.51 |
12.00 |
0.94 |
3.02 |
-2.51 |
2010-11 |
7.81 |
28.4 |
11.6 |
3.29 |
45.86 |
68 |
31.05 |
2.51 |
4.19 |
15.79 |
0.90 |
12.50 |
0.71 |
3.48 |
-2.58 |
2011-12 |
7.73 |
26.8 |
11.7 |
3.14 |
43.73 |
77 |
33.46 |
2.41 |
3.56 |
15.26 |
0.42 |
12.12 |
0.48 |
3.08 |
-2.66 |
2012-13 |
7.69 |
25.2 |
11.8 |
2.97 |
41.37 |
86 |
35.77 |
2.31 |
3.02 |
14.83 |
0.05 |
11.85 |
0.25 |
2.77 |
-2.72 |
2013-14 |
7.67 |
23.6 |
11.9 |
2.81 |
39.02 |
98 |
38.12 |
2.35 |
2.72 |
14.63 |
-0.09 |
11.82 |
0.00 |
2.72 |
-2.81 |
2014-15 |
7.65 |
22.0 |
12.0 |
2.64 |
39.00 |
110 |
43.05 |
4.93 |
5.04 |
17.06 |
2.40 |
14.41 |
0.00 |
5.04 |
-2.64 |
Scenario 46- Constant Interest rate, IP/RR reduction by 2.27%, Nominal GDP growth of 12% |
Year |
Int. Rate |
IP/ RR |
RR/ GDP |
IP/ GDP |
Debt/ GDP |
GDP
(Rs.Tri.) |
Debt (Rs.Tri) |
Dt-D(t-l) |
GFD/ GDP |
TE/ GDP |
PD |
PE |
CD/ GDP |
ID/ GDP |
PRB/ GDP |
1 |
2 |
3 |
4 |
5 =
3*4 |
6=
5/2 |
7 |
8=
(5*7)/2 |
9 |
10=
9/7 |
11 =
4+10 |
12=
10-5 |
13=
11-5 |
14 |
15 =
10-14 |
16=
14-5 |
2007-08 |
8.24 |
32.8 |
11.2 |
3.68 |
51.97 |
47 |
24.37 |
3.42 |
7.4 |
18.62 |
3.72 |
14.94 |
1.40 |
6.00 |
-2.28 |
2008-09 |
7.83 |
31.6 |
11.4 |
3.60 |
48.23 |
53 |
25.57 |
1.20 |
2.27 |
13.66 |
-1.33 |
10.06 |
1.17 |
1.10 |
-2.43 |
2009-10 |
7.83 |
29.3 |
11.5 |
3.37 |
44.89 |
59 |
26.66 |
1.09 |
2.05 |
13.55 |
-1.32 |
10.18 |
0.94 |
1.11 |
-2.43 |
2010-11 |
7.83 |
27.1 |
11.6 |
3.14 |
41.49 |
67 |
27.60 |
0.94 |
1.58 |
13.18 |
-1.56 |
10.04 |
0.71 |
0.87 |
-2.43 |
2011-12 |
7.83 |
24.8 |
11.7 |
2.90 |
38.03 |
75 |
28.33 |
0.73 |
1.10 |
12.80 |
-1.80 |
9.90 |
0.48 |
0.62 |
-2.42 |
2012-13 |
7.83 |
22.5 |
11.8 |
2.66 |
34.50 |
83 |
28.79 |
0.46 |
0.61 |
12.42 |
-2.05 |
9.76 |
0.25 |
0.36 |
-2.41 |
2013-14 |
7.83 |
20.3 |
11.9 |
2.41 |
30.91 |
93 |
28.89 |
0.10 |
0.11 |
12.03 |
-2.30 |
9.61 |
0.00 |
0.11 |
-2.41 |
2014-15 |
7.83 |
18.0 |
12.0 |
2.16 |
30.90 |
105 |
32.34 |
3.45 |
3.70 |
15.71 |
1.54 |
13.55 |
0.00 |
3.70 |
-2.16 |
Scenario 47- Constant Interest rate, IP/RR reduction by 1.93%, Nominal GDP growth of 12% |
Year |
Int. Rate |
IP/ RR |
RR/ GDP |
IP/ GDP |
Debt/ GDP |
GDP
(Rs.Tri.) |
Debt (Rs.Tri) |
Dt-D(t-l) |
GFD/ GDP |
TE/ GDP |
PD |
PE |
CD/ GDP |
ID/ GDP |
PRB/ GDP |
1 |
2 |
3 |
4 |
5 =
3*4 |
6=
5/2 |
7 |
8=
(5*7)/2 |
9 |
10=
9/7 |
11 =
4+10 |
12=
10-5 |
13=
11-5 |
14 |
15 =
10-14 |
16=
14-5 |
2007-08 |
8.24 |
32.8 |
11.2 |
3.68 |
51.97 |
47 |
24.37 |
3.42 |
7.4 |
18.62 |
3.72 |
14.94 |
1.40 |
6.00 |
-2.28 |
2008-09 |
7.83 |
31.6 |
11.4 |
3.60 |
48.76 |
53 |
25.86 |
1.49 |
2.80 |
14.20 |
-0.80 |
10.60 |
1.17 |
1.63 |
-2.43 |
2009-10 |
7.83 |
29.7 |
11.5 |
3.41 |
46.00 |
59 |
27.32 |
1.46 |
2.75 |
14.25 |
-0.66 |
10.84 |
0.94 |
1.81 |
-2.47 |
2010-11 |
7.83 |
27.7 |
11.6 |
3.22 |
43.18 |
67 |
28.72 |
1.40 |
2.36 |
13.96 |
-0.85 |
10.74 |
0.71 |
1.65 |
-2.51 |
2011-12 |
7.83 |
25.8 |
11.7 |
3.02 |
40.31 |
75 |
30.03 |
1.31 |
1.96 |
13.67 |
-1.06 |
10.65 |
0.48 |
1.48 |
-2.54 |
2012-13 |
7.83 |
23.9 |
11.8 |
2.82 |
37.38 |
83 |
31.19 |
1.16 |
1.56 |
13.36 |
-1.26 |
10.55 |
0.25 |
1.31 |
-2.57 |
2013-14 |
7.83 |
22.0 |
11.9 |
2.61 |
34.40 |
93 |
32.15 |
0.96 |
1.15 |
13.06 |
-1.47 |
10.44 |
0.00 |
1.15 |
-2.61 |
2014-15 |
7.83 |
20.0 |
12.0 |
2.41 |
34.31 |
105 |
35.91 |
3.77 |
4.03 |
16.05 |
1.63 |
13.64 |
0.00 |
4.03 |
-2.41 |
Scenario 48- Constant Interest rate, IP/RR reduction by 1.60%, Nominal GDP growth of 12% |
Year |
Int. Rate |
IP/ RR |
RR/ GDP |
IP/ GDP |
Debt/ GDP |
GDP
(Rs.Tri.) |
Debt (Rs.Tri) |
Dt-D(t-l) |
GFD/ GDP |
TE/ GDP |
PD |
PE |
CD/ GDP |
ID/ GDP |
PRB/ GDP |
1 |
2 |
3 |
4 |
5 =
3*4 |
6=
5/2 |
7 |
8=
(5*7)/2 |
9 |
10=
9/7 |
11 =
4+10 |
12=
10-5 |
13=
11-5 |
14 |
15 =
10-14 |
16=
14-5 |
2007-08 |
8.24 |
32.8 |
11.2 |
3.68 |
51.97 |
47 |
24.37 |
3.42 |
7.4 |
18.62 |
3.72 |
14.94 |
1.40 |
6.00 |
-2.28 |
2008-09 |
7.83 |
31.6 |
11.4 |
3.60 |
49.30 |
53 |
26.15 |
1.77 |
3.35 |
14.74 |
-0.26 |
11.14 |
1.17 |
2.18 |
-2.43 |
2009-10 |
7.83 |
30.0 |
11.5 |
3.45 |
47.09 |
59 |
27.97 |
1.82 |
3.44 |
14.93 |
-0.01 |
11.48 |
0.94 |
2.50 |
-2.51 |
2010-11 |
7.83 |
28.4 |
11.6 |
3.29 |
44.83 |
67 |
29.82 |
1.86 |
3.12 |
14.72 |
-0.17 |
11.43 |
0.71 |
2.41 |
-2.58 |
2011-12 |
7.83 |
26.8 |
11.7 |
3.14 |
42.53 |
75 |
31.69 |
1.87 |
2.80 |
14.51 |
-0.33 |
11.37 |
0.48 |
2.32 |
-2.66 |
2012-13 |
7.83 |
25.2 |
11.8 |
2.98 |
40.19 |
83 |
33.54 |
1.85 |
2.48 |
14.28 |
-0.50 |
11.31 |
0.25 |
2.23 |
-2.73 |
2013-14 |
7.83 |
23.6 |
11.9 |
2.81 |
37.80 |
93 |
35.33 |
1.79 |
2.15 |
14.06 |
-0.67 |
11.25 |
0.00 |
2.15 |
-2.81 |
2014-15 |
7.83 |
22.0 |
12.0 |
2.64 |
37.74 |
105 |
39.51 |
4.18 |
4.47 |
16.49 |
1.83 |
13.85 |
0.00 |
4.47 |
-2.64 |
Scenario 49- Interest rate reduction by 0.1%, IP/RR reduction by 2.27%, Nominal GDP growth of 12% |
Year |
Int. Rate |
IP/ RR |
RR/ GDP |
IP/ GDP |
Debt/ GDP |
GDP
(Rs.Tri.) |
Debt (Rs.Tri) |
Dt-D(t-l) |
GFD/ GDP |
TE/ GDP |
PD |
PE |
CD/ GDP |
ID/ GDP |
PRB/ GDP |
1 |
2 |
3 |
4 |
5 =
3*4 |
6=
5/2 |
7 |
8=
(5*7)/2 |
9 |
10=
9/7 |
11 =
4+10 |
12=
10-5 |
13=
11-5 |
14 |
15 =
10-14 |
16=
14-5 |
2007-08 |
8.24 |
32.8 |
11.2 |
3.68 |
51.97 |
47 |
24.37 |
3.42 |
7.4 |
18.62 |
3.72 |
14.94 |
1.40 |
6.00 |
-2.28 |
2008-09 |
7.83 |
31.6 |
11.4 |
3.60 |
48.83 |
53 |
25.89 |
1.52 |
2.87 |
14.26 |
-0.73 |
10.66 |
1.17 |
1.70 |
-2.43 |
2009-10 |
7.73 |
29.3 |
11.5 |
3.37 |
46.04 |
59 |
27.35 |
1.46 |
2.74 |
14.24 |
-0.63 |
10.87 |
0.94 |
1.80 |
-2.43 |
2010-11 |
7.63 |
27.1 |
11.6 |
3.14 |
43.12 |
67 |
28.69 |
1.34 |
2.25 |
13.85 |
-0.88 |
10.71 |
0.71 |
1.54 |
-2.43 |
2011-12 |
7.53 |
24.8 |
11.7 |
2.90 |
40.06 |
75 |
29.84 |
1.16 |
1.74 |
13.44 |
-1.16 |
10.54 |
0.48 |
1.26 |
-2.42 |
2012-13 |
7.43 |
22.5 |
11.8 |
2.66 |
36.84 |
83 |
30.74 |
0.89 |
1.20 |
13.01 |
-1.46 |
10.35 |
0.25 |
0.95 |
-2.41 |
2013-14 |
7.33 |
20.3 |
11.9 |
2.41 |
33.45 |
93 |
31.27 |
0.53 |
0.63 |
12.54 |
-1.78 |
10.13 |
0.00 |
0.63 |
-2.41 |
2014-15 |
7.23 |
18.0 |
12.0 |
2.16 |
33.46 |
105 |
35.02 |
3.76 |
4.02 |
16.04 |
1.86 |
13.88 |
0.00 |
4.02 |
-2.16 |
Scenario 50- Interest rate rate reduction by 0.1%, IP/RR reduction by 1.93%, Nominal GDP growth of 12% |
Year |
Int. Rate |
IP/ RR |
RR/ GDP |
IP/ GDP |
Debt/ GDP |
GDP
(Rs.Tri.) |
Debt
(Rs.Tri) |
Dt-D(t-l) |
GFD/ GDP |
TE/ GDP |
PD |
PE |
CD/ GDP |
ID/ GDP |
PRB/ GDP |
1 |
2 |
3 |
4 |
5 =
3*4 |
6=
5/2 |
7 |
8=
(5*7)/2 |
9 |
10=
9/7 |
11 =
4+10 |
12=
10-5 |
13=
11-5 |
14 |
15 =
10-14 |
16=
14-5 |
2007-08 |
8.24 |
32.8 |
11.2 |
3.68 |
51.97 |
47 |
24.37 |
3.42 |
7.4 |
18.62 |
3.72 |
14.94 |
1.40 |
6.00 |
-2.28 |
2008-09 |
7.83 |
31.6 |
11.4 |
3.60 |
49.39 |
53 |
26.19 |
1.82 |
3.43 |
14.83 |
-0.17 |
11.23 |
1.17 |
2.26 |
-2.43 |
2009-10 |
7.73 |
29.7 |
11.5 |
3.41 |
47.20 |
59 |
28.03 |
1.84 |
3.47 |
14.97 |
0.06 |
11.56 |
0.94 |
2.53 |
-2.47 |
2010-11 |
7.63 |
27.7 |
11.6 |
3.22 |
44.90 |
67 |
29.87 |
1.83 |
3.08 |
14.68 |
-0.13 |
11.46 |
0.71 |
2.37 |
-2.51 |
2011-12 |
7.53 |
25.8 |
11.7 |
3.02 |
42.47 |
75 |
31.65 |
1.78 |
2.67 |
14.38 |
-0.35 |
11.36 |
0.48 |
2.19 |
-2.54 |
2012-13 |
7.43 |
23.9 |
11.8 |
2.82 |
39.93 |
83 |
33.32 |
1.67 |
2.24 |
14.05 |
-0.58 |
11.23 |
0.25 |
1.99 |
-2.57 |
2013-14 |
7.33 |
22.0 |
11.9 |
2.61 |
37.25 |
93 |
34.81 |
1.50 |
1.79 |
13.70 |
-0.82 |
11.09 |
0.00 |
1.79 |
-2.61 |
2014-15 |
7.23 |
20.0 |
12.0 |
2.41 |
37.18 |
105 |
38.92 |
4.10 |
4.39 |
16.41 |
1.98 |
14.00 |
0.00 |
4.39 |
-2.41 |
Scenario 51- Interest rate reduction by 0.1%, IP/RR reduction by 1.60%, Nominal GDP growth of 12% |
Year |
Int. Rate |
IP/ RR |
RR/ GDP |
IP/ GDP |
Debt/ GDP |
GDP
(Rs.Tri.) |
Debt (Rs.Tri) |
Dt-D(t-l) |
GFD/ GDP |
TE/ GDP |
PD |
PE |
CD/ GDP |
ID/ GDP |
PRB/ GDP |
1 |
2 |
3 |
4 |
5 =
3*4 |
6=
5/2 |
7 |
8=
(5*7)/2 |
9 |
10=
9/7 |
11 =
4+10 |
12=
10-5 |
13=
11-5 |
14 |
15 =
10-14 |
16=
14-5 |
2007-08 |
8.24 |
32.8 |
11.2 |
3.68 |
51.97 |
47 |
24.37 |
3.42 |
7.4 |
18.62 |
3.72 |
14.94 |
1.40 |
6.00 |
-2.28 |
2008-09 |
7.83 |
31.6 |
11.4 |
3.60 |
49.94 |
53 |
26.48 |
2.11 |
3.98 |
15.38 |
0.38 |
11.78 |
1.17 |
2.81 |
-2.43 |
2009-10 |
7.73 |
30.0 |
11.5 |
3.45 |
48.32 |
59 |
28.70 |
2.22 |
4.18 |
15.68 |
0.73 |
12.23 |
0.94 |
3.24 |
-2.51 |
2010-11 |
7.63 |
28.4 |
11.6 |
3.29 |
46.62 |
67 |
31.01 |
2.31 |
3.89 |
15.49 |
0.60 |
12.19 |
0.71 |
3.18 |
-2.58 |
2011-12 |
7.53 |
26.8 |
11.7 |
3.14 |
44.82 |
75 |
33.39 |
2.38 |
3.58 |
15.28 |
0.45 |
12.15 |
0.48 |
3.10 |
-2.66 |
2012-13 |
7.43 |
25.2 |
11.8 |
2.98 |
42.93 |
83 |
35.82 |
2.43 |
3.26 |
15.06 |
0.28 |
12.09 |
0.25 |
3.01 |
-2.73 |
2013-14 |
7.33 |
23.6 |
11.9 |
2.81 |
40.93 |
93 |
38.26 |
2.43 |
2.92 |
14.83 |
0.11 |
12.02 |
0.00 |
2.92 |
-2.81 |
2014-15 |
7.23 |
22.0 |
12.0 |
2.64 |
40.90 |
105 |
42.81 |
4.55 |
4.87 |
16.89 |
2.23 |
14.24 |
0.00 |
4.87 |
-2.64 |
Scenario 52- Interest rate based on forecast IP/RR reduction by 2.27%. Nominal GDP growth of 12% |
Year |
Int. Rate |
IP/ RR |
RR/ GDP |
IP/ GDP |
Debt/ GDP |
GDP
(Rs.Tri.) |
Debt
(Rs.Tri) |
Dt-D(t-l) |
GFD/ GDP |
TE/ GDP |
PD |
PE |
CD/ GDP |
ID/ GDP |
PRB/ GDP |
1 |
2 |
3 |
4 |
5 =
3*4 |
6=
5/2 |
7 |
8=
(5*7)/2 |
9 |
10=
9/7 |
11 =
4+10 |
12=
10-5 |
13=
11-5 |
14 |
15 =
10-14 |
16=
14-5 |
2007-08 |
8.24 |
32.8 |
11.2 |
3.68 |
51.97 |
47 |
24.37 |
3.42 |
7.4 |
18.62 |
3.72 |
14.94 |
1.40 |
6.00 |
-2.28 |
2008-09 |
7.83 |
31.6 |
11.4 |
3.60 |
48.32 |
53 |
25.62 |
1.25 |
2.36 |
13.75 |
-1.24 |
10.15 |
1.17 |
1.19 |
-2.43 |
2009-10 |
7.82 |
29.3 |
11.5 |
3.37 |
44.98 |
59 |
26.72 |
1.09 |
2.06 |
13.56 |
-1.31 |
10.19 |
0.94 |
1.12 |
-2.43 |
2010-11 |
7.81 |
27.1 |
11.6 |
3.14 |
42.05 |
67 |
27.97 |
1.26 |
2.12 |
13.71 |
-1.02 |
10.57 |
0.71 |
1.41 |
-2.43 |
2011-12 |
7.73 |
24.8 |
11.7 |
2.90 |
38.74 |
75 |
28.87 |
0.89 |
1.34 |
13.04 |
-1.56 |
10.14 |
0.48 |
0.86 |
-2.42 |
2012-13 |
7.69 |
22.5 |
11.8 |
2.66 |
35.20 |
83 |
29.37 |
0.51 |
0.68 |
12.49 |
-1.98 |
9.83 |
0.25 |
0.43 |
-2.41 |
2013-14 |
7.67 |
20.3 |
11.9 |
2.41 |
31.62 |
93 |
29.55 |
0.18 |
0.22 |
12.13 |
-2.20 |
9.72 |
0.00 |
0.22 |
-2.41 |
2014-15 |
7.65 |
18.0 |
12.0 |
2.16 |
31.62 |
105 |
33.10 |
3.55 |
3.80 |
15.81 |
1.63 |
13.65 |
0.00 |
3.80 |
-2.16 |
Scenario 53- Interest rate based on forecast,, IP/RR reduction by 1.93%, Nominal GDP growth of 12% |
Year |
Int. Rate |
IP/ RR |
RR/ GDP |
IP/ GDP |
Debt/ GDP |
GDP
(Rs.Tri.) |
Debt (Rs.Tri) |
Dt-D(t-l) |
GFD/ GDP |
TE/ GDP |
PD |
PE |
CD/ GDP |
ID/ GDP |
PRB/ GDP |
1 |
2 |
3 |
4 |
5 =
3*4 |
6=
5/2 |
7 |
8=
(5*7)/2 |
9 |
10=
9/7 |
11 =
4+10 |
12=
10-5 |
13=
11-5 |
14 |
15 =
10-14 |
16=
14-5 |
2007-08 |
8.24 |
32.8 |
11.2 |
3.68 |
51.97 |
47 |
24.37 |
3.42 |
7.4 |
18.62 |
3.72 |
14.94 |
1.40 |
6.00 |
-2.28 |
2008-09 |
7.83 |
31.6 |
11.4 |
3.60 |
48.88 |
53 |
25.92 |
1.55 |
2.92 |
14.31 |
-0.68 |
10.71 |
1.17 |
1.75 |
-2.43 |
2009-10 |
7.82 |
29.7 |
11.5 |
3.41 |
46.11 |
59 |
27.39 |
1.47 |
2.77 |
14.27 |
-0.64 |
10.86 |
0.94 |
1.83 |
-2.47 |
2010-11 |
7.81 |
27.7 |
11.6 |
3.22 |
43.78 |
67 |
29.12 |
1.74 |
2.92 |
14.52 |
-0.29 |
11.30 |
0.71 |
2.21 |
-2.51 |
2011-12 |
7.73 |
25.8 |
11.7 |
3.02 |
41.08 |
75 |
30.61 |
1.49 |
2.23 |
13.93 |
-0.79 |
10.91 |
0.48 |
1.75 |
-2.54 |
2012-13 |
7.69 |
23.9 |
11.8 |
2.82 |
38.16 |
83 |
31.84 |
1.23 |
1.65 |
13.46 |
-1.17 |
10.64 |
0.25 |
1.40 |
-2.57 |
2013-14 |
7.67 |
22.0 |
11.9 |
2.61 |
35.21 |
93 |
32.91 |
1.07 |
1.28 |
13.19 |
-1.33 |
10.58 |
0.00 |
1.28 |
-2.61 |
2014-15 |
7.65 |
20.0 |
12.0 |
2.41 |
35.14 |
105 |
36.78 |
3.87 |
4.14 |
16.16 |
1.74 |
13.75 |
0.00 |
4.14 |
-2.41 |
Scenario 54- Interest rate based on forecast, IP/RR reduction by 1.60%, Nominal GDP growth of 12% |
Year |
Int. Rate |
IP/ RR |
RR/ GDP |
IP/ GDP |
Debt/ GDP |
GDP
(Rs.Tri.) |
Debt (Rs.Tri) |
Dt-D(t-l) |
GFD/ GDP |
TE/ GDP |
PD |
PE |
CD/ GDP |
ID/ GDP |
PRB/ GDP |
1 |
2 |
3 |
4 |
5 =
3*4 |
6=
5/2 |
7 |
8=
(5*7)/2 |
9 |
10=
9/7 |
11 =
4+10 |
12=
10-5 |
13=
11-5 |
14 |
15 =
10-14 |
16=
14-5 |
2007-08 |
8.24 |
32.8 |
11.2 |
3.68 |
51.97 |
47 |
24.37 |
3.42 |
7.4 |
18.62 |
3.72 |
14.94 |
1.40 |
6.00 |
-2.28 |
2008-09 |
7.83 |
31.6 |
11.4 |
3.60 |
49.42 |
53 |
26.21 |
1.84 |
3.46 |
14.86 |
-0.14 |
11.26 |
1.17 |
2.29 |
-2.43 |
2009-10 |
7.82 |
30.0 |
11.5 |
3.45 |
47.21 |
59 |
28.04 |
1.83 |
3.46 |
14.95 |
0.01 |
11.50 |
0.94 |
2.52 |
-2.51 |
2010-11 |
7.81 |
28.4 |
11.6 |
3.29 |
45.46 |
67 |
30.24 |
2.20 |
3.71 |
15.30 |
0.41 |
12.01 |
0.71 |
3.00 |
-2.58 |
2011-12 |
7.73 |
26.8 |
11.7 |
3.14 |
43.36 |
75 |
32.30 |
2.06 |
3.10 |
14.80 |
-0.04 |
11.66 |
0.48 |
2.62 |
-2.66 |
2012-13 |
7.69 |
25.2 |
11.8 |
2.98 |
41.02 |
83 |
34.23 |
1.93 |
2.59 |
14.40 |
-0.38 |
11.42 |
0.25 |
2.34 |
-2.73 |
2013-14 |
7.67 |
23.6 |
11.9 |
2.81 |
38.69 |
93 |
36.16 |
1.93 |
2.31 |
14.22 |
-0.50 |
11.41 |
0.00 |
2.31 |
-2.81 |
2014-15 |
7.65 |
22.0 |
12.0 |
2.64 |
38.65 |
105 |
40.46 |
4.29 |
4.60 |
16.61 |
1.95 |
13.97 |
0.00 |
4.60 |
-2.64 |
Int. Rate: Interest Rate. IP: Interest Payments. RR: Revenue Receipts. GDP: Gross Domestic Product. GFD: Gross Fiscal Deficit. TE: Total Expenditure. PD: Primary Deficit. PE: Primary Expenditure. CD: Current Deficit. ID: Investment Deficit. PRB: Primary Revenue Balance. |
* Ravindra H. Dholakia is Professor at the Indian Institute of Management, Ahmedabad. Jeevan K. Khundrakpam is Director and Dhirendra Gajbhiye is Research Officer, Department of Economic Analysis and Policy, Reserve Bank of India, Mumbai.
1 It is, however, argued that some of the off-budget liabilities arising from the issue of oil bonds, fertilizer bonds and FCI bonds have mainly been done in order to keep the budget liabilities conform to the FRBM Act. Inclusion of these off-budget liabilities, which otherwise should legitimately form part of the budget, would therefore, significantly reduce the achievement of FRBM targets.
2 Even though there are no interest receipts from the MSS proceeds kept with the RBI, premiums/ discount on interest payments arises at the time of reissuance due to difference in the coupon rate. The borrowings under MSS directly impacts the debt sustainability of the Government and, therefore, requires to be included in the debt sustainability analysis.
3 Rangarajan and Srivastava (2003), however, point out that the off-budget liabilities do not form part of the outstanding liabilities reported in the Receipts Budget, but is captured by the outstanding liabilities reported by Comptroller and Auditor General.
4 For 2002-03 to 2004-05, the amount of debt swap was deducted from the special securities of States against small savings.
5 Fitting a trend on the discrepancies yield the following:
Discrepancies = -31096 + 8535* trend R-bar Square = 0.54; DW = 1.78
t-value– (-1.53) (4.5)
6 Fitting a trend on the discrepancies yield the following:
Discrepancies = 1305 - 203*trend R-bar Square = -0.05; DW = 2.14
t-value – (0.26) (-0.4)
7 There is a case for revising the current practices followed in E&FC by considering those expenditure that create assets for transfers to or partly for public use as capital /investment expenditure.
8 The regression result is as follows:
Log RR = -12.1 + 1.67 log Real GDP + 0.39 log GDP deflator R-bar Square = 0.997;
(-7.8) (3.6) DW = 2.09
|
 IST,
IST,