|
Today, the Reserve Bank released the results of January 2024 round of its bi-monthly consumer confidence survey (CCS)[1]. The survey collects current perceptions (vis-à-vis a year ago) and one year ahead expectations of households on general economic situation, employment scenario, overall price situation, own income and spending across 19 major cities. The latest round of the survey was conducted during January 2-11, 2024, covering 6,058 respondents. Female respondents accounted for 53.1 per cent of this sample.
Highlights:
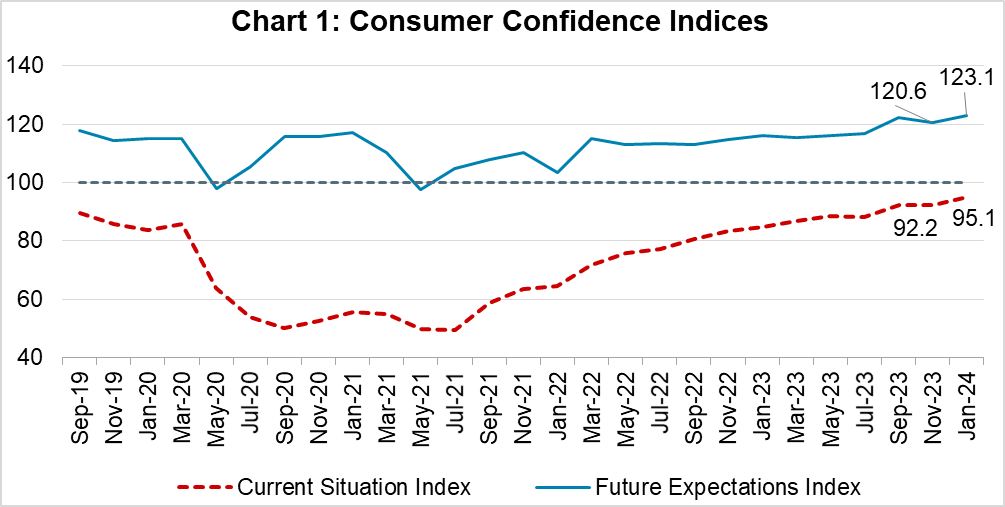
- Consumer confidence for the current period continued its recovery path on the back of respondents' improved assessment of current general economic situation and employment condition; the current situation index (CSI)[2] improved further to 95.1 in January 2024 from 92.2 in November 2023 (Chart 1; Tables 1 and 2).
- Going forward, households expect improvements in general economic and employment conditions to continue over the next one year. The confidence on future income conditions is, however, a shade lower vis-à-vis the previous survey round, following four successive rounds of improvements (Tables 1, 2 and 5).
-
The future expectations index (FEI) registered a new peak since the onset of the pandemic reflecting heightened consumer confidence (Chart 1).
Note: Please see the excel file for time series data[3]
|
Summary based on Net Responses[4]
|
|
Main Variables
|
Current Perception
compared with one-year ago
|
One year ahead Expectations compared with current situation
|
|
Nov-23
|
Jan-24
|
Change
|
Nov-23
|
Jan-24
|
Change
|
|
Economic Situation
|
-11.3
|
-2.7
|
|
25.7
|
33.7
|
|
|
Employment
|
-12.4
|
-6.0
|
|
26.9
|
34.7
|
|
|
Price Level
|
-89.9
|
-88.9
|
|
-72.3
|
-71.4
|
|
|
Income
|
4.5
|
4.2
|
|
51.8
|
49.4
|
|
|
Spending
|
70.1
|
68.6
|
|
70.9
|
69.2
|
|
|
Consumer Confidence
Index
|
92.2
|
95.1
|
|
120.6
|
123.1
|
|
|
|
Positive Sentiments with sign of improvement compared to last round
|
|
Negative Sentiments with sign of improvement compared to last round
|
|
|
Positive Sentiments with sign of deterioration compared to last round
|
|
Negative Sentiments with sign of deterioration compared to last round
|
|
|
Positive Sentiments with no change compared to last round |
|
Negative Sentiments with no change compared to last round
|
Table 1: Perceptions and Expectations on the General Economic Situation
|
(Percentage responses)
|
|
Survey Round
|
Current Perception
|
One year ahead Expectation
|
|
Increased
|
Remained Same
|
Decreased
|
Net Response
|
Will Increase
|
Will Remain Same
|
Will Decrease
|
Net Response
|
|
Jan-23
|
28.3
|
19.6
|
52.1
|
-23.7
|
50.2
|
16.6
|
33.2
|
17.0
|
|
Mar-23
|
31.4
|
16.9
|
51.7
|
-20.4
|
49.9
|
15.1
|
35.0
|
15.0
|
|
May-23
|
32.1
|
19.0
|
48.9
|
-16.8
|
51.0
|
15.8
|
33.2
|
17.8
|
|
Jul-23
|
30.4
|
18.5
|
51.1
|
-20.7
|
51.1
|
15.1
|
33.8
|
17.2
|
|
Sep-23
|
36.1
|
19.9
|
44.0
|
-7.9
|
56.8
|
15.1
|
28.1
|
28.6
|
|
Nov-23
|
33.1
|
22.5
|
44.4
|
-11.3
|
54.3
|
17.2
|
28.5
|
25.7
|
|
Jan-24
|
37.5
|
22.3
|
40.2
|
-2.7
|
59.2
|
15.3
|
25.5
|
33.7
|
Table 2: Perceptions and Expectations on Employment
|
(Percentage responses)
|
|
Survey Round
|
Current Perception
|
One year ahead Expectation
|
|
Increased
|
Remained Same
|
Decreased
|
Net Response
|
Will Increase
|
Will Remain Same
|
Will Decrease
|
Net Response
|
|
Jan-23
|
30.0
|
20.1
|
49.9
|
-19.9
|
51.8
|
18.0
|
30.2
|
21.6
|
|
Mar-23
|
32.2
|
19.9
|
47.9
|
-15.7
|
52.9
|
17.1
|
30.1
|
22.8
|
|
May-23
|
32.1
|
20.2
|
47.7
|
-15.6
|
52.1
|
18.7
|
29.2
|
22.9
|
|
Jul-23
|
30.8
|
21.0
|
48.2
|
-17.5
|
51.4
|
18.3
|
30.3
|
21.1
|
|
Sep-23
|
34.0
|
21.8
|
44.2
|
-10.2
|
55.8
|
18.1
|
26.2
|
29.6
|
|
Nov-23
|
32.3
|
23.0
|
44.7
|
-12.4
|
53.6
|
19.7
|
26.8
|
26.9
|
|
Jan-24
|
35.3
|
23.4
|
41.3
|
-6.0
|
58.7
|
17.4
|
24.0
|
34.7
|
Table 3: Perceptions and Expectations on Price Level
|
(Percentage responses)
|
|
Survey Round
|
Current Perception
|
One year ahead Expectation
|
|
Increased
|
Remained Same
|
Decreased
|
Net Response
|
Will Increase
|
Will Remain Same
|
Will Decrease
|
Net Response
|
|
Jan-23
|
93.6
|
5.0
|
1.3
|
-92.3
|
83.0
|
10.1
|
7.0
|
-76.1
|
|
Mar-23
|
93.8
|
5.2
|
1.0
|
-92.9
|
84.3
|
9.0
|
6.7
|
-77.5
|
|
May-23
|
92.2
|
6.4
|
1.4
|
-90.8
|
82.7
|
10.0
|
7.3
|
-75.4
|
|
Jul-23
|
92.7
|
6.0
|
1.3
|
-91.4
|
80.9
|
10.2
|
8.9
|
-72.0
|
|
Sep-23
|
91.8
|
6.4
|
1.8
|
-90.0
|
78.4
|
9.9
|
11.7
|
-66.8
|
|
Nov-23
|
91.3
|
7.3
|
1.4
|
-89.9
|
81.0
|
10.2
|
8.8
|
-72.3
|
|
Jan-24
|
90.8
|
7.2
|
2.0
|
-88.9
|
80.5
|
10.4
|
9.1
|
-71.4
|
Table 4: Perceptions and Expectations on Rate of Change in Price Level (Inflation)*
|
(Percentage responses)
|
|
Survey Round
|
Current Perception
|
One year ahead Expectation
|
|
Increased
|
Remained Same
|
Decreased
|
Net Response
|
Will Increase
|
Will Remain Same
|
Will Decrease
|
Net Response
|
|
Jan-23
|
86.5
|
10.5
|
3.0
|
-83.6
|
80.3
|
15.5
|
4.1
|
-76.2
|
|
Mar-23
|
86.5
|
10.0
|
3.5
|
-82.9
|
81.4
|
14.0
|
4.6
|
-76.8
|
|
May-23
|
84.0
|
12.5
|
3.4
|
-80.6
|
81.8
|
14.1
|
4.1
|
-77.8
|
|
Jul-23
|
84.5
|
11.8
|
3.7
|
-80.8
|
80.8
|
14.8
|
4.4
|
-76.4
|
|
Sep-23
|
82.5
|
13.4
|
4.2
|
-78.3
|
79.4
|
15.8
|
4.8
|
-74.6
|
|
Nov-23
|
81.8
|
13.6
|
4.6
|
-77.2
|
80.1
|
14.7
|
5.2
|
-75.0
|
|
Jan-24
|
79.5
|
15.7
|
4.8
|
-74.7
|
77.2
|
17.8
|
5.0
|
-72.2
|
|
*Applicable only for those respondents who felt price has increased/price will increase.
|
Table 5: Perceptions and Expectations on Income
|
(Percentage responses)
|
|
Survey Round
|
Current Perception
|
One year ahead Expectation
|
|
Increased
|
Remained Same
|
Decreased
|
Net Response
|
Will Increase
|
Will Remain Same
|
Will Decrease
|
Net Response
|
|
Jan-23
|
21.4
|
49.0
|
29.6
|
-8.3
|
54.5
|
38.7
|
6.9
|
47.6
|
|
Mar-23
|
22.2
|
49.7
|
28.1
|
-5.9
|
54.1
|
38.4
|
7.5
|
46.7
|
|
May-23
|
23.9
|
49.7
|
26.3
|
-2.4
|
53.8
|
39.4
|
6.9
|
46.9
|
|
Jul-23
|
25.4
|
49.9
|
24.8
|
0.6
|
54.7
|
38.6
|
6.7
|
48.0
|
|
Sep-23
|
25.0
|
49.8
|
25.2
|
-0.3
|
55.7
|
37.8
|
6.5
|
49.2
|
|
Nov-23
|
27.2
|
50.1
|
22.7
|
4.5
|
57.9
|
36.0
|
6.1
|
51.8
|
|
Jan-24
|
26.4
|
51.5
|
22.1
|
4.2
|
56.3
|
36.9
|
6.8
|
49.4
|
Table 6: Perceptions and Expectations on Spending
|
(Percentage responses)
|
|
Survey Round
|
Current Perception
|
One year ahead Expectation
|
|
Increased
|
Remained Same
|
Decreased
|
Net Response
|
Will Increase
|
Will Remain Same
|
Will Decrease
|
Net Response
|
|
Jan-23
|
73.9
|
20.6
|
5.5
|
68.4
|
75.5
|
19.8
|
4.7
|
70.8
|
|
Mar-23
|
75.0
|
19.6
|
5.4
|
69.6
|
75.4
|
19.9
|
4.6
|
70.8
|
|
May-23
|
73.4
|
21.3
|
5.3
|
68.1
|
73.8
|
21.7
|
4.6
|
69.2
|
|
Jul-23
|
74.5
|
20.5
|
5.0
|
69.6
|
73.8
|
21.3
|
4.8
|
69.0
|
|
Sep-23
|
74.6
|
20.2
|
5.2
|
69.4
|
75.2
|
20.3
|
4.6
|
70.6
|
|
Nov-23
|
74.8
|
20.6
|
4.6
|
70.1
|
75.0
|
21.0
|
4.1
|
70.9
|
|
Jan-24
|
73.2
|
22.3
|
4.5
|
68.6
|
74.2
|
20.9
|
5.0
|
69.2
|
Table 7: Perceptions and Expectations on Spending- Essential Items
|
(Percentage responses)
|
|
Survey Round
|
Current Perception
|
One year ahead Expectation
|
|
Increased
|
Remained Same
|
Decreased
|
Net Response
|
Will Increase
|
Will Remain Same
|
Will Decrease
|
Net Response
|
|
Jan-23
|
84.1
|
12.3
|
3.6
|
80.5
|
81.3
|
15.2
|
3.5
|
77.8
|
|
Mar-23
|
85.3
|
11.5
|
3.2
|
82.1
|
81.7
|
14.8
|
3.5
|
78.2
|
|
May-23
|
84.0
|
12.8
|
3.2
|
80.8
|
81.3
|
15.2
|
3.5
|
77.8
|
|
Jul-23
|
85.3
|
11.8
|
3.0
|
82.3
|
81.0
|
15.5
|
3.5
|
77.5
|
|
Sep-23
|
84.9
|
11.9
|
3.2
|
81.7
|
82.0
|
14.4
|
3.6
|
78.4
|
|
Nov-23
|
85.7
|
11.4
|
2.9
|
82.7
|
82.3
|
14.4
|
3.4
|
78.9
|
|
Jan-24
|
84.1
|
12.9
|
3.0
|
81.1
|
81.8
|
14.6
|
3.6
|
78.2
|
Table 8: Perceptions and Expectations on Spending- Non-Essential Items
|
(Percentage responses)
|
|
Survey Round
|
Current Perception
|
One year ahead Expectation
|
|
Increased
|
Remained Same
|
Decreased
|
Net Response
|
Will Increase
|
Will Remain Same
|
Will Decrease
|
Net Response
|
|
Jan-23
|
22.1
|
35.2
|
42.8
|
-20.7
|
31.9
|
38.4
|
29.8
|
2.1
|
|
Mar-23
|
25.2
|
34.8
|
40.0
|
-14.8
|
34.5
|
36.8
|
28.8
|
5.7
|
|
May-23
|
25.8
|
38.2
|
36.1
|
-10.3
|
35.3
|
37.5
|
27.2
|
8.2
|
|
Jul-23
|
26.6
|
36.9
|
36.5
|
-10.0
|
34.8
|
37.6
|
27.6
|
7.3
|
|
Sep-23
|
23.4
|
38.5
|
38.2
|
-14.8
|
33.0
|
38.2
|
28.8
|
4.2
|
|
Nov-23
|
25.2
|
36.6
|
38.2
|
-13.0
|
34.1
|
36.8
|
29.0
|
5.1
|
|
Jan-24
|
27.2
|
36.2
|
36.6
|
-9.4
|
34.6
|
36.4
|
29.0
|
5.5
|
*****
|
 IST,
IST,