 IST,
IST,


Developments in Cooperative Banking
The financial performances of Urban Cooperative Banks (UCBs) improved in 2010-11 though there are some concerns with regard to some of the UCBs reporting negative CRAR. Within the rural cooperative sector, State Cooperative Banks (StCBs) and District Central Cooperative Banks (DCCBs) reported profits but the ground level institutions, i.e., Primary Agricultural Credit Societies (PACS) continued incurring huge losses. The financial performance of long term cooperatives was found to be even weaker than their short term counterparts. Also, it was observed that the branch network of cooperatives, though widespread across the country, continued to be concentrated in certain regions. Moreover, the network of cooperatives was not broad based in the north-eastern region of the country. This suggests that efforts need to be taken to improve banking penetration in the north-eastern part of the country along with improving the financial health of the ground level cooperative institutions. 1. Introduction 5.1 Cooperative banking sector plays an important role by providing financial intermediation services to agricultural and allied activities, small scale industries and self employed workers. Since the network of cooperative banks is widespread across different parts of the country, these institutions are considered as a potential instrument to bring people from far-flung areas under the formal banking network. However, the poor financial health of cooperative banks in general, and grass root level cooperatives in particular remains as an impediment, which needs to be addressed in order to fully utilise the benefits of wide spread network of these institutions. Increased Interlinkages between UCBs and Commercial Banks 5.2 In recent years, the integration of cooperative banks with the financial sector has increased following the inclusion of UCBs in Indian Financial Network (INFINET) and Real Time Gross Settlement System (RTGS) from November 2010. Further the annual policy statement of the Reserve Bank for 2010-11 envisages inclusion of financially sound UCBs in the Negotiated Dealing System (NDS) and opening up of internet banking channel for UCBs satisfying certain criteria. This growing interconnectedness of cooperative sector with the commercial banking sector, however, raises the risk of contagion that may affect the financial system as a whole due to the weak financial position of these institutions. 5.3 The cooperative structure in India can broadly be divided into two segments. While the urban areas are served by Urban Cooperative Banks (UCBs), rural cooperatives operate in the rural parts of the country. As at end-March 2011, there were 1,645 UCBs operating in the country, of which majority were non-scheduled UCBs. Moreover, while majority of the UCBs were operating within a single State, there were 42 UCBs having operations in more than one State. 5.4 The rural cooperatives are divided into short term and long term structures. The structure of short term cooperatives sector comprises of State Cooperative Banks (StCBs) operating as apex level institutions in each state, District Central Cooperative Banks (DCCBs) operating at district level and the Primary Agricultural Credit Societies (PACS) operating at grass root level. Similarly, the long term cooperatives are the State Cooperative Agriculture and Rural Development Banks (SCARDBs) at State level and Primary Cooperative Agriculture and Rural Development Banks (PCARDBs) operating at district/block level (Chart V.1) 5.5 The banking related activities of UCBs are governed by the Reserve Bank, whereas the registration and management related activities are governed by the Registrar of Cooperative Societies (RCS) in case of UCBs operating in single State and Central RCS (CRCS) in case of multi-State UCBs. In case of rural cooperatives, the structure is even more complex with the Reserve Bank and the NABARD sharing the responsibility of regulating banking related activities and RCS regulating registration/ management related activities. However, efforts have been taken in recent years by the Reserve Bank to solve problems related to duality in control. This involved signing of Memorandum of Understanding (MoUs) with the Central/State Government apart from putting in place a forum called State Level Task Force on Co-operative Urban Banks (TAFCUB), for resolving issues related to duality in control. 5.6 Organised into five sections, this chapter provides an analysis of operations and performances of cooperative banks in India. Section 1 provides the introduction and a broad overview of the cooperative sector in India. Section 2 and 3 focus on the business operations and performances of UCBs for 2010-11 and rural cooperatives for 2009-10, respectively1. A detailed analysis of recent initiatives taken by NABARD for revival of rural cooperatives is presented in section 4. Section 5 delineates important observations emanating from the analysis presented in this chapter2.
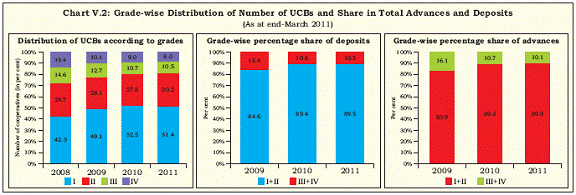
2. Urban Cooperative Banks3 Profile of UCBs Consolidation of UCBs through mergers/ acquisitions is in progress 5.7 UCBs play an important role by providing banking services to the wider sections of the society, especially in rural and semi urban areas. During the period 1991-2004 the UCB sector witnessed substantial growth possibly encouraged by the liberalised policy environment in post reform period. Alongside, a number of entities in the UCB sector became weak and unviable, eroding public confidence and posing systemic risk to the sector. Keeping in view the heterogeneity of this sector, the Reserve Bank proposed a multi-layered regulatory and supervisory approach specifically aimed at revival and strengthening of UCBs in its vision document for UCB sector, 2005. In the vision document the Reserve Bank proposed merger/amalgamation of viable entities within the sector and non-disruptive exit of the unviable ones. In the recent years there has been a decrease in total number of UCBs as an outcome of the ongoing consolidation process in this sector. Grade-wise Distribution of UCBs 5.8 UCBs are classified into four categories, viz., grade I, II, III and IV based on their financial performance in terms of certain parameters like CRAR, net NPAs and history of profit/loss. UCBs categorised as grade I and II are considered as financially stronger than that of grade III and IV. Share of banking business of UCBs of grade I and II witnessed an increase 5.9 As an outcome of the ongoing consolidation process of the UCB sector in the form of merger/ acquisition among financially viable banks and exit of the non-viable ones, there was a concentration of number of UCBs in grade I and II categories in recent years. The percentage of banks in grade I and II together constituted 82 per cent of total UCBs as at end-March 2011 compared to 80 per cent at end-March 2010. There was, however a marginal decline in the percentage of UCBs of grade I category in 2010- 11 as compared to the previous year. 5.10 The share of banking business also witnessed concentration in favour of financially sound UCBs in the recent past. This is evident from the fact that the UCBs of grade I and II witnessed an increase in their share in total deposits as well as advances in recent years. The shares of deposits and advances of UCBs in grade I and II together were 89.5 and 89.9 per cent of total deposits and advances of UCBs, respectively, at end-March 2011. Profile of UCBs-According to Asset Size wise and Business wise Concentration of business was witnessed in favour of larger UCBs 5.11 An analysis of performance of the UCB sector according to assets, deposits and advances size wise further confirmed that there was a concentration of business in favour of UCBs with larger asset size. The percentage share of banks with larger asset size (assets more than `25 crore) witnessed an increase in 2010-11 compared to previous year. Accordingly, percentage share of UCBs with asset size less than `25 crore declined during the same period. Also UCBs with larger asset base witnessed an increase in their share in total assets (Chart V.3).
Box V.1: Merger and Amalgamation of Urban Cooperative Banks The consolidation of the UCBs through the process of merger of weak entities with stronger ones has been set in motion through transparent and objective guidelines issued in February 2005. Though mergers/amalgamations of UCBs come within the purview of concerned State Government, prior approval from the Reserve Bank is required for obtaining No Objection Certificate (NOC). The Reserve Bank, while considering proposals for merger/amalgamation, confines its approval to the financial aspects of the merger taking into consideration the interests of depositors and post-merger financial stability of the acquirer bank. The financial parameters of the acquirer bank post merger must conform to the prescribed minimum prudential and regulatory requirements invariably for the merger cases. In addition to the guidelines issued in February 2005, the Reserve Bank issued another set of guidelines in January 2009 for merger/acquisition of UCBs having negative net worth as on end-March 2007. According to the new guidelines, the Reserve Bank would also consider scheme of amalgamation that provides for (i) payment to the depositors under section 16(2) of the Deposit Insurance and Credit Guarantee Corporation Act, 1961; (ii) financial contribution by the transferee bank; and (iii) sacrifice by large depositors. The process of merger/amalgamation requires the acquirer bank to submit the proposal alongwith some specified information to RCS/ CRCS and the Reserve Bank. The Reserve Bank examines the pros and cons of the merger scheme and places the same before an expert group for further screening and recommendations. If the proposal is found to be suitable Reserve Bank issues no objection certificate (NOC) to the concerned cooperative/RCS/CRCS. Pursuant to the issue of guidelines on merger of UCBs, the Reserve Bank received 158 proposals for merger of which the Reserve Bank has issued NOC to 120 proposals as on end-June 2011(Table 1.1). The RCS notified 95 mergers comprising 8 grade I, 4 grade II, 17 grade III and 66 grade IV UCBs. The year wise progress of merger/acquisition is presented in Table 1.1.
Out of the 95 mergers reported so far, 59 comprised of UCBs having negative net worth. The maximum number of mergers took place in the State of Maharashtra (58), followed by Gujarat (16) and Andhra Pradesh (10). Details about State wise progress in mergers/acquisitions are furnished in Table 1.2.
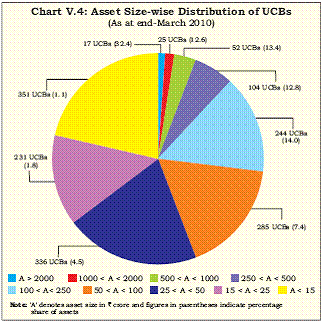
5.12 As at end-March 2011, UCBs with assetsize more than `500 crore constituted almost 6 asset-size per cent of total number of UCBs while the same category of UCBs accounted for a share of 59 per cent of the total assets of the sector. UCBs with medium asset size (`100 crore-`500 crore) had a share of 21 per cent of total number of UCBs and 27 per cent of total assets size. Accordingly, the remaining share of 14 per cent of total assets was attributable to UCBs with smaller asset size (`15 crore-`100 crore), which accounted for almost 73 per cent of total number of UCBs (Chart V.4). 5.13 An analysis of deposits and advances basewise distribution of UCBs revealed that banking business was predominantly concentrated in favour of larger UCBs. UCBs with larger deposit base (more than or equal to `500 crore), though accounted for only 4 per cent of total number of UCBs, contributed almost 53 per cent of total deposits. Similarly, only 3 per cent of total number of UCBs had advances base of more than `500 crore, but they accounted for almost 47 per cent of total advances disbursed in 2010-11 (Table V.2). Tier-wise Profile of UCBs Number of tier I banks reduced as compared with the previous year 5.14 Apart from grade-wise classification, UCBs are classified into two categories, viz., tier I and tier II for regulatory purposes. All UCBs following the below stated criteria4 are classified as tier I banks where as all other banks are classified as tier II banks.
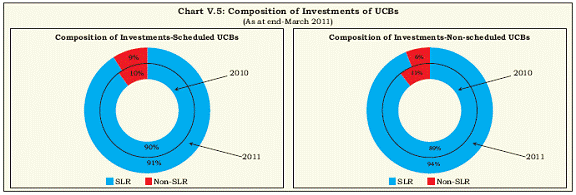
I. Banks having deposits below `100 crore operating in a single district. II. Banks with deposits below `100 crore operating in more than one district provided the branches are in contiguous districts and, deposits and advances of branches in one district separately constitute at least 95 per cent of the total deposits and advances, respectively of the bank. III. Banks with deposits below `100 crore, whose branches were originally in a single district but subsequently became multi-district due to reorganisation of the district. 5.15 There was an increase in the number of tier II banks while number of tier I banks reduced as at end-March 2011 as compared to the previous year. As at end-March 2011 tier I banks accounted for more than three fourths of total number of UCBs. As against this their shares in total deposits as well as advances were less than 20 per cent. Tier II banks, though constituted less than one fourth of total number of banks, accounted for majority share of advances and deposits. Similarly, the distribution of total assets was also heavily skewed in favour of tier II banks with these banks accounting for almost 81 per cent of total assets of the UCB sector (Table V.3). Balance Sheet Operations of UCBs Balance sheet of UCBs expanded mainly on account of growth in borrowings as well as loans and advances 5.16 Balance sheet of UCBs expanded at a rate of 15 per cent at end-March 2011 over the previous year. This expansion in balance sheet was largely attributed to borrowings on the liabilities side and loans and advances on the assets side. Non-scheduled UCBs witnessed expansion of their balance sheet at a higher rate than their scheduled counterparts. 5.17 As at end-March 2011, share of deposits in total liabilities was 78 per cent implying that UCBs are heavily dependent on deposits for resources. The share of deposits in total liabilities increased marginally in 2010-11 as compared to the previous year. Capital and reserves together constituted almost 12 per cent of total liabilities in 2010-11. On the assets side, loans and advances constituted almost half of total assets followed by investments and balances with banks (Table V.4). Investment Activities of Urban Cooperative Banks SLR instruments continued to account for a major part of total investments 5.18 The growth in total investments of UCBs moderated in 2010-11 as compared to the previous year. While total investments in SLR securities continued to increase, there was a decline in investments made in non-SLR instruments in 2010-11. 5.19 As at end-March 2011, almost 93 per cent of total investments of UCBs were in SLR instruments. Investments in Central and State Governments securities constituted almost 77 per cent of total SLR investments. Further, investments in term deposits with StCBs and DCCBs constituted almost one fifth of total SLR investments of UCBs in 2010-11. There was also a change in the composition of SLR investments in 2010-11 with UCBs shifting their investments from term deposits with StCBs and DCCBs to Central and State Government securities and other approved securities (Table V.5). 5.20 The non-scheduled UCBs witnessed a higher growth in SLR investments as compared to their scheduled counterparts. Both these groups witnessed a decline in their non- SLR investments. The scheduled UCBs, however, continued to have a higher proportion of their total investments in non-SLR instruments as compared to non-scheduled UCBs (Chart V.5).
Financial Performance of UCBs Net profits of the UCB sector improved due to growth in income 5.21 Net profits of the UCB sector improved substantially during 2010-11 as compared to the previous year when this sector witnessed a slowdown in net profits possibly due to the spillover effects of global financial crisis. This increase in profits was primarily attributable to a robust growth in income surpassing the growth in expenditure, thus improving the overall financial position of this sector. In case of non scheduled UCBs, which witnessed their expenditure growing at a higher rate than income, the increase in profits was mainly attributable to a fall in provisions and contingencies, taxes and staff expenses (Table V.6). 5.22 All the major items of the profit and loss account of the UCB sector witnessed positive growth during 2010-11. Return on assets and net interest margin improved for the sector as a whole owing to a significant increase in net profits. Bank wise data of RoA revealed that majority of banks were reporting RoA in the range of 0-1.5 per cent (Table V.7 and Chart V.7). Financial Soundness of UCBs Asset Quality Gross NPAs increased, though there was a decline in both gross as well as net NPA ratios 5.23 The gross non-performing assets (GNPAs) of UCB sector increased during the period 2010- 11 over the previous year. However, there was a decline in gross as well as net NPA ratios during 2010-11 implying improvement in asset quality for the UCB sector. Along with the improvement in gross and net NPA ratios there was also an increase in the provisioning coverage ratio of the sector (Table V.8).
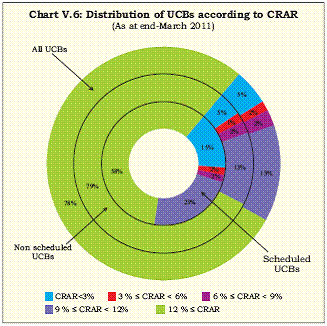
Capital Adequacy Majority of UCBs reported CRAR more than 9 per cent 5.24 As at end-March 2011, almost 90 per cent of the UCBs were found to have a CRAR of more than 9 per cent. However, it was found that almost 20 per cent of the scheduled UCBs failed to comply with the prescribed minimum CRAR of 9 per cent whereas their nonscheduled counterparts performed better in terms of capital adequacy with only 8 per cent of them reporting CRAR below the prescribed limit (Chart V.6). 5.25 An analysis of bank wise CRAR data revealed that most of the UCBs with CRAR less than 9 per cent actually reported negative CRAR. The dismal financial performances of these banks were also visible with some of them reporting negative RoA (Chart V.7).
Priority Sector Advances UCBs’ advances to priority sectors constituted almost 46 per cent of total advances 5.26 UCBs play an important role in providing adequate and timely credit to small and weaker sections of the society. The priority sector lending target for UCBs was set at 40 per cent of adjusted bank credit or credit equivalent amount of off-balance sheet exposure, whichever is higher, as on 31st March of the previous year5. 5.27 As at end-March 2011, advances to priority sectors by the UCBs constituted almost 46 per cent of their total advances disbursed by them. A further breakup of total priority sector advances revealed that small enterprises and housing loans constituted almost 59 per cent and 26 per cent, respectively, of total priority sector advances. The share of agriculture under priority sector in total advances declined in 2011 as compared to the previous year (Chart V.8). 5.28 As at end-March 2011, almost 14 per cent of total advances of UCBs were disbursed to weaker sections6 of which more than 60 per cent was absorbed by small enterprises. The advances to weaker sections constituted almost 30 percent of total priority sector advances as at end-March 2011 (Table V.9).
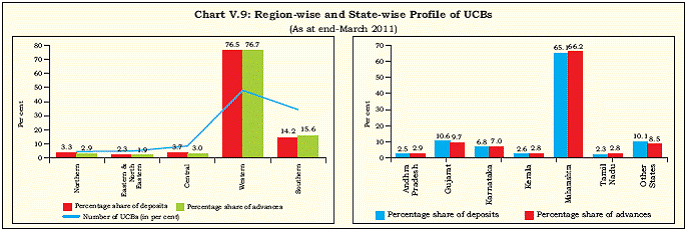
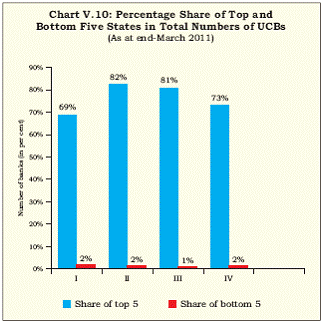
Geographical Spread of UCBs UCBs continued to be concentrated in the western region 5.29 An analysis of the State-wise data on number of UCBs as well as advances and deposits revealed that UCBs continued to remain concentrated in terms of number as well as banking business in the western part of the country. As at end-March 2011, almost 48 per cent of the total UCBs were located in the western States followed by southern States accounting for 34 per cent of total UCBs. The concentration was, however, more skewed when considered in terms of banking business with more than three fourths of total deposits as well as advances attributed to western region. Southern states accounted for 14 and 16 per cent of total deposits and advances, respectively. Accordingly, the banking business of UCBs was very shallow in other parts of the country, particularly in eastern and north-eastern regions. (Chart V.9) 5.30 The State-wise data on deposits and advances further revealed that within the regions also there was a concentration of banking business in some of the States. The share of Maharashtra, Gujarat, Karnataka, Andhra Pradesh, Kerala and Tamil Nadu together in total deposits as well as advances of the UCBs was close to 90 per cent. Maharashtra alone accounted for more than 65 per cent of the banking business of UCBs followed by Gujarat and Karnataka. 5.31 For a comparative analysis among different grades of UCBs according to level of geographical concentration, a comparison has been done between the share of top five States and bottom five States according to the number of UCBs. From the analysis it can be concluded that the level of concentration in terms of geographical presence was comparatively less in grade I UCBs followed by grade II/III and grade IV (Chart V.10).
3. Rural Cooperatives7 Financial performance of long term cooperatives was relatively weak 5.32 As at end-March 2010, there were a total 95,765 rural cooperative institutions operating in the country. Out of the total number of rural cooperatives, short term cooperatives constituted a majority while only one per cent of the total cooperatives operating in the country were long term in nature. Within the short term structure, StCBs and DCCBs reported profits, whereas the ground level institutions, PACS incurred huge losses. The financial positions of long term cooperatives were found to be weaker than the short term cooperatives with both SCARDBs and PCARDBs reporting losses as at end-March 2010. 5.33 StCBs and the DCCBs were heavily dependent on deposits for resources whereas borrowings constituted a major part of total assets in case of PACS, SCARDBs and PCARDBs. Out of the total loans and advances issued by the rural cooperatives, DCCBs accounted for almost 47 per cent followed by PACS and StCBs. The share of long term cooperatives in total loans and advances stood at less than 3 per cent, thus indicating the dominance of short term structure in rural credit disbursement. The short term cooperatives (except PACS) were found to be better placed as compared to their long term counterparts in terms of asset quality and recovery performance. The NPA ratio was found to be higher in case of long term cooperatives. Within the short term structure, the PACS, however, reported highest NPA ratio, indicating poor asset quality of these grass root level cooperatives (Table V.10).
Management of Cooperatives Almost one third of total rural cooperatives’ boards under supersession 5.34 As at end-March 2010, almost one third of total rural cooperative credit institutions (excluding PACS) had their boards under supersession. Among various types of rural cooperatives SCARDBs witnessed the highest percentage of boards under supersession (Table V.11). Short-term Structure of Rural Cooperatives 5.35 The short term structure of rural cooperatives comprises of StCBs operating as the apex institutions in each State, DCCBs operating at the district level and PACS operating at a more granular level. While StCBs and DCCBs witnessed fall in their net profits, PACS continued to incur losses. The NPA ratio, however, decelerated for StCBs and DCCBs at end-March 2010 as compared to the previous year. State Cooperative Banks Growth of StCBs’ balance sheet decelerated in 2009-10 as compared to previous year 5.36 The balance sheet of StCBs expanded at a rate close to 12 per cent during 2009-10, which was lower than the growth observed during 2008-09. The growth in StCB’s balance sheet was mainly due to increase in borrowings and other liabilities on the liabilities side, and cash and bank balances, and other assets on the assets side. On the liabilities side, deposits continued to account for the largest share of the resources of StCBs, while investment accounted for the almost 45 per cent of total assets. During 2009-10, investments increased at a higher rate than loans and advances. Also, the percentage share of investments in total assets increased with a decline in the share of loans and advances as at end- March 2010 as compared to the previous year (Table V.12).
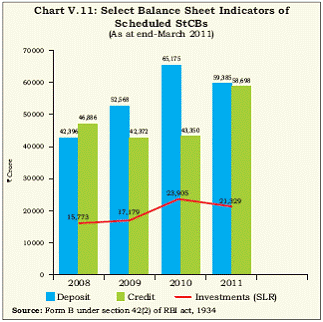
5.37 From the updated information on major balance sheet indicators of scheduled StCBs available in Section 42(2) returns, it was observed that deposits declined significantly in 2010-11 as compared to the previous year. In contrast, there was substantial increase in total credit disbursed in 2010-11. Investments in SLR instruments by StCBs declined in 2010-11 as compared to the previous year (Chart V.11). StCBs’ profits decreased mainly on account of slower growth in income 5.38 Net profits of StCBs decreased in 2009-10 as compared to the previous year. This fall in profit was mainly attributed to a slower growth of income during 2009-10 as compared to the previous year. There was also a change discernable in the composition of total income of the StCBs for last two years with the share of their non-interest income in total income increasing continuously. The trend continued in 2009-10 with non-interest income growing at a significantly higher rate than interest income. Nonetheless, interest income accounted for almost 95 per cent of StCBs total income in 2010.
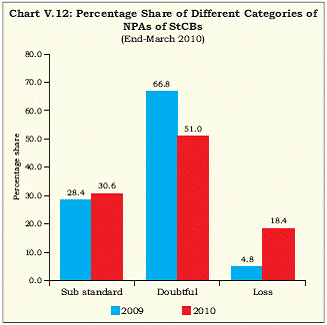
5.39 On the expenditure side, interest expenditure continued to account for more than three fourths of total expenses. Total wage bill increased substantially though there was a fall in total operating expenses in 2009-10 as compared to the previous year. Provisions and contingencies also declined in 2009-10 (Table V.13) NPA ratio declined for StCBs though there was a sharp increase in ‘loss’ NPAs 5.40 The asset quality of StCBs improved as at end-March 2010 over the previous year with their NPAs declining both in absolute as well as percentage terms. Analysis of various categories of NPAs further revealed that the decline in NPA was mainly on account of a decline in sub-standard and doubtful assets while there was a steep increase in loss assets in 2009-10 as compared to previous year (Table V.14). 5.41 The percentage share of ‘sub-standard’ and ‘loss’ categories of NPAs in total NPAs increased in 2009-10 as compared to the previous year though there was a decline in the percentage share of ‘doubtful’ NPAs during the same period (Chart V.12).
District Central Cooperative Banks Investments grew at a higher rate than loans and advances 5.42 During 2009-10 the balance sheet of DCCBs witnessed expansion at a rate close to 12 per cent, which was attributable to growth in deposits and ‘other’ liabilities on the liabilities side and investments on the assets side, though growth in investments decelerated as compared to 2008-09. 5.43 Deposits accounted for almost two thirds of total liabilities of DCCBs in 2009-10, indicating their heavy dependence on deposits for funds. Alongside, there was a decline in the percentage share of capitals and reserves in total liabilities. 5.44 On the assets side, loans and advances constituted almost half of the total assets whereas investments accounted for almost one third of the same. During 2009-10, loans and advances increased as compared to a decline in 2008-09. However, the higher growth in investments as compared with the growth of loans and advances during 2009-10 indicated DCCBs’ continued preference for investments rather than lending due to reduction in risk appetite following increased downward risk to domestic growth emanating from global economic uncertainties (Table V.15).
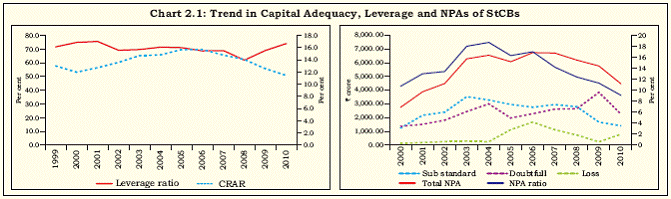
Net profits of DCCBs’ declined mainly due to increase in operating expenses 5.45 The overall financial performance of DCCBs deteriorated during 2009-10 with their net profits declining substantially. This is in contrast with the improved financial performance of these institutions in the previous year when DCCBs started reporting overall profits as compared to losses prior to that. 5.46 An analysis of different components of the profit and loss account of DCCBs suggested that the deceleration of profits was mainly on account of increase in operating expenses. Interest expended continued to account for a majority share of total expenses of DCCBs with the same increasing at a higher rate than interest income of DCCBs during 2009-10. Interest income, which is the major component of income for DCCBs, increased at a significantly slower rate in 2009-10 as compared to 2008-09 (Table V.16). Asset quality of DCCBs’ improved with fall in NPA ratio 5.47 The asset quality of DCCBs improved as at end-March 2010 continuing the trend of the previous year. Total NPAs as well as the NPA ratio declined as at end-March 2010 as compared to the previous year. Similar to StCBs, there was an increase in the percentage share of loss assets in total NPAs of DCCBs with a subsequent decline in percentage shares of doubtful and sub-standard assets. Substandard assets continued to account for major part of total NPAs followed by doubtful assets. The recovery performance of DCCBs also improved at end-March 2010 compared to previous year (Table V.17). Box V.2: Soundness of StCBs A trend analysis StCBs are the apex institutions in the short term structure of rural cooperatives. Hence the financial health of StCBs has strong influence on the overall financial health of short term rural cooperatives. Particularly, given the fact that the ground level cooperatives or PACS incurred huge losses in recent years, StCBs’ ability to provide assistance to PACS depends on the financial soundness of their own. Since data on risk weighted asset is not available for rural cooperatives, it was not possible to measure the capital to risk weighted asset ratio (CRAR) for StCBs. However, a rough measure of capital adequacy for StCBs has been taken as ratio of capital and reserves to investments and advances. This ratio stood at the range of 12-15 per cent in recent years, but showed some amount of deceleration in last two years (Chart 2.1). However, the leverage ratio8 for StCBs was found to be very high in recent years. The high leverage ratio of StCBs remains as a cause of concern for rural cooperative sector and also limits their ability to provide further assistance to ground level institutions. There has been a continuous decline in the NPA of StCBs since 2006, both at absolute as well as in percentage terms. This fall was due to reduction in NPAs under the three major categories, though ‘loss’ category increased in 2009-10. Despite this, the NPA ratio for StCBs remained high when compared with the commercial banks. Another important trend observed in the composition of NPAs of StCBs during 2005-09 is that while share of ‘sub-standard’ NPAs in total NPA came down, there was an increase in percentage share of ‘doubtful’ NPAs in total NPA, though the same again decelerated in 2010. The increase in percentage share of ‘doubtful’ NPAs in total NPA during 2005-09 indicated that NPA of StCBs has become stickier in recent years. The provision coverage ratio for StCBs exhibited an increasing trend from 2007 onwards. More importantly, there was a steep increase in the provision coverage ratio of StCBs in the year 2010 as compared to the previous year. Resilience of StCBs-a stress test for increase in credit risk Due to unavailability of data, it was not possible to conduct a stress test at bank level for StCBs. However, to analyse the resilience of StCBs with respect to increased credit risk a stress test has been conducted at system’s level. The stress test assumes increase in gross NPAs of StCBs by 100, 200 and 300 per cent along with the increased provisioning requirement of 25 per cent in case of sub-standard assets and 100 per cent for doubtful as well as loss assets. It was assumed that the ratio of different categories of NPAs remained the same under all the three scenarios. The increased provisioning requirement was first adjusted from the operating profits of StCBs and then the residual provisioning requirements, if any, was further subtracted from the capital. Due to unavailability of risk weighted assets for StCBs, CRAR under the stress is calculated as ratio of capital (after adjusting for the provisioning requirements) and reserves to investments and advances. A risk weight of zero per cent was assumed for investments in SLR instruments by StCBs (obtained from data collected from form B, sec 42(2) of RBI act). The following table summarises the stress test results.
The result of the stress test revealed that an unexpected increase in the NPA level would affect the CRAR of StCBs at system level significantly, with the CRAR level falling significantly under the three stress scenarios as mentioned above.
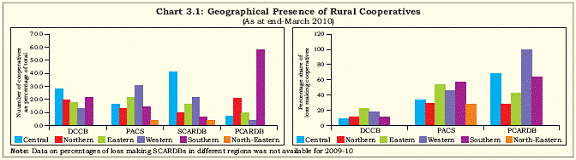
Primary Agricultural Credit Societies (PACS) 5.48 Primary Agricultural Credit Societies (PACS) continued to play an important role in providing institutional credit to agricultural and rural sectors. PACS are an integral part of short term rural credit cooperatives, which work at a grass root level and provide short term crop loans and other working capital loans to farmers and rural artisans. Total advances disbursed by PACS increased at a rate of 28 per cent 5.49 The balance sheet operations of PACS expanded significantly during 2009-10 over the previous year. Total working capital of PACS increased as at end-March 2010 mainly on account of increase in deposits. Borrowings constituted more than half of the total resources of PACS in the year 2009-10, indicating their heavy reliance on external sources for funding. Total loans disbursed by PACS increased by almost 28 per cent during the year 2009-10. Short term loans, which continued to constitute more than 80 per cent of total loans issued by PACS witnessed higher growth than medium term loans during the year 2009-10 (Table V.18). Almost 43 per cent of the PACS reported losses 5.50 Analysis of financial performance of PACS showed that almost 43 per cent of total PACS operating all over the country were loss making entities whereas 5 per cent of total number of PACS were either dormant or defunct indicating weak financial performance of these institutions in general. However, almost 70 per cent of total PACS were classified as viable and another 23 per cent of total numbers of PACS were classified as potentially viable as at end-March 2010. Long-Term Structure of Rural Cooperatives 5.51 The long term structure of rural cooperatives consists of SCARDBs operating at the State level and PCARDBs operating at district/block level. Both SCARDBs and PCARDBs reported net losses in 2009-10. Moreover, these institutions witnessed increase in their gross NPAs in 2009-10 though the NPA ratio marginally declined for PCARDBs. State Cooperative Agriculture and Rural Development Banks (SCARDBs) Borrowings reduced while capital and reserves together increased their share in total liabilities of SCARDBs 5.52 Total assets/liabilities of SCARDBs registered a moderate growth of 0.7 per cent in 2009-10 as compared to 2.5 per cent in 2008- 09. On the liabilities side, borrowing, which is the major source of funds for SCARDBs registered a negative growth during 2009-10. The other important items on liabilities side, i.e., net owned funds (capital and reserves) and deposits, however, increased during the same period. 5.53 On the assets side, loans and advances accounted for almost two thirds of total assets, as at end-March 2010. Another major component of total assets, i.e., ‘other assets’ declined in 2010. Though the growth in investments slowed down in 2009-10 as compared to the previous year, the same continued to grow at a higher rate than loans and advances in 2009-10 (Table V.19). SCARDBs reported net losses as compared to net profits in previous year 5.54 SCARDBs witnessed a sharp deterioration in their financial performance during 2009-10. This is evident from the fact that SCARDBs reported net losses during 2009-10 as compared to profits during 2008-09. Deterioration in their financial performances can be attributed to sharp fall in interest income on one side, and significant rise in operating expenses, including wage expenses on the other side. Though there was a steep decline in provisions and contingencies and also marginal decline in interest expended, this could not, however compensate for the decline in income by almost one third of its amount in 2008-09 (Table V.20). Alongwith decline in profits, NPA ratio also increased for SCARDBs 5.55 With significant fall in profitability, SCARDBs also witnessed increase in their NPAs during 2009-10. Within the various categories of NPAs, there was an increase in ‘sub-standard’ as well as ‘doubtful’ categories of NPAs while ‘loss’ NPAs declined. ‘Sub-standard’ NPAs continued to account for a majority share of total NPAs followed by ‘doubtful’ and ‘loss’ categories. The recovery performance of SCARDBs, however, improved, at end-March 2010 as compared to the previous year (Table V.21). Primary Cooperative Agriculture and Rural Development Banks (PCARDBs) PCARDBs’ balance sheet grew at a lower rate in 2009-10 5.56 The growth of balance sheet of PCARDBs moderated in 2009-10 as compared to the previous year mainly on account of contraction in ‘other’ assets and liabilities and also slower growth in two major components of their balance sheet i.e., borrowings as well as loans and advances. As at end-March 2010, borrowings constituted more than half of total resources of PCARDBs where as capital and reserves together constituted almost 21 per cent of the same. On the assets side, the share of ‘other’ assets was maximum followed by loans and advances, and investments. Investments grew at a higher rate than loans and advances during 2009-10 (Table V.22). Losses incurred by PCARDB’s increased followed by sharp increase in staff expenses 5.57 Financial performance of PCARDBs deteriorated with the amount of losses increasing in 2009-10 as compared to the previous year. There was an overall fall in income of PCARDBs owing to fall in both interest as well as non-interest income. On the expenditure side, there was steep increase in staff expenses as well as provisions and contingencies. It is, however, worth mentioning that PCARDBs reported operating profits at end-March 2010, but due to high provisioning and contingencies reported net losses (Table V.23). NPA ratio of PCARDBs declined marginally 5.58 Total NPAs of PCARDBs increased in absolute terms for PCARDBs as at end-March 2010 as compared to the previous year. There was, however, a marginal decline in NPA ratio of PCARDBs during the same period. Among various types of NPAs, there was a significant increase in doubtful NPAs while sub-standard and loss NPAs decreased as at end-March 2010. The recovery performance of PCARDBs improved as at end-March 2010 as compared to the previous year (Table V.24). 4. Role of NABARD in Reviving the Rural Cooperatives 5.59 NABARD plays a pivotal role in disbursing credit to rural cooperatives and regional rural banks (RRBs). The short term credit provided by NABARD to cooperatives is mainly used for financing seasonal agricultural activities, marketing of crops, and pisciculture activities. The medium term credit is used for financing other approved agricultural purposes and the long-term credit involves loans given to State Governments. Credit to StCBs constituted almost 70 per cent of total credit extended by NABARD 5.60 During 2010-11, the total amount of credit disbursed by NABARD increased significantly as compared to the previous year. A majority of total loans disbursed by NABARD in 2010-11 was in the form of short term credit extended to StCBs and RRBs. Out of the total credit disbursed by NABARD in 2010-11, StCBs absorbed almost 70 per cent while RRBs accounted for almost 29 per cent and the long term credit extended to the State Governments constituted less than one per cent. The credit extended to StCBs and RRBs increased significantly during 2010-11 as compared to the previous year while there was a decrease in long term credit extended to the State Governments (Table V.25). Progress under Rural Infrastructure Development Fund (RIDF) and Kisan credit Card (KCC) Scheme 5.61 RIDF was set up as a joint initiative by the Central Government and NABARD in order to develop infrastructure in rural areas, particularly in the backdrop of declining public investments in agriculture and rural sectors. The scheme of RIDF was first introduced in the annual budget of 1995-96. The fund under RIDF scheme was collected from commercial banks to the extent of their respective shortfalls from priority sector lending target for agriculture. Box V.3: Role of Rural Cooperatives in Financial Inclusion - Some Emerging Issues The wide network of rural cooperatives spread across the country is considered as a potential instrument to reach out the marginalised and poor sections of the society. In this context a comparative analysis of the geographical spread as well as banking business undertaken by rural cooperatives across different regions of the country is necessary. Region wise data on operations and performances of rural cooperatives revealed that while the StCBs, which are the nodal institutions in short term structure of rural cooperatives are present in every State the DCCBs are heavily concentrated in central and southern regions of the country. The banking network of DCCBs were found to be shallow in western and eastern regions of the country while there is no DCCB in northeastern region. Not only a fewer number of DCCBs have presence in western and eastern parts of the country, the percentage of loss making entities are also observed to be higher in these two regions. On the other hand, PACS, the ground level institutions within short term rural cooperatives are concentrated in western and eastern parts of the country. Among various regions, the percentage share of loss making PACS in total number of PACS operating is highest in southern region of the country. Within the short term credit structure, SCARDBs are concentrated in central regions while more than 60 per cent of total PCARDBs are located in southern region of the country. Notably, the number of PCARDBs operating in western region is very few and also almost all of the entities in western region were loss making, as at end-March 2010 (Chart 3.1). From the region wise data of rural cooperatives it can be concluded that the network of these institutions, though widespread are not uniformly present across different parts of the country. More importantly, the network of rural cooperatives was found to be significantly weak in northeastern region of the country, thus limiting the potential of these institutions for financial inclusion. Also, StCBs witnessed their highest NPA ratio in the north-eastern region of the country (Appendix table V.4).As at end-March 2010, only 4 per cent of total PACS were operating in north-eastern region. SCARDBs operating in north-eastern region also witnessed NPA ratio close to 50 per cent. The low number of rural cooperatives operating in north-eastern region as well as their poor financial performance remains as a concern. As at end-March 2010, financial performances of DCCBs, SCARDBs and PCARDBs deteriorated. The fall in profits of these cooperatives could be attributed to increasing operating expenses. Rising operating expenses of these cooperatives indicate operational inefficiencies. This suggest that a comprehensive planning to streamline the business activities and human resource development initiatives is required in this regard. Also computerization of PACS, which has already started in some of the States, needs further impetus and PACS operating in other states should also start adopting the same. The process of adoption of Common accounting System (CAS) and Management Information System (MIS) for PACS should further become broad based. The application of modern technology in business activities is expected to improve the efficiency of rural cooperatives to wider extent. However, proper training and orientation programme is needed for the employees of these institutions in order to familiarize them with the new technology. Since only members can borrow from PACS, there is a need to increase membership per PACS to further utilize the effectiveness of the wide network of these grass root level institutions. As at end-March 2010, the number of members per PAC decreased to 1336 from 1384 at end-March 2009. Further the membership per PAC was found to be low in western and central region. Also, borrowers per PAC were low in north-eastern, western and central regions of the country (Table 3.1). Though the highest percentages of PACS were operating in western region of the county, effort is needed to increase members per PAC for western region as well as for all-India level. The percentage of overdues to demand was found to be very high for PACS operating at north-eastern and western regions in particular and at all-India level in general. As at end-March 2010, the percentage of overdues reduced marginally compared to the previous year at all-India level, but the same further increased for PACS operating in north-eastern region. High overdues are a serious problem for PACS, which is posing threat to the financial health and soundness of these institutions. Adequate reform initiatives are required in this regard to improve the financial soundness of PACS.
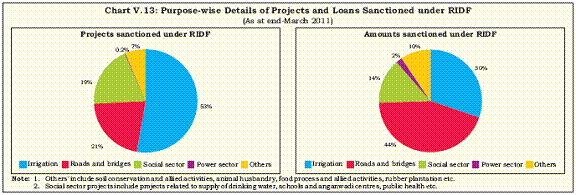
One-fifth of the sanctioned loans was disbursed during the first year of RIDF XVI 5.62 As at end-March 2011, the total amount of deposits collected under RIDF scheme stood at `95,785 crore. The number of projects under RIDF XVI increased as compared to its previous tranche. However, out of the total loans sanctions under RIDF XVI, one fifth was disbursed during the first year. 5.63 A separate window, namely National Rural Roads Development Agency (NRRDA) was introduced in 2006-07 under RIDF tranches XIIXV. NRRRA was introduced with the objective of funding the rural roads component of Bharat Nirman Programme introduced by the Central Government. As at end-March 2011, the aggregate allocation under NRRDA stood at `18,500 crore. Notably, there was no delay in disbursement of loans under NRRDA, as indicated by 100 per cent disbursement of loans sanctioned under the scheme (Table V.26). 5.64 The purpose wise details of projects and loans sanctioned under RIDF showed that irrigation accounted for more than half of total projects sanctioned while almost one fifth of total projects sanctioned were on roads and bridges, and another 19 per cent were for social sector projects. As against this, almost 44 per cent of total loans sanctioned were for development of roads and bridges followed by irrigation and social sector projects (Chart V.13).
Developments under Kisan Credit Card Scheme (KCC) 5.65 At end-March 2011, the total number of KCCs issued stood at 104 million all over the country. Total number of cards issued as well as loans sanctioned under KCC increased in 2010- 11 as compared to previous year (Table V.27). 5.66 An analysis of data on region wise as well as agency wise disbursement of number of KCCs issued showed that out of total number of KCCs issued by cooperative banks in the year 2010- 11, southern region accounted for a maximum share of 34 per cent followed by central and northern region. However, in terms of credit disbursement under KCCs by cooperative banks central region accounted a maximum of 35 per cent. In case of commercial banks, majority of number of KCCs issued as well as loans disbursed was in the southern region. One notable fact was that the number of KCCs issued as well as credit disbursed under KCC scheme was notably low in north-eastern region invariably for cooperatives, commercial as well as regional rural banks (RRBs) (Appendix Table V.10).
Initiatives to make KCC technology enabled 5.67 The task force on coverage issues related to Agricultural Debt Waiver and Debt Relief Scheme (ADWDR), 2008 has stressed on the need of making KCC technologically enabled including the conversion of KCC into a smart card with withdrawals and remittances enabled at ATMs, points of sale, and through hand held machines. Also, recommendations have been made to redesign the MIS of KCC. It has been proposed by the committee to fix the KCC limit to 5 years with increased flexibility given to the farmer to use it as and when needed without any sub target fixed for any crop or stages of cultivation. Status of Revival Package for Rural Cooperatives 5.68 A task force was constituted by the Central Government under the chairmanship of Prof. A Vaidyanathan in 2004 to analyse the challenges and issues in the rural cooperative sector as well as to design future action plan for this sector. Following the recommendations of this committee, a revival package for short term rural cooperatives was announced in January 2006. A separate revival package for long term cooperatives was announced subsequently in the union budget of 2008-09. 5.69 NABARD has been entrusted with the responsibility of implementing the revival package. A National Implementing and Monitoring Committee (NIMC) monitors the status of implementation of the revival package all over the country. Within each State, the State Level Implementing and Monitoring Committee (SLIC) supported by NABARD and DCCB level implementing and monitoring committee (DLIC) together monitor the implementation status in the concerned state. Implementation of Revival Package for Short Term Rural Cooperative Credit Structure (STCCS) is in progress 5.70 The process of implementing the revival package in any State necessarily begins with signing a Memorandum of Understanding (MoU) among the Central Government, the concerned State Government and NABARD. So far 25 State Governments have signed the MoU with Government of India and NABARD, comprising more than 96 per cent of the rural cooperatives operating in the country. 5.71 An amount of `8661 crore has been released by NABARD for recapitalisation of 53,380 PACS in sixteen States, while the State Governments have released `817 crore as their respective share. Common Accounting System (CAS) and Management Information System (MIS) 5.72 While the process of adoption of CAS is underway in 16 States, in the other States where MoUs have been signed the RCS concerned have been advised to adopt CAS on the lines suggested by NABARD. Special Audit for PACS 5.73 Guidelines and formats for conduct of special audit were circulated to all participating States. Further, training for master trainers and departmental auditors for conduct of special audit of PACS has been completed in all 25 implementing States. So far, special audit has been taken up in 80, 773 PACS and completed in 80,639 PACS. Legal, Institutional and Managerial Reforms 5.74 So far, 21 States amended their State Cooperative Acts. Amendment of bye laws of StCBs and PACS is also in progress in various States. 5.75 In order to bring qualified professionals in the management of cooperatives, the Reserve Bank has prescribed ‘fit and proper criteria’ for appointment of the directors and chief executive officers (CEOs) of cooperatives. Accordingly, professional directors satisfying ‘fit and proper criteria’ have been put in place in the StCBs of Andhra Pradesh, Karnataka, Maharashtra and some other States. Also some of the States have already implemented the prescribed criteria for appointment of CEO of cooperatives. Elected Boards are in place in almost all units of STCCS in all States except Andhra Pradesh, Arunachal Pradesh, Manipur, Nagaland and Tamil Nadu. Training and Human Resource Initiatives 5.76 A working group set up by NABARD designs training modules for training of electoral directors and staffs of PACS. Training has been imparted to 254 master trainers from 23 States. These master trainers have trained 2,039 district level trainers to conduct field level training programme for PACS. So far, 81,037 PACS secretaries have been trained in 17 States and 1,12,354 elected members of PACS have been trained in 14 States. 5.77 A new programme on business development and profitability for PACS secretaries has since been rolled out and 76 master trainers from 12 implementing States were trained at Bankers Institute of Rural Development, Lucknow. So far, 36,125 PACS staffs in eight States have been trained. Also, a five-day in-campus orientation programme for branch managers and senior officers of CCBs/ StCB for business development/ diversification has been developed and 1,582 branch managers/senior officers of DCCBs/StCB have been trained. 5. Conclusions UCBs’ profits increased though there are some concerns regarding their asset quality 5.78 During the year 2010-11, the financial performances of UCBs improved while some segments of the rural cooperative sector witnessed deterioration in their financial health. Though the overall profits of UCBs improved during 2010-11 there were some concerns regarding some of the UCBs reporting negative CRAR. Also there was an increase in gross NPAs of UCBs albeit the NPA ratio declined. Financial health of the rural cooperatives was weak sector 5.79 Within the rural cooperative sector, while the StCBs and DCCBs reported profits, the ground level institutions, i.e., PACS reported huge losses. Also, operating expenses, particularly staff expenses increased significantly in the long term rural cooperative sector. This suggests that initiatives need to be taken in order to rationalise the operating expenses of these cooperatives. Implementation of MIS/CAS and computerization of PACS also needs to be expedited. Regional concentration of cooperatives limits their role in financial inclusion 5.80 Apart from regional concentration, banking penetration of cooperatives remained very low in the north-eastern part of the country. There is a need to further expand the base of cooperatives in the north-eastern region. Along with this, efforts need to be taken to improve the financial health of grass root level rural cooperatives i.e., PACS in order to enhance financial inclusion. 1 Since data for rural cooperatives is available with time lag of one year. 2 This chapter provides analysis of operation and performance of cooperative banks based on the data collected from Urban Banks Department (UBD) of RBI (for UCBs) ,NABARD (for rural cooperatives except PACS), and National Federation of State Cooperative Banks or NAFSCOB (for PACS). 3 The data for 2011 presented in this section is provisional. 4 Deposits and advances as referred in this definition may be reckoned as on 31-st March of the immediate preceding financial year. 5 Existing investments, as on August 30, 2007 made by banks in non-SLR bonds held in HTM category are not taken into account for calculation of adjusted bank credit. However, fresh investments by banks in non-SLR bonds are taken into account for this purpose. Also inter-bank exposures will not be taken into account for setting priority sector targets/sub targets. 6 Advances to priority sectors are inclusive of advances to weaker sections. 7 Data for 2009-10 presented in this section is provisional. |
|||||||||||||||||||||||||||||||||||||||||||||||||||||||||||||||||||||||||||||||||||||||||||||||||||||||||||||||||||||||||||||||||||||||||||||||||||||||||||||||||||||||||||||||||||||||||||||||||||||||||||||||||||||||||||||||||||||||||||||||||||||||||||||||||||||||||||||||||||||||||||||||||||||||||||||||||||||||||||||||||||||||||||||||||||||||||||||||||||||||||||||||||||||||||||||||||||||||||||||||||||||||||||||||||||||||||||||||||||||||||||||||||||||||||||||||||||||||||||||||||||||||||||||||||||||||||||||||||||||||||||||||||||||||||||||||||||||||||||||||||||||||||||||||||||||||||||||||||||||||||||||||||||||||||||||||||||||||||||||||||||||||||||||||||||||||||||||||||||||||||||||||||||||||||||||||||||||||||||||||||||||||||||||||||||||||||||||||||||||||||||||||||||||||||||||||||||||||||||||||||||||||||||||||||||||||||||||||||||||||||||||||||||||||||||||||||||||||||||||||||||||||


हे पेज शेअर करा:


भारतीय रिझर्व्ह बँक मोबाईल ॲप्लिकेशन इंस्टॉल करा आणि नवीनतम बातम्यांचा त्वरित ॲक्सेस मिळवा!
आमचे अॅप इंस्टॉल करण्यासाठी QR कोड स्कॅन करा


पेज अंतिम अपडेट तारीख:


