1. The Basic Statistical Returns of Scheduled Commercial Banks in India, Volume 37, is based on
data collected through BSR 1 and 2 surveys as on March 31, 2008, which covered 77,699 offices of
scheduled commercial banks including regional rural banks. These returns are collected from each
branch/office of a scheduled commercial bank in India. The salient features are set out below:
Outstanding Credit of Scheduled Commercial Banks
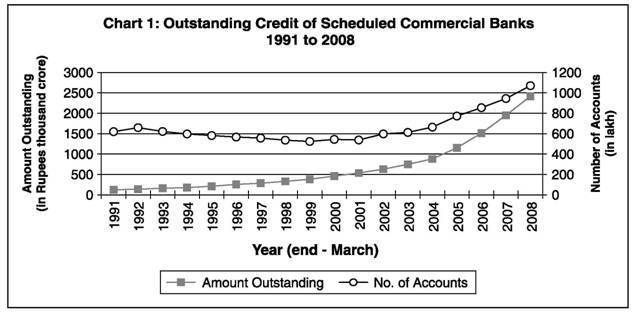
2. Growth of gross outstanding credit
- At the end of March 2008 gross outstanding credit of scheduled commercial banks amounted to Rs. 24,17,007 crore registering an increase of 24.1 per cent as against an increase of 28.6 per cent in the previous year (Table No.1.3).
- The number of borrowal accounts increased to 10.70 crore in 2008 from 9.44 crore in 2007, i.e. by 13.3 per cent (Table No. 1.3).
3. Bank group-wise distribution of credit
- The nationalised banks continued to have a major share in total bank credit, showing a marginal increase to 48.8 per cent in 2008 from 47.6 per cent in 2007. The share of ‘other scheduled commercial banks’ was 19.7 per cent in 2008. The share of foreign banks declined to 6.7 per cent in 2008 from 6.9 per cent a year ago (Table No.1.4).
- The nationalised banks had the highest credit growth at 27.4 per cent in 2008. The SBI & Associates and Other Scheduled Commercial banks witnessed growth in credit at 20.9 and 22.0 per cent in 2008, respectively. Foreign banks recorded a credit growth of 19.6 per cent, whereas the regional rural banks recorded a growth of 21.0 per cent in 2008.
- Of the incremental credit, during 2008, SBI & Associates, Nationalised banks and other scheduled commercial banks shared 20.0, 54.0 and 18.2 per cent, respectively.
4. Sectoral (occupation-wise) deployment of bank credit
- The share of Non Food credit in gross bank credit was higher at 98.4 per cent in March 2008 than 97.6 per cent in 2007 (Table No. 1.9).
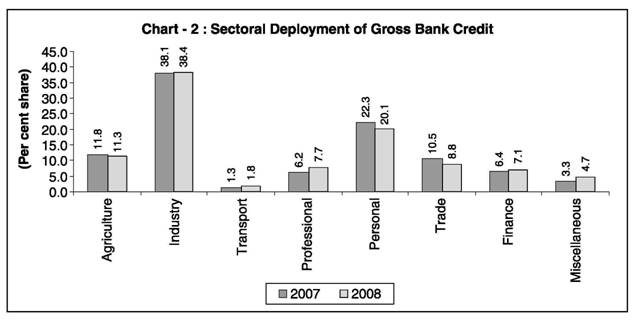
- The share of agriculture in gross bank credit declined marginally to 11.3 per cent from 11.8 per cent in 2007. The share of credit to industry increased to 38.4 per cent in 2008 from 38.1 per cent in 2007 (Table 1.11 and Chart - 2).
- The share of personal loans decreased to 20.1 per cent of gross bank credit in 2008 from the level of 22.3 per cent in the previous year.
- The share of credit to trade declined to 8.8 per cent in 2008 as against 10.5 per cent in 2007.
5. Sectoral (Occupation-wise) credit off-take
- The growth of bank credit to agriculture decreased to 19.1 per cent in 2008 as against 33.3 per cent in the preceding year (Table 1.9).
- The growth of credit to industry declined to 25.2 per cent in 2008 from 31.0 per cent recorded in 2007.
- Personal Loans registered a growth of 12.0 per cent in 2008 compared to 22.7 per cent in 2007. Housing loans, which forms a part of personal loans, grew by 8.5 per cent compared to 25.7 per cent in the previous year.
6. Incremental Bank Credit (Occupation-wise)
- The industry sector, with 40.5 per cent share in the incremental credit in 2007, continued to capture the major share in 2008 at 39.7 per cent.
- The agriculture sector absorbed about 9.4 per cent of the incremental credit in 2008 compared to 13.3 in 2007.
- The personal loans accounted for 11.0 per cent of incremental credit, in which share of housing loans were 4.2 per cent.
- The share of credit to professionals in the incremental credit in 2008 increased to 14.0 per
cent up from 9.1 per cent in 2007.
7. Size-wise distribution of bank credit
- The number of small borrowal accounts (with credit limit up to Rs 2 lakh) contributed 88.4 per cent of total number of accounts as against 89.3 per cent in 2007, while the share of outstanding credit of small borrowal accounts was 13.7 per cent as compared to 14.4 in 2007 (Table No.1.12).
- The share of credit with credit limit above Rs. 25 crore increased to 35.6 per cent in 2008 from 33.0 per cent in the previous year.
8. Interest rate on bank credit
- The distribution of outstanding credit according to interest rate ranges (accounts each with credit limit of over Rs.2 lakh) revealed that the proportion of outstanding amount was the highest at 30.5 per cent in 10 – 12 % (Table No. 1.13).
- The weighted average interest rate in respect of all loans and advances with credit limit of over Rs.2 lakh worked out to be 12.34 per cent as at the end of March 2008 as compared to 11.92 per cent in the previous year.
Aggregate Deposits
9. Growth in aggregate deposits
- Aggregate deposits amounted to Rs. 32,49,946 crore registering a growth of 25.1 per cent in 2008 as against 24.2 per cent a year ago (Table No.1.18).
- The number of deposit accounts in 2008 increased by 12.0 per cent to 58.17 crore from about 51.91 crore in March 2007.
10. Bank group-wise distribution of deposits
- The nationalised banks have a major share in aggregate bank deposits, at 48.1 per cent in 2008. The share of SBI & Associates increased and was at 23.2 in 2008 as compared to 22.2 per cent in 2007 (Table No.1.4).
- The deposits of the SBI & Associates registered the highest growth of 31.0 per cent followed by the nationalized bank (24.1 per cent) and foreign banks (23.1) in 2008.
11. Type of deposits
- The share of term deposits in total deposits marginally declined to 61.3 per cent in 2008 from
61.5 per cent in 2007. The shares of current deposits and saving deposits were at 13.9 per
cent and 24.8 per cent, respectively in 2008 as against 12.4 and 26.1 per cent in 2007 (Table
No.1.18).
12. Maturity pattern of term deposits
- The share of term deposits with original maturity period of 5 years and above in total term
deposits increased to 8.3 per cent in 2008 from 7.3 per cent in the previous year (Table
No.1.24).
- The share of deposits with maturity period ranging from 3 years to less than 5 years declined
to 14.8 per cent in 2008 from 15.4 per cent in 2007. The maturity period 1 to 2 years had
39.9 per cent of the total term deposit amount in 2008 up from 32.7 per cent in 2007 while
deposits for maturity period 6 months to 1 year witnessed decline in their share to 14.2 per
cent from 17.7 per cent in the previous year.
13. Interest rate on term deposits
- The weighted average interest rate of term deposits outstanding in 2008 worked out to 8.71 per cent, as compared to 8.22 per cent as at end-March 2007 (Table No.1.28).
14. Interest rate spread
- The interest rate spread on bank credit (large borrowal account with credit limit over Rs 2
lakhs) over term deposits was at 3.63 per cent in 2008 compared to 3.70 per cent in 2007.
Credit - Deposit Ratio
(As per Place of Sanction and Utilisation of Credit)
15. Population group-wise C-D Ratio
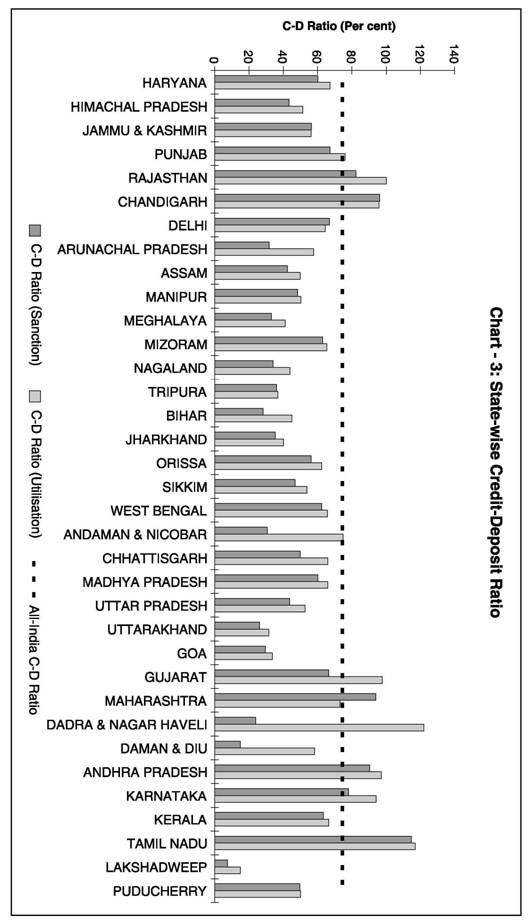
- The All-India C-D ratio was at 74.4 per cent in 2008.
- The population group-wise C-D ratio in respect of rural areas at the end of March 2008 was at 60.3 per cent as per place of sanction of credit. In the case of semi-urban and urban areas the C-D ratios were 53.2 per cent and 58.4 per cent, respectively. The C-D ratios as per place of utilization for rural, semi-urban and urban areas were 106.5 per cent, 59.5 per cent and 65.5 per cent, respectively. The C-D ratio recorded in metropolitan centres as per place of sanction and utilisation were 87.2 per cent and 75.7 per cent as compared to 88.5 per cent and 79.0, respectively in 2007 (Table No.1.6).
16. Migration of credit among the states
- The analysis of migration of credit among the states has been done through the Credit Deposit (CD) ratios, calculated as per the place of sanction of credit and place of utilisation of credit (Table No. 1.7 and Chart – 3).
- Rajasthan, Chandigarh, Andhra Pradesh, Karnataka and Tamil Nadu had CD Ratio, both as per place of sanction and utilization, above the All-India CD Ratio (74.4 per cent).
- Among these states Rajasthan, Andhra Pradesh, Karnataka and Tamil Nadu had higher CD-ratios as per utilisation than sanction.
|
 IST,
IST,