 IST,
IST,
I. Output
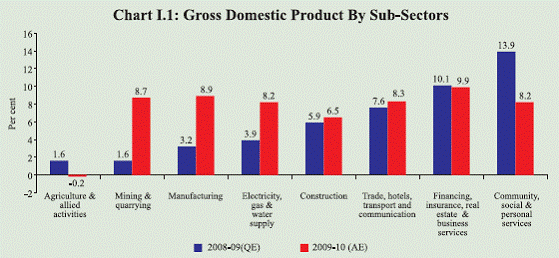
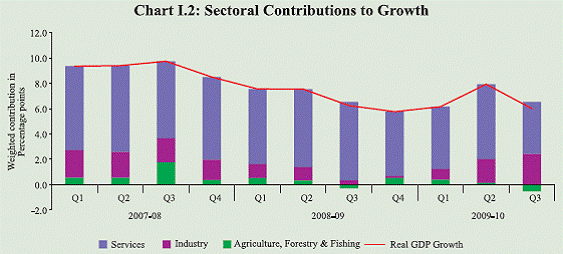
The Indian economy exhibited clear momentum in recovery, and despite the impact of a deficient monsoon on agricultural production, GDP growth for 2009-10 has been estimated at 7.2 per cent, up from 6.7 per cent recorded in 2008-09. The recovery also has been broad based, excluding “agriculture” and "community, social and personal services". The Index of Industrial Production (IIP) has shown double digit growth in recent months. Lead indicators for services activities point to overall improvement since the third quarter of 2009-10. Survey data suggest pick up in capacity utilisation levels in recent quarters, which however, remain below their previous peaks. I.1 After experiencing a distinct moderation in growth to 6.7 per cent in 2008-09, the Indian economy recovered in 2009-10 with a growth of 7.2 per cent (as per Central Statistical Organisation (CSO) advance estimates). Five of the eight sectors/subsectors of the economy recorded higher growth rates in 2009-10 (Chart I.1). I.2 The CSO recently revised the base year of national accounts statistics from 1999-2000 to 2004-05. Apart from revising the deflator, the new series (base : 2004-05) incorporates the available results of various surveys and studies undertaken by the CSO in collaboration with other Government agencies. The coverage of the new series has been expanded in terms of new activities, besides incorporating a number of procedural changes in estimation. There are no major changes in the overall annual growth rates between the old and new series, with the exception of 2007-08. At the sectoral level, however, there are changes in the growth rates and shares in GDP. I.3 The overall agricultural growth during 2009-10 was earlier expected to decline significantly as in the previous drought years. However, supported by good rabi prospects and a strong ‘allied sector’, decline in agricultural and allied activities GDP for the year is now expected to be much smaller at (-) 0.2 per cent as per the CSO’s advance estimates. I.4 Quarterly growth trends during 2009-10 indicate moderation in Q3 after the strong recovery seen in Q2 (Table I.1 and Chart I.2). This moderation in growth resulted primarily from two factors: first, the adverse impact of deficient monsoon on agricultural output getting largely reflected in Q3 data. Second, the impact of high base in Q3 of 2008-09, when ‘community, social and personal services’ had exhibited higher growth reflecting disbursement of Sixth Pay Commission arrears. If the impact of these two factors is netted out, Q3 growth maintains the momentum seen in earlier quarters. The acceleration in industrial growth has been particularly strong since December 2009. Agricultural Situation I.5 The deficient South-West monsoon during 2009, with a short fall of 23 per cent in precipitation, resulted in drought in several states. The North-East monsoon performance during 2009 has been satisfactory, with the cumulative rainfall being 8 per cent above normal as compared to 31 per cent below normal during the corresponding period of the previous year. The delayed withdrawal of the South West monsoon, above normal North East monsoon and focused Government efforts towards improving rabi production are likely to have a positive effect on rabi output, thereby partially offsetting the losses in kharif output.
I.6 Encouraged by the record foodgrains production of 234.5 million tonnes during 2008-09, the Ministry of Agriculture had set a higher target of foodgrains production in 2009-10 (Table I.2). As per the Second Advance Estimates for 2009-10, total foodgrains production is estimated to decline by 7.5 per cent over the previous year. While kharif foodgrains and oilseeds production is expected to decline by 14.6 per cent, rabi production is xpected to exhibit a marginal increase of 0.7 per cent. Crop-wise, a decline is expected for all crops except tur, gram, rapeseed and mustard, soyabean, cotton and jute. Food Management I.7 Notwithstanding the decline in production, procurement of foodgrains (rice and wheat) during 2009-10 (up to March 15, 2010) was higher than in the previous year (Table I.3). The total stock of foodgrains declined from the peak of 54.8 million tonnes as on June 1, 2009 to 45.8 million tonnes as on March 1, 2010 due to higher off-take. Even after the decline, both rice and wheat stocks have remained substantially higher than their respective buffer norms.
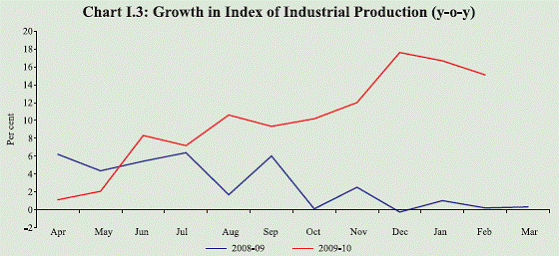
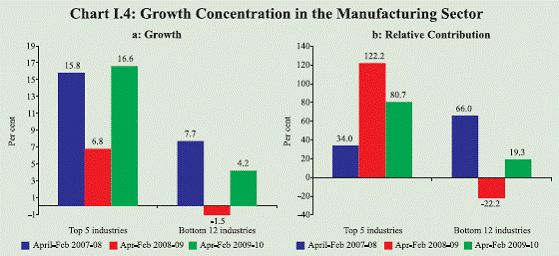
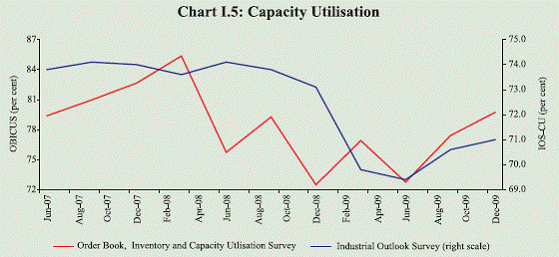
I.8 While off-take during the first half of 2009-10 was mainly through the targeted public distribution system (TPDS) and other welfare schemes, in the second half of the year, the Government allocated 3 million tonnes of wheat and 1 million tonne of rice for open market sale with a view to containing rising prices of food articles. Additional ad hoc allocations of 1.1 million tonnes of rice and 2.5 million tonnes of wheat were made under TPDS for the period January-February 2010 to augment supply of these items. Industrial Performance I.9 Industrial output, which was affected by the cyclical slowdown and international commodity price shocks in 2007-08 and the global recession in 2008- 09, recovered substantially in 2009-10. The Index of Industrial Production (IIP) registered double digit growth during October 2009-February 2010 (Chart I.3 and Table I.4a). The industrial growth was driven by the manufacturing sector, with a weighted contribution of 88.8 per cent, higher than its weight of 79.4 per cent in the IIP. I.10 Thirteen out of seventeen industries in the IIP, accounting for 59.9 per cent of the weight, recorded higher growth than in the previous year. The top five manufacturing industries with a combined weight of 36.1 per cent in the IIP contributed about 80.7 per cent of the growth during April-February 2009-10, as compared with 122.2 per cent contribution in the corresponding period in 2008-09 and 34 per cent in 2007-08. This suggests that though the recovery has become more broad-based as compared to the last year, there is scope for further improvement (Chart I.4b). I.11 The use-based classification of industries shows that capital goods since September 2009 and intermediate goods since August 2009 have registered doubledigit growth, which will support the growth momentum in several downstream industries. Durables production, which had remained on the double-digit growth trajectory since the beginning of 2009-10, accelerated further between November 2009 and February 2010. The growth in basic goods remained relatively moderate during 2009-10, with intermittent spikes. Industry segments like ‘transport equipment and parts’, ‘machinery and equipment other than transport equipment’ and ‘metal products and parts, except machinery and equipment’ recorded growth rates in the range of 36-59 per cent during December 2009-February 2010. The surge in growth of ‘transport, equipment and parts’ during the last few months is also corroborated by the robust performance seen in automobiles production. Overall automobiles production grew by almost 24 per cent during April-February 2009-10 and the share of exports in total production was about 13 per cent1. The consumer nondurables segment, remained subdued, notwithstanding some improvement in February 2010. The relative weakness in this segment could be attributed to output contraction in food products, beverages and tobacco products and jute and other vegetable fibre textiles (except cotton). Given its substantial weight in the overall consumer goods output, the weak performance of the consumer non-durable segment has dampened recovery in this subsector. I.12 During the period April-January 2009-10, capacity utilisation in infrastructure sector showed a mixed trend, with finished steel and fertilizer sectors recording higher utilisation as compared with the corresponding period last year, while cement and refinery production of petroleum products witnessed lesser utlisation for the same period (Table I.5). I.13 The Order Book, Inventory and Capacity Utilisation Survey of the Reserve Bank indicates that even though capacity utilisation has been witnessing an improvement since Q2 of 2009-10 it remains below the peak observed during the pre-global crisis period. Similar pattern is also observed from the Industrial Outlook Survey of the Reserve Bank (Chart I.5).
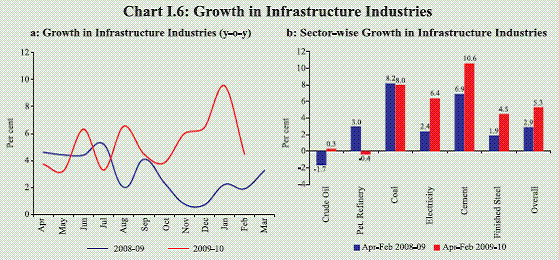
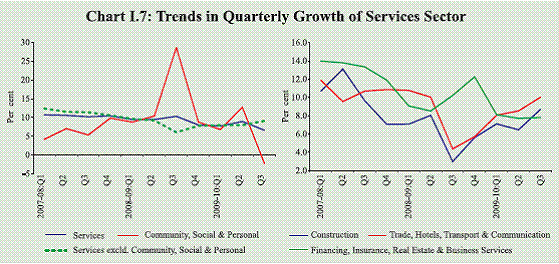
Infrastructure I.14 The performance of core infrastructure after improving significantly during November 2009 to January 2010, decelerated in February 2010 (Charts I.6a). The slowdown in the growth of core infrastructure during February 2010 (4.5 per cent as compared to 9.4 per cent in January 2010) is led by cement and steel, which may be attributed partly to adjustment in inventories. The accelerated growth in power was led by the robust manufacturing sector performance, while the growth in the output of cement and steel until February 2010 has been on account of improved construction activity. The output of crude and petroleum products remained generally subdued during the year so far (Chart I.6b). The petroleum products picked up somewhat since August 2009, while crude oil production has recovered since December 2009. Natural gas production, which is not represented in the core infrastructure index, increased sharply during 2009-10 on account of commencement of production from the D6 block in Krishna-Godavari (KG) basin and Rajasthan fields (Cairn). Natural gas production grew by about 40 per cent in April-January 2009-10 with high growth recorded particularly during the last few months (an average of 61 per cent during November 2009- January 2010). Services Sector I.15 The growth of services sector, after exhibiting significant recovery in the second quarter, decelerated to 6.6 per cent in Q3 of 2009-10 (Chart I.7). The decline in the growth of ‘community, social & personal services’ depressed the pace of growth during Q3 of 2009-10. Growth in the output of the sub-groups viz., ‘construction’ and ‘trade, hotel, transports & communication’, however, accelerated. I.16 The lead indicators for services sector activity suggest an overall improvement, particularly since Q3 in relation to the performance in the first half of 2009-10. The services dependent on external demand such as tourist arrivals, cargo handled by seaports and airports, and passengers handled by international terminals recovered significantly during Q3 of 2009-10, reflecting the improving external environment. Services driven by domestic demand also displayed robust performance in Q3 of 2009-10, particularly those having strong linkages with the manufacturing sector. Commercial vehicle production, a lead indicator for transport services, grew significantly during Q3 of 2009-10 (Table I.6). I.17 To sum up, GDP growth in 2009-10 has been higher than in the previous year, despite the adverse impact of the deficient South West monsoon on agricultural output. Going forward, the short-term favourable impact of certain fiscal stimulus measures on growth will be absent, which has to be compensated by durable growth in private demand to sustain recovery. Industrial growth has already shown sustained acceleration, and better prospects for rabi crops would also add momentum to the overall recovery. The lead indicators of services activities point to firmer recovery in this sector.
1 Source: Society for Indian Automobile Manufacturers (SIAM). |
||||||||||||||||||||||||||||||||||||||||||||||||||||||||||||||||||||||||||||||||||||||||||||||||||||||||||||||||||||||||||||||||||||||||||||||||||||||||||||||||||||||||||||||||||||||||||||||||||||||||||||||||||||||||||||||||||||||||||||||||||||||||||||||||||||||||||||||||||||||||||||||||||||||||||||||||||||||||||||||||||||||||||||||||||||||||||||||||||||||||||||||||||||||||||||||||||||||||||||||||||||||||||||||||||||||||||||||||||||||||||||||||||||||||||||||||||||||||||||||||||||||||||||||||||||||||||||||||||||||||||||||||||||||||||||||||||||||||||||||||||||||||||||||||||||||||||||||||||||||||||||||||||||||||||||||||||||||||||||||||||||||||||||||||||||||||||||||||||||||||||||||||||||||||||||||||||||||||||||||||||||
पेज अंतिम अपडेट तारीख:


