 IST,
IST,
I. Output
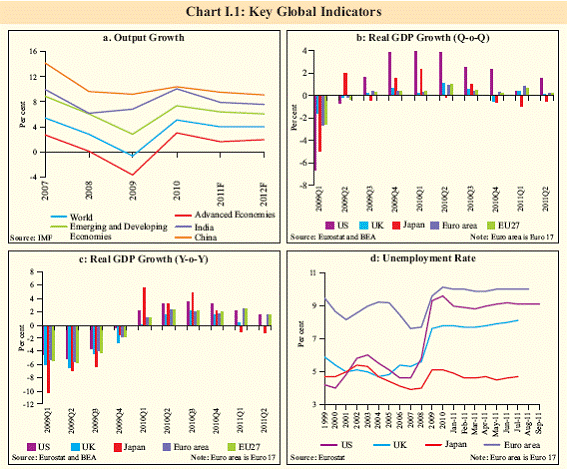
Global recovery looked healthy till recently, but slowing momentum was witnessed in Q3 of 2011. Moderation in global growth is also expected ahead as a result of waning of business and consumer confidence. Risks to domestic growth have amplified because of these global headwinds. Notwithstanding a satisfactory monsoon and a possible record kharif crop output, overall growth in the second half of 2011-12 is likely to remain below trend. Moderation in activity is apparent in industry, though the fall is exacerbated by a few volatile components. The services sector has been resilient so far but construction, which is important for its large employment potential, is cooling off. Global growth in siege from debt overhang I.1 The global growth outlook has deteriorated significantly over the last quarter. Global recovery, which appeared healthy till recently, now appears to be in siege from the sovereign debt overhang. Financial instability arising from unresolved sovereign debt issues, especially in the euro area, is impacting business and consumer confidence, leading to risk aversion and dampening of demand and supply of credit. This, in turn, is acting as a drag on aggregate demand and choking recovery from the 2008 crisis in the advanced economies. Risks of spillovers from sovereign debt crisis to the global banking system remain large. I.2 The US economy grew by 1.3 per cent in Q2 of 2011 (annualised q-o-q), after negligible growth in Q1 (Chart I.1).The picture ahead is not clear, as gauged from the October 2011 Beige Book of the Federal Reserve. The latest news flow suggests that the recovery, even though weak, is holding so far. The US Institute for Supply Management (ISM) manufacturing index that serves as a Purchasing Managers’ Index (PMI) improved to 51.6 in September 2011 from 50.6 in August. However, its forwardlooking new orders index remained in contraction mode. Non-manufacturing ISM for US slowed down marginally in September 2011 from the previous month, but still remains in expansion mode. Moreover its production component remained strongly expansionary and accelerated in September. In contrast to signs of a downturn, payrolls increased by 1,03,000 in September after rising by 57,000 in August, but the labour force also grew, leaving unemployment unchanged at 9.1 per cent. Euro area growth at heightened risk, emerging and developing economies may witness softening I.3 Growth prospects for the euro area are at heightened risk, with moderation likely even for Germany, as external demand weakens. Euro area growth decelerated from 2.5 per cent y-oy in Q1 of 2011 to 1.6 per cent in Q2 and is expected to decelerate further in the second half due to moderating global demand, falling consumer and business confidence and stressed financing conditions in the backdrop of the debt crisis. The Japanese economy is on a downswing, reflecting the impact of the earthquake/tsunami but may rebound going ahead as reconstruction accelerates. I.4 Emerging and developing economies (EDEs) had experienced robust recovery from the crisis although their growth has also slightly moderated in recent quarters. There may be further slowing due to monetary tightening, weak external demand and volatile capital flows, yet the slowdown is expected to be less pronounced than in the advanced economies. I.5 China may register some moderation in growth as a fallout of the slowdown in global growth, the impact of monetary tightening and emerging stress in financial markets on the back of ongoing asset price correction. China's GDP growth decelerated for the third consecutive quarter with y-o-y growth recorded at 9.1 per cent in Q3 2011, the lowest in more than two years. Chinese exports have also slowed, recording only 17 per cent y-o-y rise in September 2011, the lowest in seven months due to dwindling growth in Europe, China’s largest trading partner. However, a slowdown in Chinese economy may induce it to rebalance from external trade towards domestic consumption which may lead to adjustments in the countries that run a huge deficit with China.
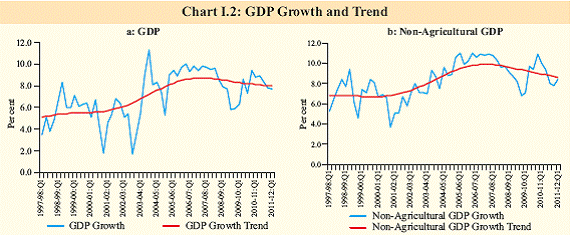
Output gap widens marginally as growth moderates I.6 During the first quarter of 2011-12, real GDP growth moderated to 7.7 per cent, decelerating for the third successive quarter and recording the lowest rate in the previous five quarters. While agriculture sector registered a considerably improved performance vis-a-vis the first quarter of the previous year, moderation was evident in the industry and services sectors (Table I.1). The deceleration was particularly marked for the industrial sector. However, despite some moderation, growth is only slightly below trend (Chart I.2). I.7 At the sectoral level, agriculture growth was supported by improved rabi crop for 2010- 11, while the slackening of industrial growth was reflected in the ‘mining and quarrying’ and ‘manufacturing’ sectors. The services sector witnessed moderation on account of a fall in growth rate of all its sub-components except ‘trade, hotels, transport and communication’. The sharp deceleration in the growth of the construction sector, in particular, is likely to negatively impact capital formation, going forward.
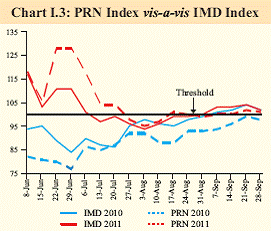
I.8 Downside risks to growth are likely to emanate from the impact of monetary policy in the context of high domestic inflationary pressures and the worsening global environment. These add further downside risk to growth projection of 8.0 per cent for 2011- 12, the baseline scenario in the First Quarter Review of Monetary Policy of July 2011. Agricultural prospects encouraging I.9 The south-west monsoon in 2011-12 was 1 per cent above the long period average, with excess/normal in 92 per cent of the geographical area of the country. For the season as a whole (June-September 2011), the production weighted rainfall index (PRN) of the Reserve Bank and the area weighted rainfall index of the India Meteorological Department (IMD) were at 101 per cent (Chart I.3). The reservoir position as on October 20, 2011 was also much higher than during the corresponding period last year. The timely arrival and normal progress of the monsoon, combined with equitable spatial distribution, contributed favourably to kharif sowing. Till October 14, 2011, sowing under all kharif crops was 2.4 per cent higher than in 2010-11 and was also higher than the normal area sown (Table I.2).
I.10 As per the First Advance Estimates, production of major kharif crops in 2011-12 is expected to be higher than in the previous year. This is significant given the record production of foodgrains during 2010-11. The prospects of rabi crop are also perceived to be favourable due to the satisfactory performance of the monsoon. Thus, growth prospects of the agricultural sector in the current year appear to be good.
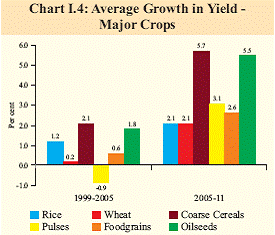
Improvement in productivity of major crops in recent years I.11 The agricultural sector has witnessed resurgence in recent years. The sector was a key driver of growth during 2010-11. The increased agricultural production in recent years has been mainly due to improvement in productivity, while the area under cultivation has remained more or less constant for major crops (Chart I.4). With a view to ensuring food security to the growing population, productivity gains need to be consolidated and sustained.
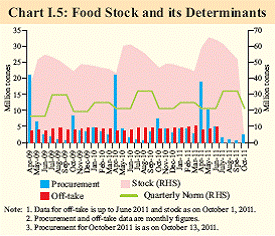
Food security and food stock management remain a challenge I.12 The current stock of foodgrains, at around 52 million tonnes, is much higher than both the quarterly buffer and security reserve requirements (Chart I.5).This level of stocks is sufficient to meet the off-take required for various welfare schemes under the public distribution system (PDS). However, larger coverage and enhanced entitlement under the PDS, as envisaged under the proposed National Food Security Bill, may necessitate additional procurement. This would require creation of additional storage facilities. I.13 Long term food security entails going beyond self-sufficiency to food surplus. The country is not yet self-sufficient in pulses and oilseeds. Latest data available from the consumer expenditure survey of 2009-10 conducted by the National Sample Survey Office (NSSO) suggests that there has been a structural change in food consumption pattern towards protein-rich food items, both in rural and urban areas. Simultaneously, the share of cereals in food has declined. A situation when the demand for high value items such as meat and fish, eggs, fruit and vegetables is rising faster than supply, calls for an overhaul of the entire supply chain mechanism. Development of vegetable clusters and terminal market complexes under the public-private partnership model is a significant step which holds immense potential for better post-harvest management and price discovery. The model Agriculture Produce Market Committee (APMC) Act allows for contract farming and markets in private/cooperative sectors. So far 17 States/Union Territories have amended their APMC Acts and the rest are in the process of doing so. Effective implementation of the model Act is necessary for developing a nation-wide agricultural market.
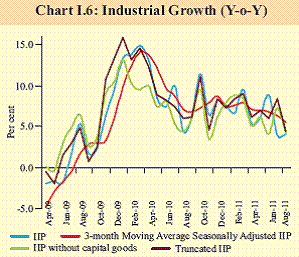
Industrial growth moderates amidst large volatility I.14 The first five months of 2011-12 witnessed significant moderation in the growth of industrial production to 5.6 per cent from 8.7 per cent in the corresponding period of 2010- 11. The slowdown in production was driven by manufacturing and mining, while electricity recorded robust growth (Table I.3). I.15 Manufacturing sector growth decelerated significantly to 6.0 per cent during April-August 2011 from 9.2 per cent during the corresponding period of last year. The lower growth in manufacturing was on account of deceleration/ negative growth in 14 out of 22 industry groups. As per use-based classification, moderation in growth was evident in all categories except basic goods and consumer non-durables. I.16 The sharp moderation in manufacturing growth was reflective of deceleration in production of both capital and intermediate goods (Chart I.6). There has been significant volatility in the production of capital goods in the recent period. Volatility measured by standard deviation is 3.2 for IIP excluding capital goods, which is lower than 4.6 for the overall IIP during the period April 2009 to August 2011. The Reserve Bank’s truncated measure of IIP (excluding volatile items) suggests stronger growth in 2011-12 so far than that suggested by general IIP.
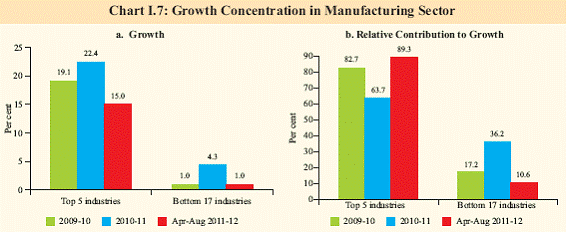
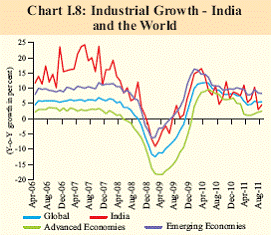
I.17 The top five performing industries accounted for around 90 per cent of the growth in the manufacturing sector during April-August 2011 (Chart I.7). Domestic industrial growth linked to global cycle I.18 Going forward, in addition to the domestic factors, some adverse impact on domestic industrial growth may come from the slowing global manufacturing growth. Co-movement has been observed between the Indian and global industrial production in recent years (Chart I.8). The correlation between the global and Indian industrial growth rates during October 2008-August 2011 is 0.91. The adverse impact may come mainly through trade channel as the global demand for intermediates and finished goods falls. However, some impact may also come through the capital flow channel as financing costs increase with risk aversion. Wealth effects from lower collateral valuations could also impact demand.
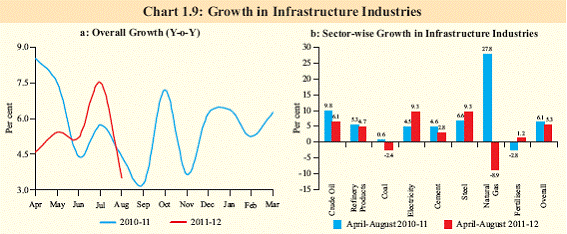
Growth in core industries remains subdued I.19 The core infrastructure sector grew by 5.3 per cent during April-August 2011 compared with 6.1 per cent growth during the corresponding period of the previous year. The performance of core industries during the year is mainly supported by the robust performance of the electricity and steel sectors (Chart I.9).
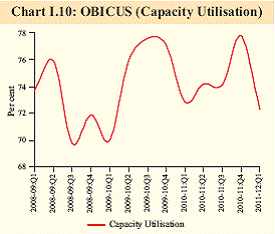
Capacity utilisation eases I.20 The Order Books, Inventories and Capacity Utilisation Survey (OBICUS) [http:// www.rbi.org.in/OBICUS14] of the Reserve Bank shows a decline in new orders during the first quarter of 2011-12. This is reflected in lowering of capacity utilisation to 72.3 per cent in Q1 of 2011-12 from 77.8 per cent in Q4 of 2010-11, mainly due to seasonal factors (Chart I.10). New orders and capacity utilisation declined noticeably in basic metals, textiles, machinery and equipment, food products and beverages, and motor vehicles industries. I.21 Capacity utilisation differed across various infrastructure industries during the first four months of 2011-12. While it was over stretched in petroleum refinery products; cement, fertiliser and finished steel industries showed lower capacity utilisation in relation to 2010- 11 (Table I.4).
Services sector growth also impacted but remains strong I.22 The sharp moderation in construction and ‘community, social and personal services’ notwithstanding, the services sector grew by 8.9 per cent in Q1 of 2011-12, higher than the previous two quarters. The relatively better growth in ‘trade, hotels, transport and communication’ and ‘financing, insurance, real estate and business services’, contributed to the overall momentum in the sector. More recent data, however, indicates a deterioration in indicators for telecom and construction, which suggests that maintaining the momentum may be difficult (Table I.5).
Leading indicators suggest economy may be slowing down in 2011-12 I.23 Even though agriculture is poised to register good growth in 2011-12 and services sector continues to be robust, industrial growth during the year so far has been subdued. The PMI Index for September 2011 is just above the threshold level of 50, suggesting negligible expansion. This may partly reflect global factors, given the recent weak global manufacturing PMIs and the observed linkage between domestic and global industrial growth cycles. The mining sector, particularly coal, has been adversely affected. The sluggishness in core infrastructure sector growth could also pull down GDP growth in 2011-12.The under performance of the construction sector, which is the lead indicator of capital formation, suggests further weakening ahead. Capital goods production has shown considerable volatility since the previous year. Thus, lead indicators suggest the economy will experience moderation in growth during 2011-12. |
|||||||||||||||||||||||||||||||||||||||||||||||||||||||||||||||||||||||||||||||||||||||||||||||||||||||||||||||||||||||||||||||||||||||||||||||||||||||||||||||||||||||||||||||||||||||||||||||||||||||||||||||||||||||||||||||||||||||||||||||||||||||||||||||||||||||||||||||||||||||||||||||||||||||||||||||||||||||||||||||||||||||||||||||||||||||||||||||||||||||||||||||||||||||||||||||||||||||||||||||||||||||||||||||||||||||||||||||||||||||||||||||||||||||||||||||||||||||||||||||
पेज अंतिम अपडेट तारीख:


