 IST,
IST,
II. Fiscal Situation
Combined Government Finances: 2005-06
Key fiscal indicators of combined finances are budgeted to decline in 2005-06, primarily through higher revenue mobilisation especially direct taxes and supported by expenditure management with an emphasis on outcomes than mere outlays (Table 11). Fiscal policy for 2005-06 seeks to continue with the process of fiscal consolidation while aiming to build the spirit of cooperative fiscal federalism by enhanced transfer of resources to States.
Table 11: Key Fiscal Indicators
|
(Per cent to GDP) |
||||||
|
Year |
Primary Deficit |
Revenue Deficit |
Gross Fiscal Deficit |
|||
|
1 |
2 |
3 |
4 |
|||
|
Centre |
||||||
|
2002-03 |
1.1 |
4.4 |
5.9 |
|||
|
2003-04 |
-0.03 |
3.6 |
4.5 |
|||
|
2004-05 RE |
0.4 |
2.7 |
4.5 |
|||
|
(0.05) |
(2.6) |
(4.1) |
||||
|
2005-06 BE |
0.5 |
2.7 |
4.3 |
|||
|
States |
||||||
|
2002-03 |
1.3 |
2.2 |
4.1 |
|||
|
2003-04 |
1.5 |
2.2 |
4.4 |
|||
|
2004-05 RE |
1.0 |
1.4 |
3.8 |
|||
|
2005-06 BE |
0.4 |
0.7 |
3.1 |
|||
|
Combined |
||||||
|
2002-03 |
3.1 |
6.6 |
9.5 |
|||
|
2003-04 |
2.0 |
5.8 |
8.4 |
|||
|
2004-05 RE |
2.2 |
4.1 |
8.3 |
|||
|
2005-06 BE |
1.7 |
3.4 |
7.7 |
|||
|
RE : Revised Estimates. BE:Budget Estimates. |
||||||
Centre's Fiscal Situation
Available information for the first five months of 2005-06 (April-August) indicates improvement in Central Government finances, benefiting from higher tax collections and expenditure management through control over non plan expenditure. The improvement in Central Government finances was also reflected in its surplus cash balances with the Reserve Bank, which during April-September 2005 were almost four times that of a year ago.
During April-August 2005, tax collections increased mainly due to direct taxes and customs duties. Consequently, there was an improvement in revenue receipts as a ratio of the budget estimates (BE) during April-August 2005 (Table 12). Non-tax revenue, as a proportion to BE, was, however, lower than in the first five months of the preceding fiscal year. Revenue expenditure, relative to the BE, was higher during the period under review mainly on account of higher grants to States and expenditure on social services. Nevertheless, the revenue deficit, as a proportion to
Table 12: Central Government Finances during April-August 2005
|
(Rupees crore) |
|||||||
|
Items |
2005-06 |
April- |
April- |
Per cent of Budget Estimates |
|||
|
(Budget |
August |
August |
|||||
|
April-August |
April-August |
||||||
|
Estimates) |
2004 |
2005 |
|||||
|
2004 |
2005 |
||||||
|
1 |
2 |
3 |
4 |
5 |
6 |
||
|
1. |
Revenue Receipts (i + ii) |
3,51,200 |
68,357 |
81,169 |
22.1 |
23.1 |
|
|
i) |
Tax Revenue |
2,73,466 |
45,721 |
58,482 |
19.5 |
21.4 |
|
|
ii) |
Non-tax Revenue |
77,734 |
22,636 |
22,687 |
30.0 |
29.2 |
|
|
2. |
Non-debt Capital Receipts |
12,000 |
32,752 |
3,292 |
105.3 |
27.4 |
|
|
3. |
Non-Plan Expenditure |
3,70,847 |
1,15,818 |
1,23,453 |
34.9 |
33.3 |
|
|
of which: |
|||||||
|
i) |
Interest Payments |
1,33,945 |
45,091 |
44,770 |
34.8 |
33.4 |
|
|
ii) |
Defence |
83,000 |
21,767 |
19,249 |
28.3 |
23.2 |
|
|
iii)Subsidies |
46,358 |
18,422 |
19,947 |
43.6 |
43.0 |
||
|
4. |
Plan Expenditure |
1,43,497 |
37,800 |
47,336 |
26.0 |
33.0 |
|
|
5. |
Revenue Expenditure |
4,46,512 |
1,31,263 |
1,55,541 |
34.1 |
34.8 |
|
|
6. |
Capital Expenditure |
67,832 |
22,355 |
15,248 |
24.2 |
22.5 |
|
|
7. |
Total Expenditure |
5,14,344 |
1,53,618 |
1,70,789 |
32.1 |
33.2 |
|
|
8. |
Revenue Deficit |
95,312 |
62,906 |
74,372 |
82.6 |
78.0 |
|
|
(2.7) |
|||||||
|
9. |
Gross Fiscal Deficit |
1,51,144 |
52,509 |
86,328 |
38.2 |
57.1 |
|
|
(4.3) |
|||||||
|
10. |
Gross Primary Deficit |
17,199 |
7,418 |
41,558 |
93.8 |
241.6 |
|
|
(0.5) |
|||||||
|
Note:Figures in parentheses are per cent to GDP. |
|||||||
BE, was lower than the position a year ago although the primary deficit was higher. Aggregate expenditure increased during April-August 2005, reflecting higher revenue expenditure. The fiscal deficit was higher as a proportion to BE mainly on account of lower recovery of loans from the States reflecting the discontinuation of the debt swap scheme (DSS). Recoveries of loans on account of the DSS for the States had enabled a substantial increase in non-debt receipts of the Centre during the previous year. The fiscal deficit, as a proportion to BE, during April-August 2005 was lower than its level (adjusted for DSS receipts) a year ago.
Financing of the Union Budget
Net market borrowings [excluding allocations under the Market Stabilisation Scheme (MSS)] for 2005-06 - budgeted at Rs.1,03,791 crore - would finance 68.7 per cent of the GFD in 2005-06 as compared with 33.0 per cent in the previous year. Including repayment obligations of Rs.61,676 crore, gross market borrowings of the Central Government work out to Rs.1,65,467 crore. Draw down of surplus cash balances with the Reserve Bank would finance 2.1 per cent of the GFD as against 15.1 per cent in 2004-05 (RE). Securities against small savings, which financed 24.4 per cent of the GFD in 2004-05, are expected to finance only 2.0 per cent. As securities against small savings largely represented the transactions under the DSS for which there is no provision in the Budget for 2005-06, the market borrowings would finance the larger part of the GFD.
During 2005-06 (up to October 20, 2005), the actual issuances of dated securities amounted to Rs.84,000 crore as compared with Rs.96,000 crore scheduled in the
Table 13: Central Government Securities Issued during 2005-06
|
Date of Auction |
Notified Amount |
Residual Maturity |
Cut-off Yield |
|
(Rs. crore) |
(Years) |
(Per cent) |
|
|
1 |
2 |
3 |
4 |
|
April 5, 2005 |
5,000 |
6.98 |
6.80 |
|
April 5, 2005 |
3,000 |
27.39 |
7.79 |
|
April 19, 2005 |
5,000 |
11.74 |
7.48 |
|
April 19, 2005 |
2,000 |
29.31 |
7.94 |
|
May 3, 2005 |
6,000 |
5.03 |
6.99 |
|
May 3, 2005 |
2,000 |
29.27 |
7.98 |
|
May 24, 2005 |
4,000 |
16.05 |
7.28 |
|
June 6, 2005 |
4,000 |
15.98 |
7.47 |
|
June 6, 2005 |
6,000 |
8.86 |
6.91 |
|
June 23, 2005 |
5,000 |
10.81 |
6.91 |
|
July 5, 2005 |
6,000 |
8.16 |
7.06 |
|
July 5, 2005 |
4,000 |
15.90 |
7.57 |
|
July 18, 2005 |
5,000 |
15.86 |
7.81 |
|
August 11, 2005 |
3,000 |
28.99 |
7.44 |
|
August 11, 2005 |
5,000 |
11.43 |
7.14 |
|
August 18, 2005 |
5,000 |
8.66 |
7.04 |
|
August 18, 2005 |
3,000 |
28.98 |
7.55 |
|
September 8, 2005 |
5,000 |
13.04 |
7.23 |
|
September 8, 2005 |
3,000 |
30.00 |
7.40 |
|
October 6, 2005 |
3,000 |
29.92 |
7.66 |
calendar so far (Table 13). This was on account of a reduction in the notified amount from Rs.4,000 crore (as per the issuance auction calendar) to Rs.2,000 crore for maturity of 29.27 years in the auction of May 3, 2005 and rejection of bids for an issue of Rs. 6,000 crore on October 6, 2005. Furthermore, the auction of dated securities scheduled for October 18-25, 2005 for an amount of Rs. 4,000 crore was cancelled based on a review of the current borrowing requirements of the Government of India. Gross and net market borrowings raised by the Centre (up to October 20, 2005) amounted to 60.1 per cent and 50.0 per cent of the BE as compared with 49.8 per cent and 29.0 per cent, respectively, a year ago.
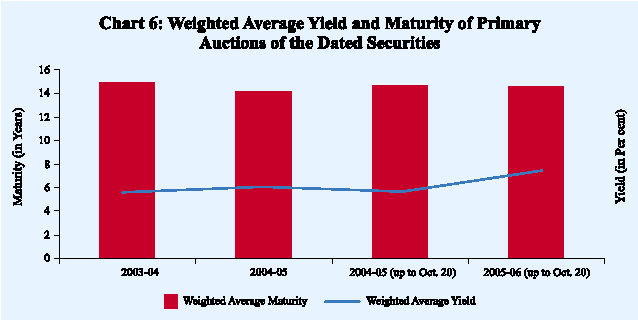
The weighted average yield of the dated securities issued increased to 7.29 per cent during 2005-06 (up to October 20, 2005) from 5.76 per cent during the corresponding period of 2004-05, reflecting the upturn in the interest rate cycle (Chart 6). The weighted average maturity of dated securities of the Central Government during the same period at 15.11 years was higher than 14.30 years in the corresponding period of the preceding year.
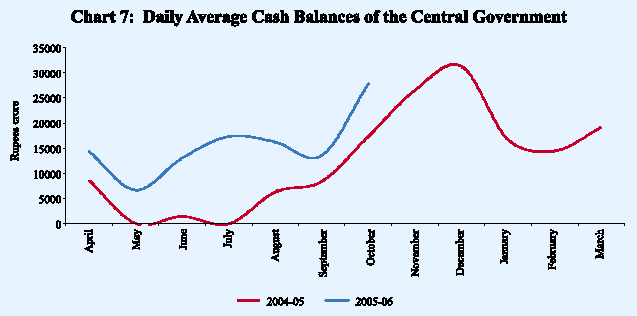
The Centre's Ways and Means Advances (WMA) limits from the Reserve Bank continued to be fixed at Rs.10,000 crore for the first half (April-September) of 2005-06 and Rs.6,000 crore for the second half (October-March). Reflecting its comfortable liquidity position, the Centre has availed WMA only on two occasions (May 3 and June 4, 2005) during 2005-06 so far. The comfortable liquidity position was also reflected in the Centre's surplus cash balances with the Reserve Bank which averaged Rs. 15,954 crore during April-September 2005, significantly higher than that of Rs.4,337 crore during the corresponding period of 2004-05 (Chart 7).
Assessment of Quarterly Central Government Finances (April-June, 2005)
The Central Government released the 'Statement on Quarterly Review of the Trends in Receipts and Expenditure in Relation to Budget' for the first quarter of 2005-06 on August 24, 2005 as required under the Fiscal Responsibility and Budget Management (FRBM) Act, 2003. The Quarterly Review Statement (QRS) found the performance of the Indian economy to be 'satisfactory' during the first quarter of the current year. During this period, the Central Government finances reflected increased tax buoyancy on account of tax reforms, improved collection of customs duties, moderation in the pace of expenditure, decline in food and petroleum subsidies and consequent moderation in the deficit levels. The Government,
however, expressed concern over lower collections under excise duties. The Government reiterated the need for a stricter financial discipline by keeping a vigil on unspent balances before release of fresh funds and assured that steps are being taken to improve the pace of actual utilisation through close monitoring.
The QRS’s assessment of the progress in the implementation of the fiscal policy strategy articulated in the Union Budget 2005-06 reveals corrective measures in toning up the tax administration and rationalisation of expenditure management. In this context, the Government emphasised on shifting focus from mere 'release of funds' (outlays) to 'actual utilisation for intended purposes' (outcomes). The fiscal policy strategy has worked well so far as evident from the fiscal performance during the first quarter of 2005-06.
Outcome Budget
In order to measure the development outcomes of all major programmes/ schemes initiated after the announcement of the Union Budget, the Government, in consultation with the Planning Commission, released the 'Outcome Budget' for 2005-06 on August 25, 2005. In this document, the various Ministries/ Departments have set out targets of intermediate outputs/outcomes, pertaining to Plan Expenditure, in measurable terms. The outcome budget is basically a pre-expenditure instrument to realise the Government's vision through clearly defined outcomes, which will lend greater transparency to the budgetary process. From 2006-07, an outcome budget for non-Plan Expenditure is also scheduled and, over a period of time, it would replicate the budgetary process in terms of intended outcomes.
State Finances
Financing of the States' Budgets
Net allocation under market borrowing programme for State Governments is provisionally placed at Rs.16,112 crore during 2005-06. Taking into account the repayments of Rs.6,274 crore and additional borrowing allocation of Rs.45 crore, the gross allocation amounts to Rs.22,431 crore. States have generally not taken into account the recommendations of the Twelfth Finance Commission (TFC). Reckoning the net Central loans for State Plans as reported in the Union Budget 2005-06 and assuming that the State Plans are maintained at the budgeted level, the market borrowings during 2005-06 would not be substantially higher than the provisional net allocation amount on account of higher devolution of taxes and grants as envisaged in the Union Budget in accordance with the TFC recommendations and larger receipts from NSSF. During 2005-06 so far (up to October 20, 2005), the States have raised an amount of Rs.14,265 crore, i.e., 63.6 per cent of their gross allocation for 2005-06 (Table 14).
Table 14 : Market Borrowings of the State Governments during 2005-06
|
Item |
Date |
Cut-off Rate |
Tenor |
Amount Raised |
||
|
(Per cent) |
(Years) |
(Rs. crore) |
||||
|
1 |
2 |
3 |
4 |
5 |
||
|
A. |
Tap Issues |
|||||
|
i. |
First Tranche |
May 17-18, 2005 |
7.77 |
10 |
7,554 |
|
|
ii. |
Second Tranche |
September 13, 2005 |
7.53 |
10 |
2,931 |
|
|
Total (i to ii) |
10,485 |
|||||
|
B. |
Auctions |
|||||
|
i. |
First |
April 20, 2005 |
7.45 |
10 |
300 |
|
|
ii. |
Second |
June 14, 2005 |
7.39 |
10 |
2,181 |
|
|
iii. |
Second |
June 14, 2005 |
7.35 |
10 |
210 |
|
|
iv. |
Third |
August 4, 2005 |
7.32 |
10 |
250 |
|
|
v. |
Fourth |
September 27, 2005 |
7.45 |
10 |
367 |
|
|
vi. |
Fourth |
September 27, 2005 |
7.42 |
10 |
146 |
|
|
vii. |
Fourth |
September 27, 2005 |
7.50 |
10 |
327 |
|
|
Total (i to vii) |
3,781 |
|||||
|
Total (A+B) |
14,265 |
|||||
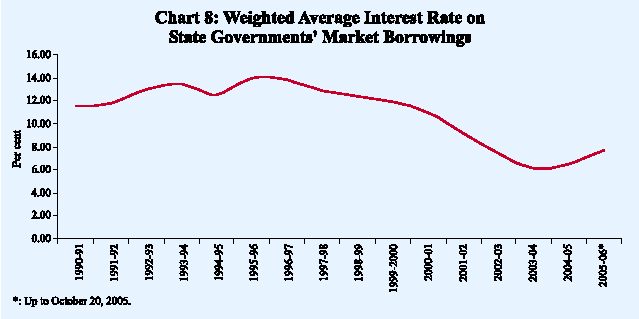
The weighted average interest rate of market loans during 2005-06 (up to October 20, 2005) firmed up to 7.62 per cent from 5.90 per cent in the comparable period of 2004-05 (Chart 8).
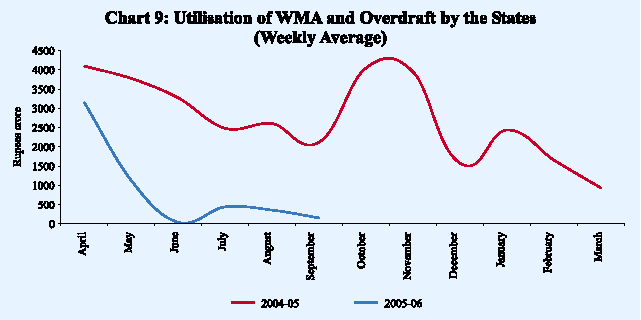
The weekly average utilisation of WMA and overdraft by the States during 2005-06 (up to end-September 2005) amounted to Rs.885 crore, significantly lower than that of Rs.3,064 crore in the corresponding period of the previous year (Chart 9). Nine States have resorted to overdraft during 2005-06 so far (up to September 30, 2005) as compared with 12 States during the corresponding period of the previous year.
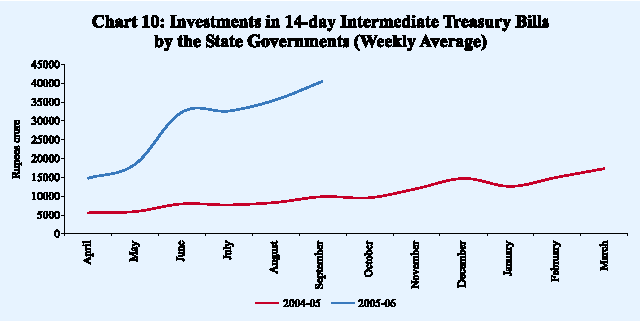
The improvement in the overall cash position of the States was also reflected in a spurt in their weekly average investments in 14-day Intermediate Treasury Bills to Rs.29,052 crore during 2005-06 (up to end-September 2005) from Rs.7,565 crore in the corresponding period of the previous year (Chart 10).
Outlook
The major fiscal challenges in the near future are management of subsidies, financing of food for work and employment guarantee programmes and neutralising the impact of lower loan recoveries from States. The routing of external loans to States through the Consolidated Fund of India would marginally increase the Central Government's expenditure relative to the Budget Estimates, 2005-06. However, the buoyant macroeconomic environment is providing an impetus to the Government's efforts and the economy has so far demonstrated considerable resilience to high and volatile international crude prices. The effort to improve tax collections in the presence of all round buoyant growth will need to be intensified in these circumstances. The hike in international oil prices and the possibility that they may remain high longer than anticipated earlier will continue to pose significant risk to the fisc, directly or indirectly, unless appropriately passed on. Furthermore, the interest burden on the Oil Bonds to be issued to oil companies has to be borne by the Government, which will have some implications for the Government finances. Their redemption in future years adds to the liability of the Government.
पेज अंतिम अपडेट तारीख:


