 IST,
IST,


III. Revenue Dynamics and Fiscal Capacity of Indian States
|
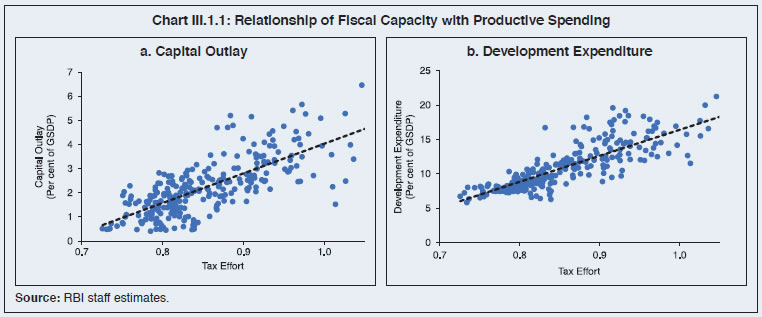
1. Introduction 3.1 As India gains pace and stature as a major engine of the global economic order, sustained and large-scale public investments in human and physical capital will become critical. While India is making good progress in investment in physical infrastructure, the pace of investments in human capacity, especially, education, research and development (R&D) and skill development needs acceleration (Ghani, 2023). Such investments are contingent upon a commensurate jump in government revenues. Since State governments in India contribute to over 60 per cent of general government expenditure, it is crucial that they augment their capacity to generate revenues for the required investment drive. 3.2 Against this backdrop, this chapter assesses the fiscal capacity of Indian States. Section 2 examines their revenue mobilisation capacities and tax efforts. The dynamics of States’ own-tax revenues and own non-tax revenues are analysed against the backdrop of reforms initiated by them. Section 3 discusses the role of inter-governmental transfers in supplementing States’ own revenue while highlighting the challenges posed by the proliferation of cesses and surcharges. Section 4 concludes with some policy perspectives. 2. Revenue Mobilisation Efforts and Current Fiscal Capacity of States 3.3 Revenues receipts of the States can be classified into tax and non-tax categories. Taxes comprise their own tax revenues and share in Central taxes, while non-tax revenues include States’ own non-tax sources and grants from the Centre. 2.1 Own Tax Revenue 3.4 States’ own tax revenue (SOTR) has increased from 5.7 per cent of GDP in 2003-04 to 6.9 per cent of GDP in 2022-23 (Chart III.1). 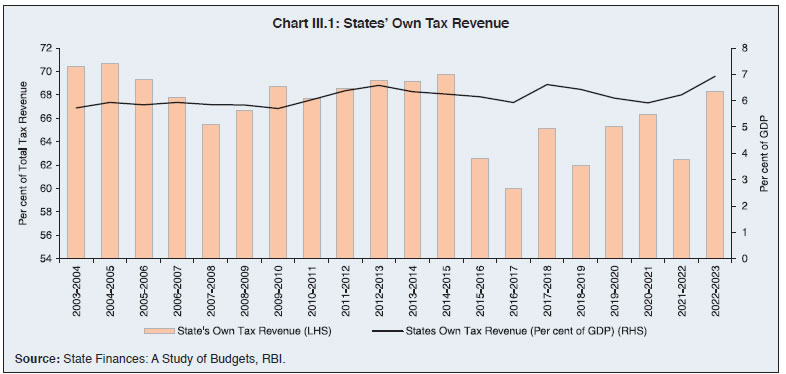 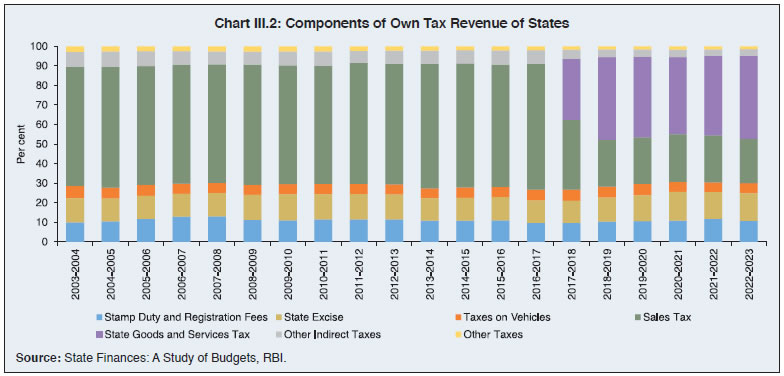 3.5 Till 2016-17, sales tax/VAT was the largest component of own tax revenue. From 2017-18, however, State Goods and Services Tax (SGST) has emerged as the most important source, followed by sales tax/VAT, excise duty, stamp duty and registration fees and taxes on vehicles (Chart III.2). 3.6 There is a large spatial variation in SOTR, ranging from more than 70 per cent of total tax revenue in Haryana, Maharashtra, Telangana, Tamil Nadu, Gujarat, Karnataka, Kerala and Punjab to less than 50 per cent in Bihar and Jharkhand (Table III.1). In the post-GST period, there has been a general increase in the share of SOTR, which has helped the States to reduce their dependence on devolution from the Centre. 3.7 States’ tax buoyancy1 has improved in the recent period (Chart II.3a). SGST collection has picked up since 2021-22 with a buoyancy above one, benefitting from the revival in economic activity and increased compliance due to improved tax administration, especially among the larger States (Chart II.3b). 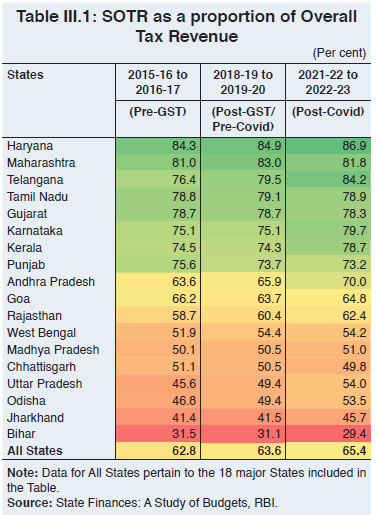 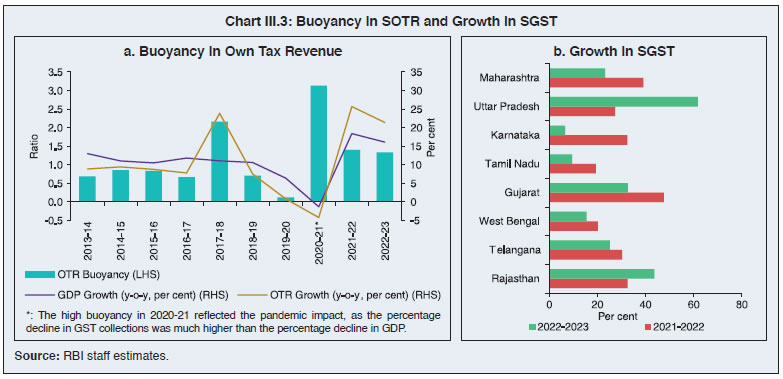 3.8 A stochastic frontier approach suggests reasonably high tax efforts though still below potential (Box III.1), which is broadly in line with existing evidence (Kawadia and Suryawanshi, 2021). Tax reforms and building a strong and innovative tax administration can generate large revenues, as observed in the cross-country experience. For instance, tax administration reforms in Hungary led to an increase of 40 per cent in tax revenue collections between 1996-1999 (IMF, 2002). Similarly, reforms in Tanzania raised tax revenues by 47 per cent between 1998 to 2003 (UNDP, 2011).
Tax Administration, Tax Compliance, Coverage and Rate Structure of States: Some Issues 3.9 In India, collection of different State taxes, viz., stamp duty and registration fees, sales tax/ VAT, excise duty on alcoholic beverages and motor vehicles tax suffer from a high degree of technical inefficiency (Karnik and Raju, 2015). This is mostly related to the rate structure - stamp duty rates range between 5-8 per cent across States as against the international average of less than 5 per cent. High tax rates lead to high transaction costs, tax evasion and destabilisation of urban land markets (Nayudu, 2019). The current rate structure of GST consisting of four tax slabs – 5 per cent, 12 per cent, 18 per cent, and 28 per cent – also adds to complexity (Debroy, 2022). The motor vehicle tax structure in India lacks uniformity due to different bases for computation and different rates across, leading to varying incidence of taxes per vehicle in different States. Inter-state variations result from the application of ‘lifetime’ and annual tax rates to vehicle categories; use of specific and ad valorem rates; and multiplicity of rates (Purohit and Purohit, 2010). A substantial proportion of the arrears in revenue remains outstanding in courts and other appellate authorities depriving States of potential revenues.3 Tax Reforms by States 3.10 States have undertaken taxation reforms to augment their own tax capacity (Annex II.1). Several States have reset stamp duty rates, revised fair value of land parcels, and introduced e-stamping/ digital stamping of various non-registerable documents. Some States have revised the excise duty on liquor, increased license fees, introduced social security cess on liquor consumption and facilitated digital modes of payment at liquor outlets to boost collections. The most common reforms in motor vehicle taxation include revision of the life tax on vehicles, introduction of green tax/green cess, and implementation of strict enforcement practices by punishing vehicle tax defaulters with hefty penalties. The structure of motor vehicle taxes can be further improvised by the States, taking cues from cross-country practices (Box III.2). For addressing concerns in GST collections and plugging leakages, the reforms undertaken by States include use of artificial intelligence and machine learning (AI-ML) technology and data analytics, creation of tax intelligence / research units, e-governance and, making e-invoicing mandatory for certain taxpayers. 2.2 Own Non-Tax Revenue 3.11 States’ Own Non-Tax Revenue (SONTR) consists of six components viz., general services, social services, economic services, fiscal services, interest receipts, and ‘dividends and profits’. The share of SONTR in total revenue has declined steadily in the last decade, remaining below 10 per cent since 2010-11 (1.3 per cent of GDP in 2022-23) (Chart III.4).
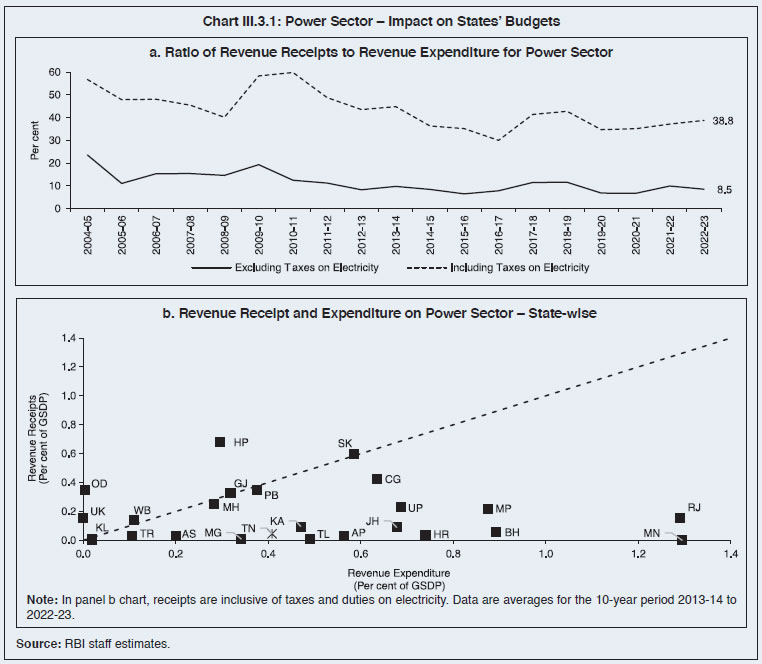
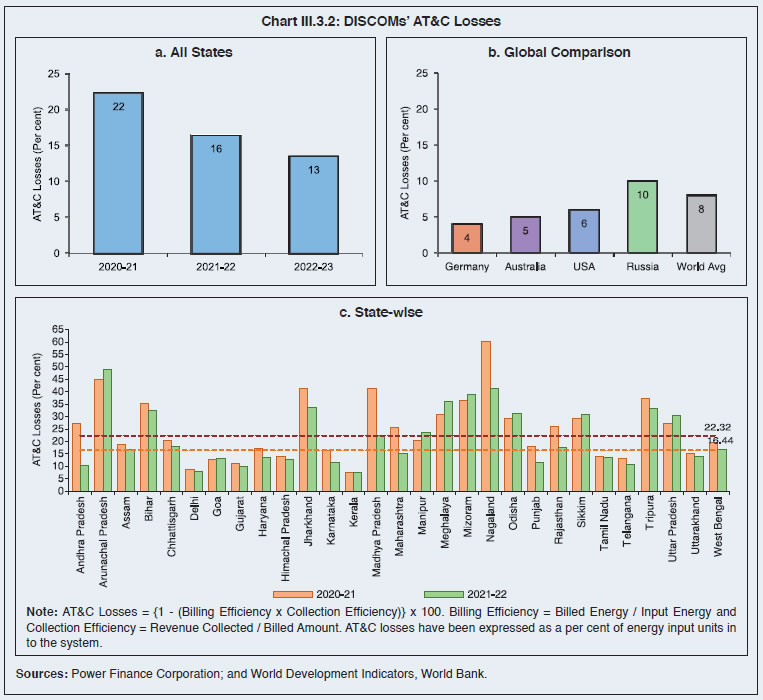
3.12 Economic services are the major source of non-tax revenue for States and their share in SONTR has increased to around 60 per cent in 2021-22 and 2022-23 (Chart III.5). General services, social services and interest receipts4 are the other important components of SONTR. In most of the States, the contributions from fiscal services and receipts from dividend and profit remain insignificant. 3.13 States’ revenue from economic services is mainly generated from industries, power, petroleum, major and minor irrigation projects and forestry and wildlife (Chart III.6). While revenues from industries have increased significantly over the years, the shares of forestry and wildlife have declined. 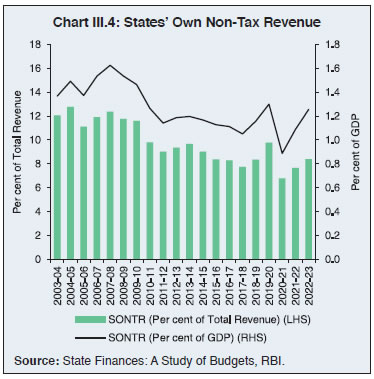 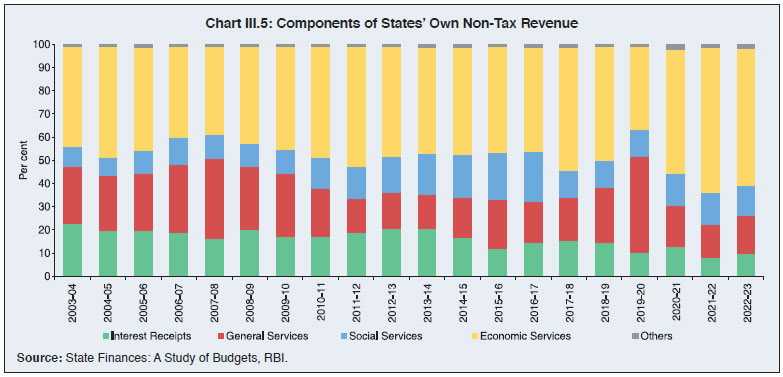 3.14 Major heads of revenue from social services are medical and public health, education, and urban development (Chart III.7). The shares of revenues from education, sports, art and culture are on the decline. 3.15 There is a wide variation in own non-tax revenue collection across States (Table III.2). Mineral rich States like Odisha, Chhattisgarh, and Jharkhand have a significantly higher share of non-tax revenue than other States, with over 60 per cent of their non-tax revenue coming from mining royalties and premium paid by mines. In Goa, electricity distribution is a departmental activity and electricity charges collected from consumers are a part of government non-tax revenue. In contrast, in most other States, electricity distribution is undertaken by power distribution companies (DISCOMs). 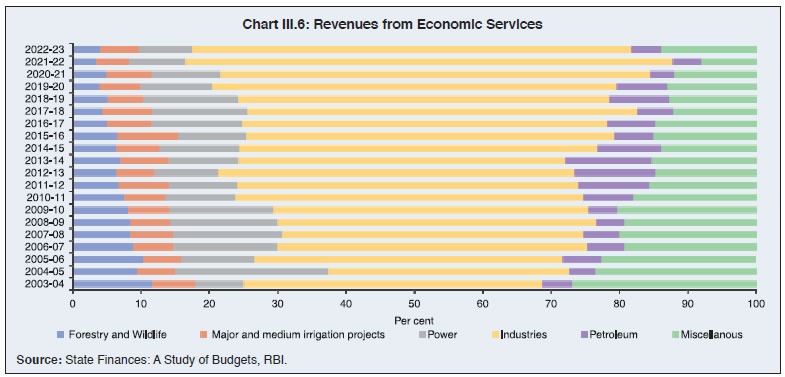 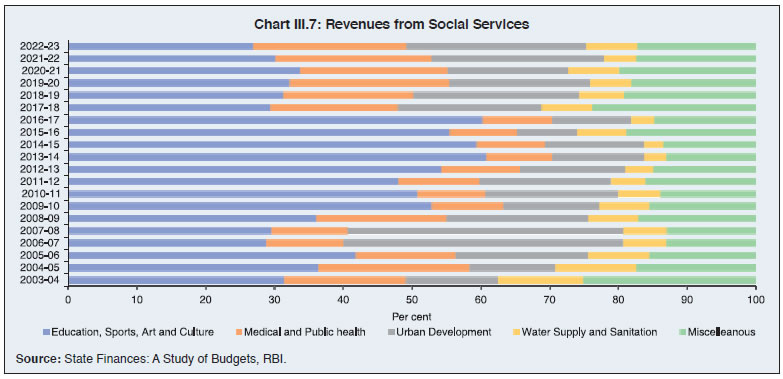 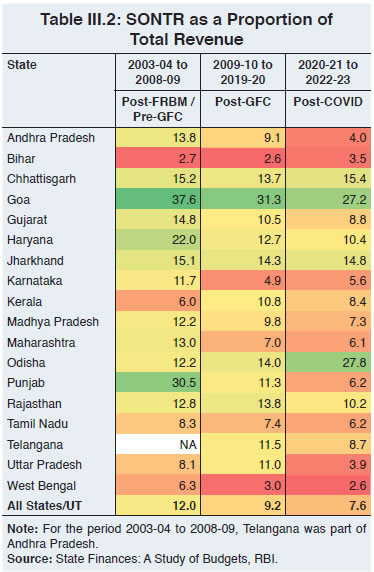 Non-tax Revenue Measures of States and Suggested Reforms 3.16 Growing demand for public expenditures, limitations in expanding tax capacity and limited scope to deviate from common harmonized indirect tax system under the GST regime have induced States to look for opportunities to expand revenue mobilisation from non-tax sources. A major source is user charges on goods and services provided by them. To augment revenues from non-tax sources, reform measures undertaken by State governments include, inter alia, e-auction of mining leases, royalty revision across different segments of mining minerals, revision of the penal rates to curb secret mining and related activities, land monetisation, revision of water rates for industrial use, and improved financial management of the State public sector enterprises (Annex II.2). With the upward revision of electricity tariffs by various States, the under-recovery has come down from ₹0.69/kWh in 2020-21 to ₹0.22/kWh in 2021-22 (GoI, 2022). Smart and pre-paid metering in power distribution may help in further improving billing and collection efficiency, with a commensurate impact on lowering Aggregate Technical and Commercial (AT&C) losses (Box III.3).
3.17 In the case of social services such as education and health which are merit in nature, full cost recovery may not always be possible or desirable. In such cases, user charges should at least recover the operation and maintenance (O&M) costs of infrastructure assets deployed for social services. Proper pricing of water has also assumed importance in view of the fast depletion of groundwater levels and excessive usage/ wastage of water in many States. An appropriate pricing of water – for example, volumetric water charges instead of charging a flat rate - would help in economising the use of water and promote environmental sustainability (TERI, 2010). 3. Inter-Governmental Transfers 3.18 In a federal set up like India, resource collection powers typically reside with the Central government due to economies of scale and the need for uniformity in taxation. While lower-level governments are better suited to address local needs and excel in project execution, they typically have more expenditure responsibilities and fewer revenue-raising capacities. For instance, in India, the Union government has the power to levy major taxes such as income tax, corporation tax and excise duties while States can levy taxes such as stamp duty, registration fees, VAT/sales tax on petroleum products and excise duty on liquor. By contrast, States have major expenditure responsibilities, especially economic and social services such as health, education, law and order leading to vertical fiscal gap, a common feature in many federal countries (Kurian, 2008; Panda, 2019). Vertical fiscal imbalance in India is higher than in countries like Brazil and Canada with Indian States collecting 37 per cent of general government taxes while spending 64 per cent of total expenditure (Chart III.8). Furthermore, within a country, regional disparities due to structural, fiscal, historical, or governance factors can lead to differences in fiscal capacities and financing needs among sub-national governments, resulting in varying fiscal gaps, or horizontal fiscal imbalances. Inter-governmental transfers are designed to mitigate these vertical and horizontal inequities across different levels of government. 3.19 Under Article 280 of the Indian Constitution, the Finance Commission recommends transfer of resources from the Centre to the States to address vertical and horizontal fiscal imbalances. The transfer of resources from the Centre to States in India takes place through three primary channels viz., (i) tax devolution recommended by the Finance Commission under Article 270; (ii) grants recommended by the Finance Commission under Article 275 (e.g., post devolution revenue deficit grants and grants for local bodies); and (iii) grants and loans from Centre to States outside the recommendations of the Finance Commission under Articles 282 and 293, respectively (e.g., support for centrally sponsored schemes and interest free loans to States for capital expenditure). Composition-wise, tax devolution has the largest share in the total transfers, even though the share of grants (under Articles 275 and 282) has increased over time with the increase in centrally sponsored schemes. Following the recommendations of the Twelfth Finance Commission, the Union government refrained from acting as an intermediary for borrowing of the States, which has resulted in a decline in the share of loans in total transfers. However, with back-to-back loan in lieu of GST compensation for the years 2020-21 and 2021-22 and introduction of the ‘Scheme for Special Assistance to States for Capital Investment’ in 2020-21, the share of loans in total transfers has increased again (Chart III.9). 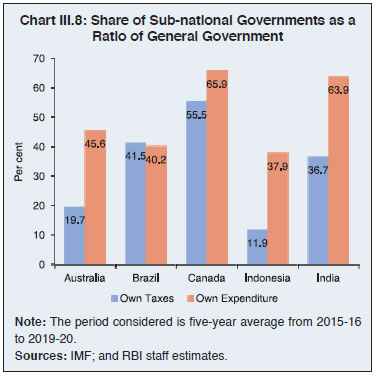 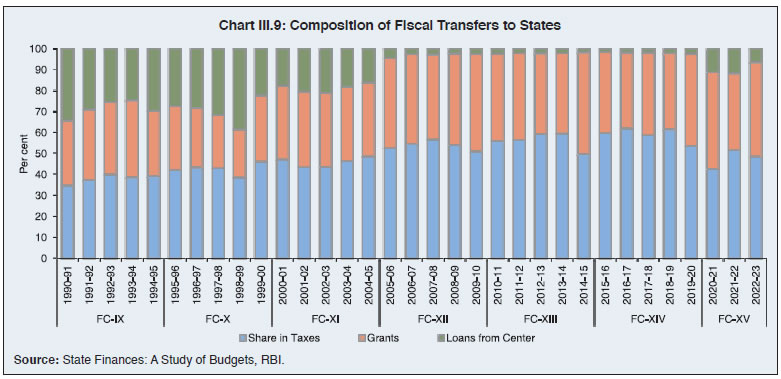 3.20 States’ dependence on fiscal transfers, reflected in the share of transfers in total expenditure, increased sharply during the pandemic-period of 2020-21 and 2021-22 but it has moderated to 40 per cent in 2022-23 (Chart III.10). Even though the transfers help the State governments to undertake higher expenditures, they could adversely impact their tax effort and collection of own tax revenues (Jha et al. 2000; Kim 2007; Liu and Zhao 2011; Garg et. al., 2016). 3.1 Tax Devolution 3.21 The tax devolution from the Centre to the States under various Finance Commissions can be divided into two main phases. In the first phase, the period up to the Tenth Finance Commission (1952 to 2000), the Constitution provided for mandatory sharing of net proceeds of only two types of taxes, income tax and Union excise duties (Table III.3). Thereafter, with the 80th Amendment of the Constitution in 2000, the divisible pool of taxes was considerably widened and all taxes in the Union List (except the duties and taxes referred to in Articles 268, 269 and 269-A, surcharges and any cess levied for a specific purpose under an Act of Parliament) became shareable with States from the Eleventh Finance Commission (FC-XI) onwards (Reddy and Reddy, 2019). 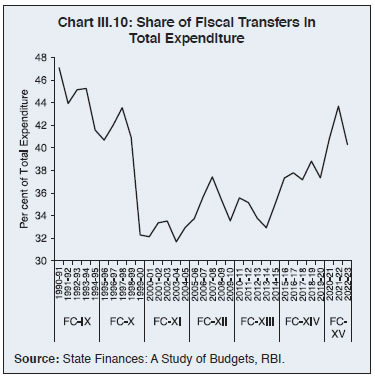 3.22 The FC-XI (2000-01 to 2004-05) recommended States’ share in the divisible pool of taxes at 29.5 per cent. Since then, successive Finance Commissions have made increments in the devolution ratio, with FC-XIV making a radical departure by recommending a significantly higher share in view of the abolition of the Planning Commission and cessation of plan grants, thus making tax devolution the primary vehicle for federal transfers (RBI, 2021). Nevertheless, the actual tax devolution to States has trailed the recommended share due to cesses and surcharges that are excluded from the divisible pool of Union taxes (Chart III.11). 3.23 The Constitution requires the Finance Commission to make recommendations for the distribution of net proceeds of taxes between Union and States (vertical devolution) as well as the allocation among the States of such proceeds (horizontal devolution). Over the years, altogether twelve criteria have been adopted by Finance Commissions for determining horizontal devolution across States (Reddy and Reddy, 2019). Population has been used as a criterion by all Finance Commissions because the larger the population of a State, the greater would be its expenditure needs. The area of a State was introduced as a criterion by FC-X as it was felt that the cost of providing basic administrative infrastructure and services is higher in States which have a larger area and lower density of population (Table III.4). Forest cover was introduced by FC-XIV as a measure of fiscal disability because even though forests provide ecological benefits, there is an opportunity cost associated with them in terms of area not available for other economic activities. 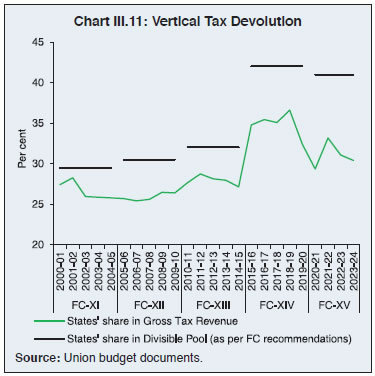 3.24 Income distance, defined as the distance of State’s per capita GSDP from the State with the highest per capita GSDP, remains the dominant criterion for determining horizontal devolution based on equity considerations. The index of infrastructure, introduced by FC-X to help States with poor infrastructure, was discontinued from FC-XII. FC-X introduced tax effort as a criterion for horizontal devolution to reward States with higher tax collections. Additionally, FC-XI introduced fiscal discipline as a criterion to motivate the States for undertaking fiscal consolidation. However, these efficiency criteria were removed by FC-XIV, while FC-XV assigned a weight of only 2.5 per cent to tax effort. Overall, from FC-X to FC-XV, there has been an increase in the share of need-based parameters while both equity- and efficiency-based parameters have seen a decline in their weights (Chart III.12). 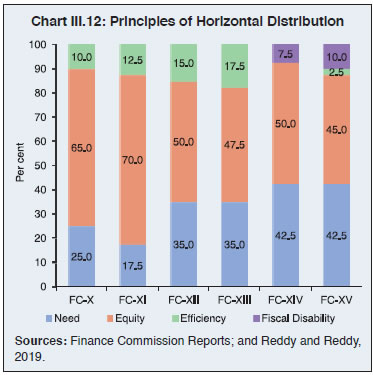 Impact of Cess and Surcharge 3.25 A cess is a special kind of tax levied by the Government to raise funds for a pre-determined earmarked purpose. This earmarking protects certain categories of expenditures from the vagaries of the political process by linking them to a particular revenue source (McCleary, 1989). On the other hand, in case of surcharge - a tax on tax - there is no requirement to stipulate the purpose or end use at the time of levy. In India, surcharges have typically been levied on the highest income tax rate slabs to ensure that a greater share of the tax burden rests on the relatively well-off taxpayers. While cess and surcharge are fundamentally distinct concepts, under Article 270 of the Indian Constitution, the revenue collected from both cess and surcharge are at the exclusive disposal of the Union government, i.e., these taxes are not required to be shared with the State governments. The revenue collected by the Union government from cesses increased from 6.4 per cent of its gross tax revenue in 2011-12 to 17.7 per cent in 2021-22 (Chart III.13). 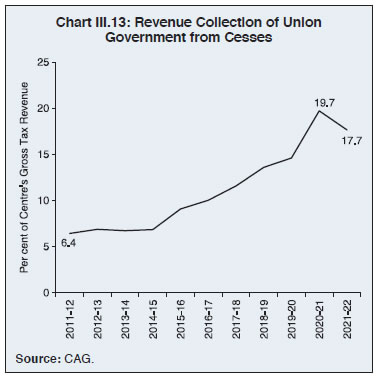 3.26 Major cesses currently in place include health and education cess levied at the rate of 4 per cent on income tax and corporation tax with an aim to improve the healthcare and educational facilities in rural and semi-urban areas; cess at the rate of 20 per cent on domestic production of crude oil and natural gas to meet the objectives set out in the Oil Industry (Development) Act, 1974; road and infrastructure cess levied as an additional duty of excise for the purpose of financing infrastructure projects; agriculture infrastructure and development cess levied as an additional duty of excise for the purpose of financing agricultural infrastructure and other development expenditure; and GST compensation cess on the supply of select goods, mostly belonging to luxury and demerit categories, for providing compensation to the States for the loss of revenue arising on account of implementation of the goods and services tax as per the provisions laid down in the Goods and Services Tax (Compensation to States) Act, 2017 (Table III.5). 3.27 Major surcharges levied by the Union government include surcharge on personal income tax for those with taxable income more than ₹50 lakh and surcharge on corporate income tax for those companies whose net income exceeds ₹1 crore. Due to increase in cesses and surcharges, the divisible pool has shrunk from 88.6 per cent of gross tax revenue in 2011-12 to 78.9 per cent in 2021-22 despite the 10 percentage point increase in tax devolution recommended by FC-XIV (Chart III.14a). The actual tax devolution to States hovered in the range of 3-4 per cent of GDP during the award period of FC-XIV and FC-XV as compared with around 2.7 per cent during the previous three finance commissions (Chart III.14b). Since the actual tax devolution hinges critically on the cesses and surcharges levied by the Centre, the States need to augment their own fiscal capacity and reduce dependence on transfers. 3.2 Grants from the Centre 3.28 States also receive funds by way of grants from the Centre, most important among them being the Centrally Sponsored Schemes (CSSs) and the Finance Commission grants. CSSs are special purpose grants extended by the Central Government to encourage and motivate the State governments to plan and implement programs that help attain national goals and objectives. The Finance Commission grants primarily function as general purpose grants, aimed at bridging the gap between a State’s assessed expenditure and projected revenue. Over time, however, the nature and purpose of these grants have evolved to address other specific issues such as modernisation of administration, relief from natural calamities and other public purposes. Total grants from the Centre to the States have increased considerably during the last two decades (Chart III.15a). The CSSs, which have received a major push from the Centre in the post-COVID period, now account for around two-thirds of the total grants (Chart III.15b). On the other hand, the Finance Commission grants constitute only around a quarter of the total grants from the Centre. 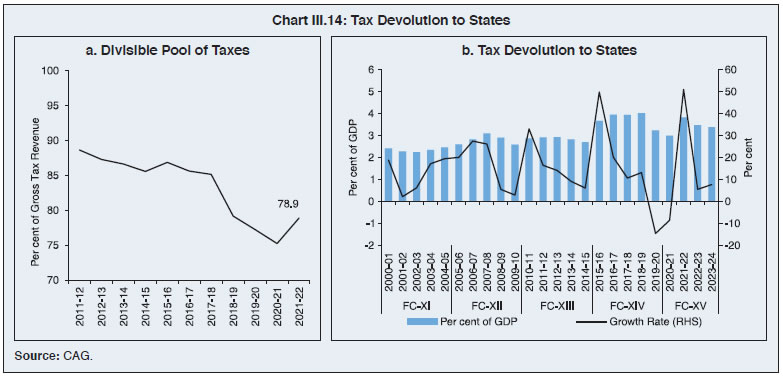 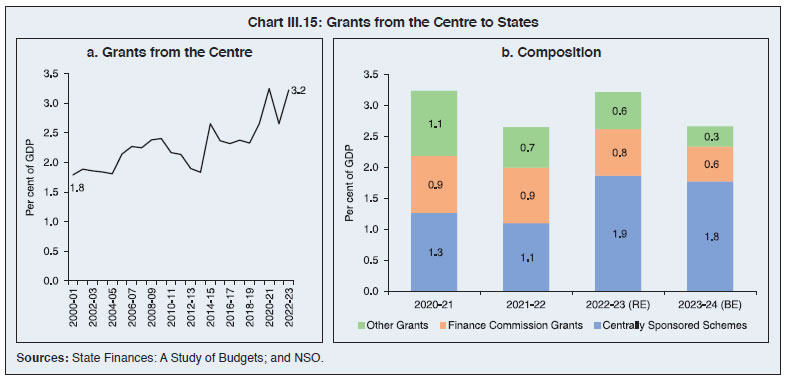 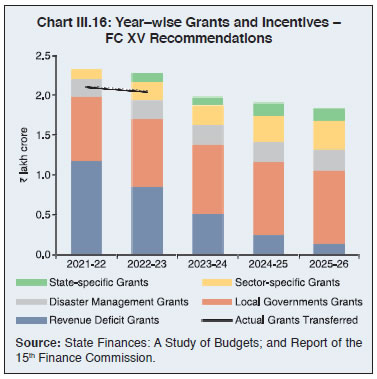 3.29 The FC-XV recommended grants-in-aid amounting to ₹10.3 lakh crore for the five-year period 2021-26. Of this, 42.3 per cent were earmarked for local governments, while 29 per cent were revenue deficit grants. The actual transfers during the first two years of FC-XV are marginally lower than the recommended amount (Chart III.16). 3.30 At a disaggregated level, hilly and north-eastern States are more dependent on Central transfers due to limited sources of own revenue. For many of these States, the Central grants account for more than 30 per cent of total revenue receipts. Among the larger States, Assam, Punjab, Andhra Pradesh, West Bengal, Madhya Pradesh, Bihar and Kerala are most reliant on the Central transfer, with a fifth of their revenue coming in the form of grants (Chart III.17). 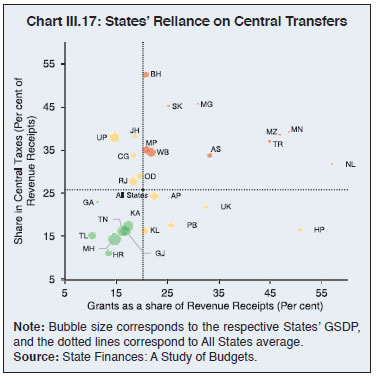 3.31 Growing public expenditure of States makes it an imperative to step up their revenue mobilisation efforts. The implementation of GST has been beneficial in this regard in view of increased tax buoyancy. The overall tax efforts of States in India are found to be fairly high. Nonetheless, they need to invest in augmenting fiscal/tax capacity by undertaking tax reforms and building a strong and innovative tax administration. Furthermore, there is considerable scope for increasing States’ non-tax revenue by periodic revisions of user charges on electricity and water and other public services, royalties and premia from mining and improved financial management of State PSUs. From a longer-term policy perspective, States would benefit from augmenting their own fiscal capacity while reducing dependence on transfers. 1 Tax buoyancy is the ratio of the growth in tax revenue to the growth in nominal GDP. A buoyancy of one implies that the taxes are growing at the same rate as GDP while a buoyancy of more than one indicates that the tax revenues are growing at a faster rate than GDP. 2 Real own tax revenue is obtained by dividing nominal own tax revenue with GDP deflator. 3 CAG State Finance audited reports, various years. 4 Interest receipts include interest on loans that are extended for various investments such as loans for housing schemes, agricultural activities, loans to government companies, treasury bills, etc. |
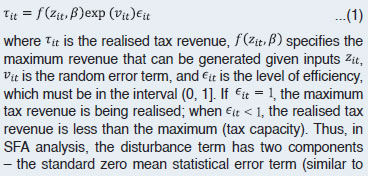
||||||||||||||||||||||||||||||||||||||


हे पेज शेअर करा:


भारतीय रिझर्व्ह बँक मोबाईल ॲप्लिकेशन इंस्टॉल करा आणि नवीनतम बातम्यांचा त्वरित ॲक्सेस मिळवा!
आमचे अॅप इंस्टॉल करण्यासाठी QR कोड स्कॅन करा


पेज अंतिम अपडेट तारीख:


