 IST,
IST,
III. The External Sector
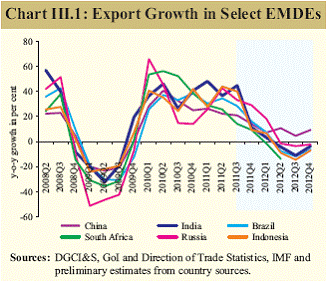
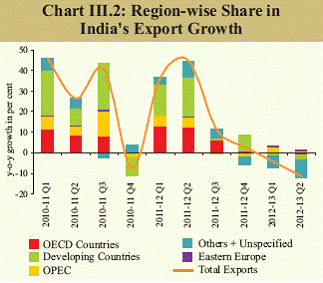
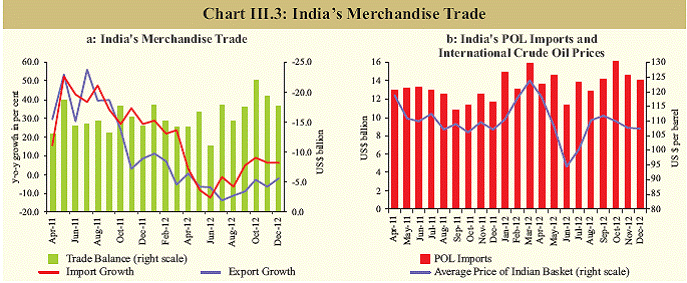
The CAD–GDP ratio reached a historic high of 5.4 per cent in Q2 of 2012-13, heightening concerns about the sustainability and financing of CAD. Worsening trade deficit and slower growth in services exports were the major factors behind the sharp rise in CAD. Weak external demand, which affected merchandise exports adversely, combined with continuing high imports of POL and gold, resulted in deterioration of the trade balance in Q3 of 2012-13. Despite the policy initiatives taken by the government, export revival is contingent on economic recovery in advanced economies as well as EMDEs. Even though capital flows have been sufficient to finance CAD for the time being, the volatility therein can put pressure on the external sector. Clearly, it is imperative to lower the CAD, while ensuring in the interim its prudent financing. Weak external demand continues to affect merchandise exports adversely III.1 India’s export performance continued to show the adverse impact of low growth and uncertainty in the advanced as well as major Emerging Market and Developing Economies (EMDEs). The downturn in the global manufacturing cycle in both advanced economies and EMDEs has impacted the overall world trade volume, which is also reflected in negative export growth of major EMDEs, including India, Brazil, Russia, South Africa and Indonesia (Chart III.1). Even though the export growth of China remains positive, it has also decelerated in the recent period. Despite policy actions, revival of export growth remains uncertain III.2 India’s subdued exports performance, which began in H2 of 2011-12, showed further deterioration during 2012-13 so far. Since the outlook for global growth remains weak, it is unlikely that exports will reach even the previous year’s level. Commoditywise data show that growth in exports of engineering goods, petroleum products, textile products, gems & jewellery and chemicals & related products was severely affected because demand conditions in key markets such as the US and Europe continued to remain sluggish. Demand from new export destinations explored under diversification efforts also weakened. For instance, apart from export growth to developed countries, export growth to developing countries has also either decelerated or declined in recent quarters (Chart III.2). During April-November 2012, EU accounted for 27.4 per cent of total decline in merchandise exports, followed by Singapore (21.0 per cent), China (20.7 per cent), Hong Kong (4.8 per cent) and Indonesia (4.6 per cent). Lower growth in export-oriented Asian economies caused by setbacks to global recovery has clearly weighed on India’s external demand from these economies. III.3 In view of the lacklustre performance of the exports sector, the government announced export promotion measures on December 26, 2012. These include (i) the extension of the interest subvention scheme for select employment-oriented sectors up to end-March 2014, (ii) the introduction of a pilot scheme of 2 per cent interest subvention for project exports through EXIM Bank for countries of the SAARC region, Africa and Myanmar, (iii) broadening the scope of the Focus Market Scheme, Special Focus Market Scheme and Market-Linked Focus Product Scheme and (iv) incentives for incremental exports to the US, EU and countries of Asia during the period January–March 2013 over the base period. To enhance the flow of credit to the export sector, the Reserve Bank introduced a US dollar-rupee swap facility for scheduled banks to support incremental Pre-shipment Export Credit in Foreign Currency (PCFC) by banks on January 14, 2013. Despite these measures, quick recovery in exports to major trading partners may not take place unless economic activity in both advanced economies and EMDEs picks up significantly. Continued high imports of POL and gold may widen India’s trade deficit further III.4 Import growth has surged since September 2012, mainly due to a pick-up in the quantum of POL (Chart III.3). With the uptrend in the international price of gold in recent months, gold imports stayed at an elevated level in recent months. On the other hand, non-oil non-gold imports registered a decline, reflecting a slowdown in domestic economic activity. III.5 With imports growth turning positive from September 2012 and exports growth remaining subdued, concerns regarding a deteriorating trade deficit have been reinforced. During April–December 2012, the trade deficit was 7.2 per cent higher than that in April– December 2011 (Table III.1). Going forward, apart from global and domestic growth conditions, the trend in POL and gold imports will be critical determinants of India’s overall trade deficit. III.6 Policy attempt so far has been to deftly balance the genuine interests of the gold business, as also the need of the savers to hedge against inflation, against the overwhelming need to dampen gold imports with a view to preserving current account and macro-financial stability. The gold demand in recent years has also picked up for speculative purposes. Against this backdrop, the Reserve Bank had constituted a Working Group to Study the Issues Related to Gold and Gold Loans by NBFCs in India (Chairman: Shri K.U.B. Rao). The Group, in its report, noted that high gold imports have implications for external sector vulnerability. The Group has recommended measures to contain gold demand like introduction of new gold-backed financial products, supply management measures such as channelising the existing supply of scrap gold, and the introduction of tax incentives on gold-related instruments as well as steps to increase the monetisation of gold. The Reserve Bank placed the report of the Group on its website on January 2, 2013 for comments from stakeholders and the public.
III.7 Besides enhancing the customs duty from 4 per cent to 6 per cent on gold imports, the government has proposed to unfreeze or release a part of the gold physically held by mutual funds under Gold ETFs and enable them to deposit the gold with banks under the Gold Deposit Scheme. The minimum quantity as well as minimum tenure of gold deposits (from 3 years to 6 months) have been reduced. Concerns about sustainability of CAD heighten as the CAD–GDP ratio reaches a historic high in Q2 of 2012-13 III.8 India’s current account deficit (CAD) increased further in Q2 of 2012-13 mainly due to the worsening trade deficit, decelerated growth in net export of services and higher outflows under primary income (Table III.2). The CAD–GDP ratio at 5.4 per cent is not only unsustainable, but is also the highest-ever peak level. Early indications are that in Q3 of 2012- 13, CAD as a percentage of GDP may increase further from this peak. Subdued growth conditions in major advanced economies seem to have impacted growth in India’s export of software services in recent quarters. However, results of major IT firms for Q3 of 2012-13 suggest some improvement in their dollar revenues. Even though global IT spending is projected to increase by 4.2 per cent in 2013, uncertainty regarding global recovery continues to be one of the downward risks for India’s software exports. Unless global economic and trade conditions improve significantly and boost India’s export of goods and services, the high CAD may continue to be challenging.
Strong capital flows facilitate financing of CAD III.9 BoP statistics shows that improved capital flows were about adequate to finance an expanding CAD during Q2 of 2012-13, as evident from only a marginal drawdown of foreign exchange reserves (Table III.3). III.10 While net inflows under FDI moderated somewhat during April-November 2012, net inflows by foreign institutional investors (FII) have shown a significant uptrend. Net FII inflows during 2012-13 (up to January 18) at US$ 18.8 billion were significantly higher than during the corresponding period of the previous year (US$ 7.6 billion), thus providing temporary comfort for financing of CAD (Table III.4). III.11 Besides improved global liquidity and sentiment, robust FII inflows were largely the outcome of improved perception about the domestic economy, driven by recent reforms announced by the government since September 2012. These reforms include, inter alia, liberalised FDI norms for the retail, insurance and pension sectors, a roadmap for fiscal consolidation and an increase in FII limits in the corporate and government debt markets. The FII investment limits in government securities and corporate bonds were raised by US$ 5 billion each, taking the total investment limit in domestic debt (including corporate debt for infrastructure) to US$ 75 billion. While the increased limit may enhance debt inflows, they do not provide a solution to CAD financing on a sustainable basis. III.12 Much of the recent FII investment under the G-sec limits has flown into short term T-bills, enhancing the refinancing risks to external debt. On the other hand, a range-bound currency after a bout of depreciation has made the Indian equity market attractive for FIIs. Going forward, the implementation and acceleration in domestic reforms would be critical for sustained equity flows to the economy. Though the risk aversion in global markets declined during the previous quarter, the flows could be volatile given the euro area risks.
III.13 Benefitting from higher interest rates and a weakening rupee, non-resident Indians (NRIs) nearly doubled their deposits with banks in India during April–November 2012 compared with the corresponding period of 2011-12. Net flow through external commercial borrowings (ECBs) was higher during Q3 of 2012-13 compared to previous quarter, despite high principal repayments made by the Indian corporate sector. ECBs were mainly raised for the import of capital goods, new projects and the redemption of FCCBs. After depreciating in October and November, the rupee exchange rate was range bound in December 2012 III.14 The rupee had recovered in September 2012 due to the announcement of various reform measures by the government and increasing global risk appetite. However, challenged by concerns relating to high CAD and uncertainty regarding domestic growth, the rupee again showed a downtrend during October and November 2012 and subsequently remained range bound (`54.2–55.1 per US dollar) in December 2012. Reflecting the trend in the rupee in nominal terms, the REER based on 6-currency and 36-currency as on January 18, 2013 showed a depreciation of 3.5 per cent and 3.9 per cent, respectively, over end-March 2012 (Table III.5). External debt witnessed steep rise in Q2 of 2012-13 III.15 India’s external debt as at end-September 2012 was significantly higher than in the preceding quarter, with a rise in both longterm as well as short-term components of debt (Table III.6). In particular, there was a surge in non-resident external rupee-denominated deposits (NRE), reflecting the continued interest shown by non-residents due to better returns and rupee depreciation.
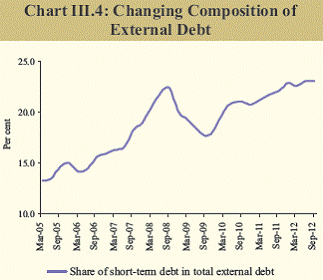
Composition of external debt changes with greater share of short-term debt III.16 The share of short-term debt in the composition of external debt has been rising in recent years, except for a dip in the immediate aftermath of the financial crisis (Chart III.4). The dip in share of short-term debt immediately after the financial crisis was mainly due to a deceleration in short-term trade credit. The reversal in this trend has been on account of rising short-term trade credit and FII investment in government T-bills and some other instruments. External vulnerability indicators showed mixed trend in Q2 of 2012-13 III.17 The trends in the external vulnerability indicators were mixed in Q2. While the ratio of external debt (measured in terms of the rupee) to GDP showed marginal improvement, the ratio of short-term debt (original maturity) to external debt stayed at the same level as in the preceding quarter. However, the ratio of foreign exchange reserves to external debt deteriorated (Table III.7).
III.18 India’s net international investment position (NIIP), as represented by net international liabilities, increased to US$ 271.5 billion at end-September 2012 from US$ 223.8 billion at end-June 2012. The rise in net liabilities occurred mainly due to a significant increase in liabilities and the valuation changes emanating from exchange rate movements. Accordingly, the NIIP-GDP ratio at end- September 2012 deteriorated compared with that at end-June 2012 (Table III.8). India’s NIIP has shown gradual deterioration during the post-crisis period, as net international liabilities as a per cent of GDP increased from 5.5 per cent as at end-March 2008 to 15.3 per cent as at end-September 2012 due to the widening current account deficit. III.19 In sum, concerns about the sustainability of India’s external sector have increased. Despite the second round of export promotion measures announced by the government, uncertainty relating to recovery in global economic and trade conditions may continue to weigh on India’s exports. In order to bring the CAD on a sustainable path, the trends in India’s imports, particularly POL and gold imports, need close monitoring. Even though the recent policy announcements in advanced economies have eased the global financial stress, re-acceleration of economic activity which is critical for recovery in global trade prospects may take time. Growth prospects for EMDEs also needs to improve in order to strengthen external demand for India. Even though abundant global liquidity augurs well for capital flows to economies like India, lowering CAD is important even as a sound domestic economic and business environment would continue to be critical to facilitate sustained capital flows and financing of CAD without stress. |
|||||||||||||||||||||||||||||||||||||||||||||||||||||||||||||||||||||||||||||||||||||||||||||||||||||||||||||||||||||||||||||||||||||||||||||||||||||||||||||||||||||||||||||||||||||||||||||||||||||||||||||||||||||||||||||||||||||||||||||||||||||||||||||||||||||||||||||||||||||||||||||||||||||||||||||||||||||||||||||||||||||||||||||||||||||||||||||||||||||||||||||||||||||||||||||||||||||||||||||||||||||||||||||||||||||||||||||||||||||||||||||||||||||||||||||||||||||||||||||||||||||||||||||||||||||||||||||||||||||||||||||||||||||||||||||||||||||||||||||||||||||||||||||||||||||||||||||||||||||||||||||||||||||||||||||||||||||||||||||||||||||||||||||||||||||||||||||||||||||||||||||||||||||||||||||||||||||||||||||||||||||||||||||||||||||||||||||||||||||||||||||||||||||||||||||||||||||||||||||||||||||||||||||||||||||||||||||||||||||||||||||||||||||||||||||||||||||||||||||||||||||||||||||||||||||||||||||||||||||||
पेज अंतिम अपडेट तारीख:


