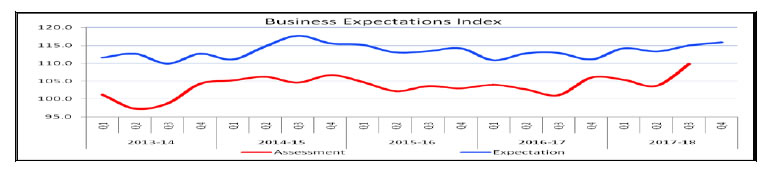
Today, the Reserve Bank released results of the 80th round of the Industrial Outlook Survey (IOS) conducted in October-December 2017. The survey captures qualitative assessments of the business situation by companies in the Indian manufacturing sector for Q3:2017-18 and their expectations for Q4:2017-181. Responses were received from 1299 companies in this round of the survey. Highlights: 1. Assessment for Q3: 2017-18 1.1 Respondents were optimistic about demand conditions in Q3:2017-18, as revealed in their assessment of production, order books, capacity utilisation, imports and employment. 1.2 With input (raw material) price pressures persisting and pricing power still constrained by sluggish demand conditions, respondents perceived profit margins declining in Q3:2017-18. 1.3 Overall, business sentiment in the Indian manufacturing sector improved, as reflected in the Business Expectations Index (BEI)2 rising from 103.7 in Q2:2017-18 to 109.8 in Q3:2017-18. 2. Expectations for Q4: 2017-18 2.1 Respondents retained their optimistic outlook on demand conditions for Q4:2017-18 at broadly the level in the previous round of the survey. 2.2 There was a marginal dip in optimism with respect to capacity utilisation and exports. 2.3 Availability of finance from different sources is expected to improve in Q4:2017-18. 2.4 While sentiments on raw material prices turned more negative, pricing power may improve keeping the profit margin subdued and broadly at the level of the previous round of the survey. 2.5 The BEI improved marginally from 115.0 in Q3:2017-18 to 115.8 in Q4:2017-18. | Summary Table on Net response3 (in per cent) | | Parameters | Assessment period | Expectation period | | Q2:2017-18 | Q3:2017-18 | Q3:2017-18 | Q4:2017-18 | | Production | 16.4 | 22.1 | 34.3 | 34.1 | | Order Books | 12.1 | 19.2 | 29.9 | 30.3 | | Pending Orders | 13.7 | 9.5 | 6.7 | 5.7 | | Capacity Utilisation | 7.1 | 11.3 | 20.8 | 19.5 | | Exports | 8.8 | 7.8 | 19.0 | 16.6 | | Imports | 8.9 | 9.1 | 12.8 | 13.5 | | Employment | 7.3 | 8.4 | 10.4 | 11.7 | | Financial Situation (Overall) | 15.8 | 17.1 | 28.7 | 28.6 | | Availability of Finance (from internal accruals) | 13.7 | 13.8 | 20.2 | 21.4 | | Availability of Finance (from banks & other sources) | 13.8 | 14.0 | 14.1 | 16.5 | | Availability of Finance (from overseas, if applicable) | 5.0 | 4.0 | 4.1 | 6.6 | | Cost of Finance | -0.5 | -3.1 | -2.2 | -4.1 | | Cost of Raw Material | -41.8 | -42.7 | -31.9 | -34.0 | | Selling Price | -0.1 | 4.5 | 7.0 | 7.9 | | Profit Margin | -14.0 | -10.0 | 1.8 | 0.1 | | Overall Business Situation | 17.3 | 23.9 | 36.9 | 36.1 | | Salary | 34.5 | 27.2 | 23.9 | 22.9 |
| Table 1: Assessment & Expectation for Production | | (Percentage responses)@ | | Quarter | Total response | Assessment | Expectation | | Increase | Decrease | No change | Net response# | Increase | Decrease | No change | Net response# | | Q3:2016-17 | 1221 | 32.0 | 21.2 | 46.8 | 10.8 | 40.9 | 12.0 | 47.2 | 28.9 | | Q4:2016-17 | 1244 | 35.8 | 17.8 | 46.4 | 18.0 | 41.1 | 13.3 | 45.6 | 27.8 | | Q1:2017-18 | 1250 | 34.5 | 18.5 | 46.9 | 16.0 | 41.6 | 11.7 | 46.7 | 29.9 | | Q2:2017-18 | 1141 | 34.9 | 18.5 | 46.6 | 16.4 | 42.2 | 12.0 | 45.8 | 30.2 | | Q3:2017-18 | 1299 | 36.8 | 14.7 | 48.5 | 22.1 | 43.4 | 9.1 | 47.5 | 34.3 | | Q4:2017-18 | | | | | | 42.5 | 8.4 | 49.7 | 34.1 | ‘Increase’ in production is optimistic.
@: Due to rounding off percentage may not add up to 100.
#: Net Response (NR) is the difference of percentage of the respondents reporting optimism and that reporting pessimism. The range is -100 to 100. Any value greater than zero indicates expansion and any value less than zero indicates contraction. |
| Table 2: Assessment & Expectation for Order Books | | (Percentage responses) | | Quarter | Total response | Assessment | Expectation | | Increase | Decrease | No change | Net response | Increase | Decrease | No change | Net response | | Q3:2016-17 | 1221 | 29.1 | 22.0 | 48.9 | 7.1 | 36.4 | 11.7 | 51.9 | 24.7 | | Q4:2016-17 | 1244 | 34.8 | 19.2 | 46.0 | 15.6 | 35.1 | 14.2 | 50.7 | 20.9 | | Q1:2017-18 | 1250 | 32.7 | 19.0 | 48.3 | 13.7 | 39.5 | 11.5 | 49.0 | 28.0 | | Q2:2017-18 | 1141 | 31.8 | 19.7 | 48.5 | 12.1 | 39.7 | 11.7 | 48.6 | 28.0 | | Q3:2017-18 | 1299 | 35.4 | 16.2 | 48.4 | 19.2 | 39.6 | 9.6 | 50.8 | 29.9 | | Q4:2017-18 | | | | | | 40.5 | 10.2 | 49.3 | 30.3 | | ‘Increase’ in order books is optimistic. Footnotes ‘@’ and ‘#’ given in Table 1 are applicable here. |
| Table 3: Assessment & Expectation for Pending Orders | | (Percentage responses) | | Quarter | Total response | Assessment | Expectation | | Below Normal | Above Normal | Normal | Net response | Below Normal | Above Normal | Normal | Net response | | Q3:2016-17 | 1222 | 19.0 | 5.3 | 75.7 | 13.7 | 12.9 | 6.7 | 80.4 | 6.2 | | Q4:2016-17 | 1244 | 18.1 | 5.1 | 76.9 | 13.0 | 15.3 | 5.0 | 79.7 | 10.3 | | Q1:2017-18 | 1250 | 17.0 | 5.7 | 77.3 | 11.3 | 13.4 | 4.9 | 81.8 | 8.5 | | Q2:2017-18 | 1141 | 17.9 | 4.2 | 77.9 | 13.7 | 12.5 | 6.5 | 81.0 | 6.0 | | Q3:2017-18 | 1299 | 16.2 | 6.7 | 77.1 | 9.5 | 11.4 | 4.7 | 83.9 | 6.7 | | Q4:2017-18 | | | | | | 12.5 | 6.8 | 80.7 | 5.7 | | Pending orders ‘Below Normal’ is optimistic. Footnotes ‘@’ and ‘#’ given in Table 1 are applicable here. |
| Table 4: Assessment & Expectation for Capacity Utilisation (Main Product) | | (Percentage responses) | | Quarter | Total response | Assessment | Expectation | | Increase | Decrease | No change | Net response | Increase | Decrease | No change | Net response | | Q3:2016-17 | 1222 | 20.2 | 17.9 | 61.9 | 2.3 | 27.4 | 10.2 | 62.5 | 17.2 | | Q4:2016-17 | 1244 | 25.9 | 15.7 | 58.4 | 10.2 | 27.6 | 11.2 | 61.2 | 16.4 | | Q1:2017-18 | 1250 | 22.5 | 15.4 | 62.0 | 7.1 | 28.1 | 10.9 | 61.0 | 17.2 | | Q2:2017-18 | 1141 | 22.9 | 15.8 | 61.3 | 7.1 | 27.6 | 11.3 | 61.1 | 16.3 | | Q3:2017-18 | 1299 | 23.9 | 12.7 | 63.4 | 11.3 | 28.8 | 8.0 | 63.2 | 20.8 | | Q4:2017-18 | | | | | | 28.4 | 8.9 | 62.7 | 19.5 | | ‘Increase’ in capacity utilisation is optimistic. Footnotes ‘@’ and ‘#’ given in Table 1 are applicable here. |
| Table 5: Assessment & Expectation for Level of CU (compared to the average in last 4 quarters) | | (Percentage responses) | | Quarter | Total response | Assessment | Expectation | | Above Normal | Below Normal | Normal | Net response | Above Normal | Below Normal | Normal | Net response | | Q3:2016-17 | 1222 | 8.7 | 16.4 | 74.9 | -7.7 | 10.8 | 11.5 | 77.7 | -0.7 | | Q4:2016-17 | 1244 | 9.3 | 16.1 | 74.6 | -6.8 | 10.6 | 12.9 | 76.5 | -2.3 | | Q1:2017-18 | 1250 | 8.4 | 15.1 | 76.5 | -6.7 | 9.9 | 12.2 | 77.9 | -2.3 | | Q2:2017-18 | 1141 | 9.7 | 15.6 | 74.7 | -6.0 | 9.7 | 10.8 | 79.5 | -1.1 | | Q3:2017-18 | 1299 | 10.3 | 14.1 | 75.6 | -3.8 | 11.4 | 9.6 | 79.0 | 1.8 | | Q4:2017-18 | | | | | | 13.0 | 10.7 | 76.3 | 2.3 | | ‘Above Normal’ in Level of capacity utilisation is optimistic. Footnotes ‘@’ and ‘#’ given in Table 1 are applicable here. |
| Table 6: Assessment & Expectation for Assessment of Production Capacity (with regard to expected demand in next 6 months) | | (Percentage responses) | | Quarter | Total response | Assessment | Expectation | | More than adequate | Less than adequate | Adequate | Net response | More than adequate | Less than adequate | Adequate | Net response | | Q3:2016-17 | 1222 | 12.3 | 9.1 | 78.6 | 3.2 | 14.2 | 7.4 | 78.4 | 6.8 | | Q4:2016-17 | 1244 | 14.1 | 7.1 | 78.7 | 7.0 | 11.9 | 7.4 | 80.7 | 4.5 | | Q1:2017-18 | 1250 | 12.3 | 7.4 | 80.3 | 4.9 | 13.3 | 6.7 | 79.9 | 6.6 | | Q2:2017-18 | 1141 | 10.4 | 7.4 | 82.2 | 3.0 | 12.2 | 6.6 | 81.2 | 5.6 | | Q3:2017-18 | 1299 | 11.8 | 7.1 | 81.1 | 4.7 | 11.1 | 6.5 | 82.4 | 4.6 | | Q4:2017-18 | | | | | | 12.9 | 6.9 | 80.2 | 6.0 | | ‘More than adequate’ in Assessment of Production Capacity is optimistic. Footnotes ‘@’ and ‘#’ given in Table 1 are applicable here. |
| Table 7: Assessment & Expectation for Exports | | (Percentage responses) | | Quarter | Total response | Assessment | Expectation | | Increase | Decrease | No change | Net response | Increase | Decrease | No change | Net response | | Q3:2016-17 | 1221 | 22.9 | 18.5 | 58.6 | 4.4 | 24.3 | 13.2 | 62.5 | 11.2 | | Q4:2016-17 | 1244 | 24.3 | 17.7 | 58.0 | 6.6 | 25.3 | 13.2 | 61.5 | 12.1 | | Q1:2017-18 | 1250 | 22.2 | 18.8 | 59.0 | 3.4 | 26.5 | 11.3 | 62.2 | 15.2 | | Q2:2017-18 | 1141 | 24.2 | 15.4 | 60.4 | 8.8 | 27.9 | 11.6 | 60.5 | 16.3 | | Q3:2017-18 | 1299 | 22.5 | 14.7 | 62.8 | 7.8 | 27.6 | 8.6 | 63.8 | 19.0 | | Q4:2017-18 | | | | | | 25.4 | 8.8 | 65.8 | 16.6 | | ‘Increase’ in exports is optimistic. Footnotes ‘@’ and ‘#’ given in Table 1 are applicable here. |
| Table 8: Assessment & Expectation for Imports | | (Percentage responses) | | Quarter | Total response | Assessment | Expectation | | Increase | Decrease | No change | Net response | Increase | Decrease | No change | Net response | | Q3:2016-17 | 1221 | 17.9 | 11.7 | 70.4 | 6.2 | 18.1 | 9.4 | 72.5 | 8.7 | | Q4:2016-17 | 1244 | 17.5 | 10.7 | 71.8 | 6.8 | 17.7 | 9.3 | 73.1 | 8.4 | | Q1:2017-18 | 1250 | 17.4 | 10.3 | 72.2 | 7.1 | 17.3 | 7.2 | 75.5 | 10.1 | | Q2:2017-18 | 1141 | 17.1 | 8.2 | 74.7 | 8.9 | 18.6 | 7.9 | 73.5 | 10.7 | | Q3:2017-18 | 1299 | 18.2 | 9.1 | 72.7 | 9.1 | 17.8 | 5.0 | 77.2 | 12.8 | | Q4:2017-18 | | | | | | 19.7 | 6.2 | 74.1 | 13.5 | | ‘Increase’ in imports is optimistic. Footnotes ‘@’ and ‘#’ given in Table 1 are applicable here. |
| Table 9: Assessment & Expectation for level of Raw Materials Inventory | | (Percentage responses) | | Quarter | Total response | Assessment | Expectation | | Below average | Above average | Average | Net response | Below average | Above average | Average | Net response | | Q3:2016-17 | 1221 | 7.3 | 11.7 | 81.2 | -4.4 | 5.2 | 10.3 | 84.5 | -5.2 | | Q4:2016-17 | 1244 | 6.9 | 12.4 | 81.1 | -5.5 | 6.8 | 9.0 | 84.2 | -2.2 | | Q1:2017-18 | 1250 | 6.7 | 12.2 | 81.2 | -5.5 | 6.1 | 8.7 | 85.2 | -2.6 | | Q2:2017-18 | 1141 | 6.2 | 13.1 | 80.8 | -6.9 | 6.1 | 10.7 | 83.2 | -4.6 | | Q3:2017-18 | 1299 | 6.0 | 14.6 | 79.4 | -8.6 | 4.3 | 10.4 | 85.4 | -6.1 | | Q4:2017-18 | | | | | | 6.0 | 11.5 | 82.5 | -5.5 | | ‘Below average’ Inventory of raw materials is optimistic. Footnotes ‘@’ and ‘#’ given in Table 1 are applicable here. |
| Table 10: Assessment & Expectation for level of Finished Goods Inventory | | (Percentage responses) | | Quarter | Total response | Assessment | Expectation | | Below average | Above average | Average | Net response | Below average | Above average | Average | Net response | | Q3:2016-17 | 1221 | 6.4 | 15.3 | 78.3 | -8.9 | 4.5 | 12.5 | 83.0 | -7.9 | | Q4:2016-17 | 1244 | 7.3 | 16.6 | 76.1 | -9.3 | 6.5 | 11.6 | 81.9 | -5.1 | | Q1:2017-18 | 1250 | 6.8 | 14.2 | 79.0 | -7.5 | 6.4 | 10.7 | 82.8 | -4.3 | | Q2:2017-18 | 1141 | 7.1 | 15.9 | 77.0 | -8.8 | 6.0 | 11.6 | 82.4 | -5.6 | | Q3:2017-18 | 1299 | 6.9 | 14.5 | 78.6 | -7.6 | 6.2 | 10.0 | 83.8 | -3.8 | | Q4:2017-18 | | | | | | 6.5 | 10.9 | 82.6 | -4.4 | | ‘Below average’ Inventory of finished goods is optimistic. Footnotes ‘@’ and ‘#’ given in Table 1 are applicable here. |
| Table 11: Assessment & Expectations for Employment Outlook | | (Percentage responses) | | Quarter | Total response | Assessment | Expectation | | Increase | Decrease | No change | Net response | Increase | Decrease | No change | Net response | | Q3:2016-17 | 1221 | 13.5 | 9.7 | 76.8 | 3.8 | 14.7 | 5.6 | 79.7 | 9.1 | | Q4:2016-17 | 1244 | 15.9 | 9.3 | 74.9 | 6.6 | 12.1 | 6.9 | 81.0 | 5.2 | | Q1:2017-18 | 1250 | 14.6 | 9.2 | 76.2 | 5.4 | 15.9 | 6.6 | 77.5 | 9.3 | | Q2:2017-18 | 1141 | 15.5 | 8.2 | 76.3 | 7.3 | 15.2 | 6.5 | 78.3 | 8.7 | | Q3:2017-18 | 1299 | 15.8 | 7.4 | 76.8 | 8.4 | 15.8 | 5.3 | 78.9 | 10.4 | | Q4:2017-18 | | | | | | 17.0 | 5.3 | 77.7 | 11.7 | | ‘Increase’ in employment is optimistic. Footnotes ‘@’ and ‘#’ given in Table 1 are applicable here. |
| Table 12: Assessment & Expectation for Overall Financial Situation | | (Percentage responses) | | Quarter | Total response | Assessment | Expectation | | Better | Worsen | No change | Net response | Better | Worsen | No change | Net response | | Q3:2016-17 | 1221 | 26.0 | 14.1 | 59.9 | 11.9 | 33.9 | 6.8 | 59.3 | 27.1 | | Q4:2016-17 | 1244 | 30.6 | 13.6 | 55.9 | 17.0 | 34.1 | 9.5 | 56.4 | 24.6 | | Q1:2017-18 | 1250 | 30.9 | 11.8 | 57.2 | 19.1 | 37.9 | 7.0 | 55.1 | 30.9 | | Q2:2017-18 | 1141 | 29.0 | 13.2 | 57.7 | 15.8 | 35.6 | 7.7 | 56.6 | 27.9 | | Q3:2017-18 | 1299 | 28.6 | 11.4 | 60.0 | 17.2 | 35.3 | 6.6 | 58.1 | 28.7 | | Q4:2017-18 | | | | | | 35.2 | 6.6 | 58.2 | 28.6 | | ‘Better’ overall financial situation is optimistic. Footnotes ‘@’ and ‘#’ given in Table 1 are applicable here. |
| Table 13: Assessment & Expectation for Working Capital Finance Requirement | | (Percentage responses) | | Quarter | Total response | Assessment | Expectation | | Increase | Decrease | No change | Net response | Increase | Decrease | No change | Net response | | Q3:2016-17 | 1221 | 28.9 | 6.9 | 64.3 | 22.0 | 28.1 | 4.1 | 67.8 | 24.1 | | Q4:2016-17 | 1244 | 30.2 | 5.6 | 64.2 | 24.6 | 29.2 | 5.3 | 65.5 | 23.9 | | Q1:2017-18 | 1250 | 29.3 | 5.7 | 65.0 | 23.6 | 29.4 | 5.1 | 65.5 | 24.3 | | Q2:2017-18 | 1141 | 29.7 | 6.3 | 64.1 | 23.4 | 29.4 | 5.7 | 65.0 | 23.7 | | Q3:2017-18 | 1299 | 34.4 | 5.0 | 60.6 | 29.4 | 30.5 | 4.1 | 65.4 | 26.4 | | Q4:2017-18 | | | | | | 32.4 | 3.6 | 64.0 | 28.8 | | ‘Increase’ in working capital finance is optimistic. Footnotes ‘@’ and ‘#’ given in Table 1 are applicable here. |
| Table 14: Assessment & Expectation for Availability of Finance (from Internal Accruals) | | (Percentage responses) | | Quarter | Total response | Assessment | Expectation | | Improve | Worsen | No change | Net response | Improve | Worsen | No change | Net response | | Q3:2016-17 | 1221 | 21.6 | 11.7 | 66.7 | 9.9 | 25.2 | 5.0 | 69.8 | 20.2 | | Q4:2016-17 | 1244 | 25.6 | 10.3 | 64.1 | 15.3 | 25.4 | 8.0 | 66.6 | 17.4 | | Q1:2017-18 | 1250 | 23.5 | 9.5 | 67.0 | 14.1 | 27.5 | 6.2 | 66.3 | 21.3 | | Q2:2017-18 | 1141 | 23.2 | 9.5 | 67.3 | 13.7 | 26.8 | 6.4 | 66.9 | 20.4 | | Q3:2017-18 | 1299 | 22.2 | 8.4 | 69.4 | 13.8 | 25.8 | 5.6 | 68.6 | 20.2 | | Q4:2017-18 | | | | | | 26.6 | 5.2 | 68.2 | 21.4 | | ‘Improvement’ in availability of finance is optimistic. Footnotes ‘@’ and ‘#’ given in Table 1 are applicable here. |
| Table 15: Assessment & Expectation for Availability of Finance (from banks & other sources) | | (Percentage responses) | | Quarter | Total response | Assessment | Expectation | | Improve | Worsen | No change | Net response | Improve | Worsen | No change | Net response | | Q3:2016-17 | 1221 | 19.6 | 7.9 | 72.5 | 11.7 | 21.8 | 3.3 | 74.9 | 18.5 | | Q4:2016-17 | 1244 | 21.3 | 7.6 | 71.1 | 13.7 | 22.5 | 5.6 | 71.9 | 16.9 | | Q1:2017-18 | 1250 | 21.0 | 6.1 | 72.9 | 14.9 | 24.8 | 4.9 | 70.3 | 19.9 | | Q2:2017-18 | 1141 | 19.8 | 6.1 | 74.1 | 13.8 | 21.5 | 4.6 | 73.9 | 17.0 | | Q3:2017-18 | 1299 | 19.8 | 5.8 | 74.4 | 14.0 | 18.6 | 4.5 | 77.0 | 14.1 | | Q4:2017-18 | | | | | | 20.9 | 4.4 | 74.7 | 16.5 | | ‘Improvement’ in availability of finance is optimistic. Footnotes ‘@’ and ‘#’ given in Table 1 are applicable here. |
| Table 16: Assessment & Expectation for Availability of Finance (from overseas, if applicable) | | (Percentage responses) | | Quarter | Total response | Assessment | Expectation | | Improve | Worsen | No change | Net response | Improve | Worsen | No change | Net response | | Q3:2016-17 | 1221 | 9.1 | 4.8 | 86.1 | 4.3 | 10.3 | 2.0 | 87.7 | 8.3 | | Q4:2016-17 | 1244 | 8.1 | 3.3 | 88.6 | 4.8 | 10.0 | 3.5 | 86.5 | 6.5 | | Q1:2017-18 | 1250 | 9.5 | 3.7 | 86.8 | 5.8 | 9.8 | 2.8 | 87.4 | 7.0 | | Q2:2017-18 | 1141 | 8.0 | 3.0 | 89.0 | 5.0 | 10.9 | 3.9 | 85.2 | 7.0 | | Q3:2017-18 | 1299 | 7.9 | 3.9 | 88.2 | 4.0 | 7.2 | 3.0 | 89.8 | 4.1 | | Q4:2017-18 | | | | | | 9.2 | 2.6 | 88.2 | 6.6 | | ‘Improvement’ in availability of finance is optimistic. Footnotes ‘@’ and ‘#’ given in Table 1 are applicable here. |
| Table 17: Assessment & Expectation for Cost of Finance | | (Percentage responses) | | Quarter | Total response | Assessment | Expectation | | Decrease | Increase | No change | Net response | Decrease | Increase | No change | Net response | | Q3:2016-17 | 1221 | 12.9 | 16.1 | 71.1 | -3.2 | 9.4 | 16.9 | 73.8 | -7.5 | | Q4:2016-17 | 1244 | 15.8 | 16.7 | 67.6 | -0.9 | 14.5 | 14.8 | 70.8 | -0.3 | | Q1:2017-18 | 1250 | 13.6 | 14.8 | 71.6 | -1.2 | 12.9 | 15.4 | 71.7 | -2.5 | | Q2:2017-18 | 1141 | 14.0 | 14.5 | 71.6 | -0.5 | 10.9 | 14.7 | 74.5 | -3.8 | | Q3:2017-18 | 1299 | 11.6 | 14.5 | 73.9 | -3.1 | 11.9 | 14.1 | 74.0 | -2.2 | | Q4:2017-18 | | | | | | 9.8 | 13.9 | 76.3 | -4.1 | | ‘Decrease’ in cost of finance is optimistic. Footnotes ‘@’ and ‘#’ given in Table 1 are applicable here. |
| Table 18: Assessment & Expectation for Cost of Raw Materials | | (Percentage responses) | | Quarter | Total response | Assessment | Expectation | | Decrease | Increase | No change | Net response | Decrease | Increase | No change | Net response | | Q3:2016-17 | 1221 | 6.4 | 44.6 | 48.9 | -38.2 | 5.5 | 37.4 | 57.1 | -32.0 | | Q4:2016-17 | 1244 | 3.5 | 51.4 | 45.0 | -47.9 | 5.1 | 39.4 | 55.6 | -34.3 | | Q1:2017-18 | 1250 | 5.1 | 47.2 | 47.8 | -42.1 | 4.1 | 42.0 | 54.0 | -37.9 | | Q2:2017-18 | 1141 | 5.0 | 46.8 | 48.2 | -41.8 | 4.0 | 40.4 | 55.6 | -36.5 | | Q3:2017-18 | 1299 | 5.2 | 47.9 | 46.9 | -42.7 | 5.7 | 37.6 | 56.7 | -31.9 | | Q4:2017-18 | | | | | | 4.3 | 38.3 | 57.4 | -34.0 | | ‘Decrease’ in cost of raw materials is optimistic. Footnotes ‘@’ and ‘#’ given in Table 1 are applicable here. |
| Table 19: Assessment & Expectation for Selling Price | | (Percentage responses) | | Quarter | Total response | Assessment | Expectation | | Increase | Decrease | No change | Net response | Increase | Decrease | No change | Net response | | Q3:2016-17 | 1221 | 16.9 | 16.2 | 66.9 | 0.7 | 17.2 | 10.4 | 72.4 | 6.8 | | Q4:2016-17 | 1244 | 21.4 | 13.0 | 65.6 | 8.4 | 16.8 | 10.9 | 72.3 | 5.9 | | Q1:2017-18 | 1250 | 20.1 | 15.1 | 64.8 | 5.0 | 21.6 | 9.1 | 69.3 | 12.5 | | Q2:2017-18 | 1141 | 16.1 | 16.2 | 67.6 | -0.1 | 18.9 | 11.0 | 70.2 | 7.9 | | Q3:2017-18 | 1299 | 17.7 | 13.2 | 69.1 | 4.5 | 17.5 | 10.6 | 71.9 | 7.0 | | Q4:2017-18 | | | | | | 17.4 | 9.5 | 73.1 | 7.9 | | ‘Increase’ in selling price is optimistic. Footnotes ‘@’ and ‘#’ given in Table 1 are applicable here. |
| Table 20: Assessment & Expectation for Profit Margin | | (Percentage responses) | | Quarter | Total response | Assessment | Expectation | | Increase | Decrease | No change | Net response | Increase | Decrease | No change | Net response | | Q3:2016-17 | 1221 | 15.3 | 28.3 | 56.4 | -13.0 | 19.5 | 19.4 | 61.2 | 0.1 | | Q4:2016-17 | 1244 | 16.7 | 27.8 | 55.5 | -11.1 | 18.5 | 21.3 | 60.2 | -2.8 | | Q1:2017-18 | 1250 | 15.7 | 28.2 | 56.0 | -12.5 | 20.3 | 19.2 | 60.4 | 1.1 | | Q2:2017-18 | 1141 | 14.5 | 28.5 | 57.1 | -14.0 | 20.3 | 20.0 | 59.7 | 0.3 | | Q3:2017-18 | 1299 | 15.4 | 25.4 | 59.2 | -10.0 | 19.6 | 17.8 | 62.5 | 1.8 | | Q4:2017-18 | | | | | | 18.8 | 18.7 | 62.5 | 0.1 | | ‘Increase’ in profit margin is optimistic. Footnotes ‘@’ and ‘#’ given in Table 1 are applicable here. |
| Table 21: Assessment & Expectation for Overall Business Situation | | (Percentage responses) | | Quarter | Total response | Assessment | Expectation | | Better | Worsen | No change | Net response | Better | Worsen | No change | Net response | | Q3:2016-17 | 1221 | 29.4 | 16.4 | 54.2 | 13.0 | 40.1 | 8.7 | 51.2 | 31.3 | | Q4:2016-17 | 1244 | 36.3 | 14.3 | 49.5 | 22.0 | 39.4 | 11.5 | 49.1 | 27.9 | | Q1:2017-18 | 1250 | 34.4 | 13.0 | 52.6 | 21.4 | 43.6 | 7.6 | 48.8 | 36.0 | | Q2:2017-18 | 1141 | 31.7 | 14.4 | 53.9 | 17.3 | 42.7 | 9.0 | 48.4 | 33.7 | | Q3:2017-18 | 1299 | 35.1 | 11.2 | 53.7 | 23.9 | 42.9 | 6.0 | 51.1 | 36.9 | | Q4:2017-18 | | | | | | 42.5 | 6.4 | 51.2 | 36.1 | | ‘Better’ Overall Business Situation is optimistic. Footnotes ‘@’ and ‘#’ given in Table 1 are applicable here. |
| Table 22: Assessment & Expectation for Salary/Other Remuneration | | (Percentage responses) | | Quarter | Total response | Assessment | Expectation | | Increase | Decrease | No change | Net response | Increase | Decrease | No change | Net response | | Q3:2016-17 | 1222 | 28.9 | 2.8 | 68.3 | 26.1 | 26.6 | 2.0 | 71.4 | 24.7 | | Q4:2016-17 | 1244 | 30.0 | 2.7 | 67.3 | 27.3 | 25.0 | 3.3 | 71.8 | 21.7 | | Q1:2017-18 | 1250 | 42.1 | 2.7 | 55.2 | 39.4 | 38.8 | 2.2 | 59.0 | 36.6 | | Q2:2017-18 | 1141 | 36.7 | 2.2 | 61.2 | 34.5 | 34.5 | 2.5 | 63.0 | 32.0 | | Q3:2017-18 | 1299 | 29.4 | 2.2 | 68.4 | 27.2 | 25.9 | 2.0 | 72.1 | 23.9 | | Q4:2017-18 | | | | | | 25.2 | 2.3 | 72.5 | 22.9 | | ‘Increase in Salary / other remuneration’ is optimistic. Footnotes ‘@’ and ‘#’ given in Table 1 are applicable here. |
| Table 23: Business Expectations Index (BEI) | | Quarter | BEI-Assessment Quarter | BEI-Expectation Quarter | | Q3:2016-17 | 101.1 | 112.9 | | Q4:2016-17 | 106.0 | 111.1 | | Q1:2017-18 | 105.4 | 114.2 | | Q2:2017-18 | 103.7 | 113.3 | | Q3:2017-18 | 109.8 | 115.0 | | Q4:2017-18 | | 115.8 | Ajit Prasad
Assistant Adviser Press Release : 2017-2018/1973
|  IST,
IST,