 IST,
IST,


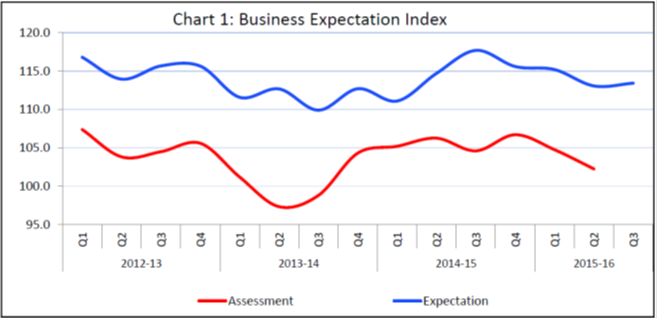
Industrial Outlook Survey- Q2:2015-16 (Round 71)
The Industrial Outlook Survey conducted during July-September 2015, provides qualitative assessment of business situation of companies in the Indian manufacturing sector for Q2:2015-16 and their expectation for the ensuing quarter Q3:2015-16. The survey elicited response from 1,304 manufacturing companies. Highlights:
 Assessment Quarter (Q2:2015-16)
Expectation Quarter (Q3:2015-16)
1 The 70th round (Q1:2015-16) survey results were released on August 4, 2015 on the RBI website. The survey results are those of the respondents and are not necessarily shared by the Reserve Bank of India. 2 Net Response (NR) is the difference of percentage of the respondents reporting optimism and that reporting pessimism. The range is -100 to 100. Any value greater than zero indicates expansion/optimism and any value less than zero indicates contraction/pessimism i.e., NR = (I – D); where, I is the percentage response of ‘Optimism’, and D is the percentage response of ‘Pessimism’ and E is the percentage response as ‘no change/equal’; I+D+E=100. For example, increase in production is optimism whereas decrease in cost of raw material is optimism (details are indicated in the relevant tables). 3 The Business Expectation Index (BEI) is a composite indicator calculated as weighted (share of GVA of different industry group) net response of nine business indicators. The nine indicators considered for computation of BEI are: (1) overall business situation, (2) production, (3) order books, (4) inventory of raw material, (5) inventory of finished goods, (6) profit margin, (7) employment, (8) exports and (9) capacity utilisation. It gives a single snapshot of business outlook in every quarter. BEI lies between 0 to 200, and 100 is the threshold separating expansion from contraction. | |||||||||||||||||||||||||||||||||||||||||||||||||||||||||||||||||||||||||||||||||||||||||||||||||||||||||||||||||||||||||||||||||||||||||||||||||||||||||||||||||||||||||||||||||||||||||||||||||||||||||||||||||||||||||||||||||||||||||||||||||||||||||||||||||||||||||||||||||||||||||||||||||||||||||||||||||||||||||||||||||||||||||||||||||||||||||||||||||||||||||||||||||||||||||||||||||||||||||||||||||||||||||||||||||||||||||||||||||||||||||||||||||||||||||||||||||||||||||||||||||||||||||||||||||||||||||||||||||||||||||||||||||||||||||||||||||||||||||||||||||||||||||||||||||||||||||||||||||||||||||||||||||||||||||||||||||||||||||||||||||||||||||||||||||||||||||||||||||||||||||||||||||||||||||||||||||||||||||||||||||||||||||||||||||||||||||||||||||||||||||||||||||||||||||||||||||||||||||||||||||||||||||||||||||||||||||||||||||||||||||||||||||||||||||||||||||||||||||||||||||||||||||||||||||||||||||||||||||||||||||||||||||||||||||||||||||||||||||||||||||||||||||||||||||||||||||||||||||||||||

हे पेज शेअर करा:


भारतीय रिझर्व्ह बँक मोबाईल ॲप्लिकेशन इंस्टॉल करा आणि नवीनतम बातम्यांचा त्वरित ॲक्सेस मिळवा!
आमचे अॅप इंस्टॉल करण्यासाठी QR कोड स्कॅन करा


पेज अंतिम अपडेट तारीख:


