4.1 The saving and investment process in an economy is organised around a financial framework that facilitates economic growth. A well designed financial system promotes growth through effective mobilisation of savings and their allocation to the most productive uses by either following a centralised approach or a decentralised approach or a combination of both. Typically, economies with underdeveloped capital markets adopt a centralised approach, whereby financial intermediaries mobilise resources from savers and allocate them to borrowers. Traditionally, banks have played a critical role in the financial intermediation process as they are able to deal more appropriately with transaction costs and information asymmetries in a financial system. As financial markets develop, transaction costs and information asymmetries reduce, the decentralised approach for guiding the saving-investment process also gains significance, and households with surplus resources increasingly invest in capital market instruments. The historical experience shows that virtually in all the economies, including the market-intermediated ones, banks have played a central role in resource mobilisation and supporting the growth process, and that the development of banks and other intermediaries has itself facilitated the development of financial markets.
4.2 The genesis of banks’ role in the resource mobilisation process lies in firms relying critically on external sources of finance, especially in their formative stages. In particular, banks have played a key role in coordinating investment efforts in many economies such as Belgium, Germany, Italy and Japan in engineering ‘take-offs’ during their critical phases of development. Resource mobilisation by banks became a critical factor in their ability to act as ‘catalysts’ of economic development. During the ‘take-off stages’ of these economies, large and powerful banks initially relied on capital contributions from a small number of founders and thereafter as their industrial lending portfolio grew, they took recourse to deposits as a major source of funds. With the development of markets, borrowings also became an important source of funds for the banks.
4.3 Historically, financial intermediation by banks has played a central role in India in supporting the growth process by mobilising savings, particularly after the nationalisation of the 14 major private banks in the late 1960s. Banks have been particularly instrumental in mobilising deposits from the household sector, the major surplus sector of the economy, which, in turn, has helped raise the financial savings of the household sector and hence the overall saving rate. Notwithstanding the liberalisation of the financial sector and increased competition from various other saving instruments, banks continue to play a dominant role in the financial intermediation of the Indian economy. The deregulation of interest rates has opened up new avenues for banks to mobilise funds at competitive rates. Moreover, banks, by virtue of being the ultimate platform for clearing and settlement for all financial transactions, provide accounts and resources to other sectors as also other financial intermediaries.
4.4 The Indian economy has witnessed robust growth performance in recent years and banks have played a major role in providing the required amount of resources. In order to sustain the growth process, banks would have to continue to provide funding on a large scale. In India, there exists an enormous potential of savings in rural and semi-urban areas. Also, in India quite a large part of domestic savings is locked up in unproductive physical assets. The mobilisation of savings from hitherto untapped areas and conversion of physical savings into financial savings would necessitate introduction of appropriate products to suit the demand of savers. Banks are indeed in an ideal position to do so because of certain inherent characteristics of deposits such as safety and liquidity.
4.5 Apart from mobilisation of deposits, banks, for meeting their resource needs, also depend on non-deposit resources both at home and abroad. A part of non-deposit resources comes from borrowings, which help augment the funding needs of the banks instantly. However, they also pose a challenge in terms of their availability and management of borrowing costs, amidst potential interest rate and exchange rate risks. Thus, an effective use of borrowings requires a system of appropriate risk management by banks.
4.6 Against this backdrop, this chapter analyses various aspects of resource mobilisation and identifies the scope and challenges faced by banks in the process of financial intermediation and supporting economic growth in India. The chapter is organised into six sections. Section II provides the theoretical underpinnings on the intermediation role of banks. Section III, after analysing the role played by financial intermediaries in mobilising resources based on the flow of funds of the Indian economy, examines in detail the various aspects of the deposit mobilisation process by banks in India. The significance of deposits in the liability structure of banks is also discussed in this section. Section IV covers the cross-country experiences regarding the role played by the banking sector in financially liberalised and globalised environment with a view to drawing appropriate lessons. Section V identifies the emerging issues and challenges faced by banks in India and makes suggestions, as the way forward, to meet effectively the challenge of resource mobilisation. Section VI concludes the chapter.
II. THEORETICAL UNDERPINNINGS
4.7 According to the traditional literature, the domestic financial system evolves through three different stages, viz., (a) the bank-oriented phase, (b) market-oriented phase and (c) strongly market-oriented phase. In the bank-oriented phase, the bulk of an economy’s savings is intermediated through banks in the form of deposits and transferred to the borrowers. Banks, thus, play a key role as financial intermediaries in reallocating the resources from surplus economic units (savers) to deficit economic units (borrowers). They perform this special role as they are perceived as intermediaries effective in ameliorating information asymmetries and inter-temporal transaction costs that form the central source of imperfections in a financial system. Risk capital is obtained from retained profits and direct recourse to promoters, who are fewer in number. In the market-oriented phase, firms increasingly rely on external funds, including risk capital raised from ultimate savers through capital markets rather than through financial intermediaries. In the strongly market-oriented phase, banks also rely increasingly on the funds raised through financial and capital markets and there come into existence new financial-risk-hedging markets (Rybczybski, 1985).
4.8 Advances in the recent literature show that the traditional debate, i.e., whether bank-based or market-based financial structure was supportive of economic growth, may be misplaced in the current context (Levine, 2000). The bank-based view of growth, as propounded by development economists, notes that corporate financing for investment in the development phase is predominantly raised as debt from banks rather than from equity. This view is pessimistic about the role of markets as compared to banks in fostering growth. In turn, traditional corporate finance views banks, bond and equity financing as substitutes. Banks reduce costs of acquiring and processing information on behalf of investors and thereby avoid duplication and free rider problems. Banks also enable both cross-sectional as well as inter-temporal risk sharing. They also facilitate mobilisation of financial savings by economising on the transactions costs associated with mobilising savings from disparate agents and by overcoming the information asymmetries with making savers comfortable in offering their savings. By effectively mobilising savings, financial intermediaries not only ease capital accumulation but also improve resource allocation by allowing the benefits of economies of scale. According to this view, bank-based financial systems – especially in countries at early stages of economic development – are better at promoting economic growth. On the other hand, the market-based view stresses the impor tance of well-functioning securities markets in providing incentives for investors to acquire information, impose corporate control and custom design financial arrangements.
4.9 A third view emerging since the 1990s is that banks and markets may provide complementary or similar financial services. The financial services view, thus, places analytical importance on how both banks and markets build a sound system for effective provision of financial services so as to promote economic growth. Financial systems assess potential investment opportunities, exert corporate control after funding projects, facilitate risk management, including liquidity risk, and ease savings mobilisation. Another view, i.e., legal-based view, which emerged in the 1990s, extends the financial services view and unconditionally rejects the bank-based versus market-based debate and argues that finance is a set of contracts, which can be made more or less effective by legal rights and enforcement mechanisms. Accordingly, the overall level and quality of financial services – as determined by the legal system –improves the efficient allocation of resources and economic growth. Hence, it emphasises that focus should be on creating a sound legal environment, rather than debating on the merits of bank-based or market-based systems. Cross-country data also show that countries with greater degrees of financial development – as measured by aggregate measures of bank development and market development – are strongly linked with long run growth. Furthermore, the component of financial development explained by legal rights of outside investors and the efficiency of legal system is strongly and positively linked with long-run growth. The legal system plays an important role in financial sector development and in turn influences long-run growth. Thus, improving functioning of markets and banks is critical for boosting long-run economic growth. Policymakers, therefore, need to focus on strengthening the legal rights of outside investors and the overall efficiency of contract enforcement. Policy tools should not tip the level playing field in favour of banks or markets and instead focus on strengthening the fundamentals in the form of property rights and enforcement of these rights.
4.10 A key variable influencing availability of funds for banks is the central bank policy that alters the total volume of reserves in the banking system. Studies in the traditional literature have shown that, under conditions of precommitment of households to a deposit position and prevalence of Keynesian-type ‘sticky prices’, a central bank can alter the volume of reserves in the banking system through unanticipated injection of non-borrowed reserves, thereby creating ‘liquidity effects’. These models assume that households do not quickly adjust their liquid asset holdings, in particular their bank deposit position, in response to an unanticipated change in monetary policy. Subsequent models relaxed restrictions of this set up by introducing alternative instruments like bonds, whereby direct financing of firms/borrowers by households was allowed. This imparted the countercyclical character of working capital loans being financed through bank lending. These models were further developed by recognising that bonds and bank deposits are imperfect substitutes as not all firms have a quality rating to permit them to issue bonds and so they must have to take recourse to bank lending. However, continued restrictions in the form of deposits market clearing as well as deposit rate being determined prior to money shock produced persistence of liquidity effects. In the absence of the bond market, households are forced to absorb the monetary shock with liquid asset holdings in the form of bank deposits, thus, keeping the demand for real money balances relatively high and bringing about a slow price adjustment. The availability of the bond market provides households with a savings asset that helps to insulate their income from inflation. In response to a monetary shock, therefore, the demand for bonds increases, thereby mitigating the demand for real money balances and inducing an overshooting of prices relative to their long-run equilibrium path. Consequently, the sharper initial price adjustments result in lower expected inflation premia in nominal interest rates that dissipate slowly. Thus, information frictions in the form of precommitment by households to a deposit position as well as presetting of deposit rates by banks prior to monetary (reserves shock) commitment generate liquidity effects. However, when both the assumptions are operative, models yield excessive volatility in consumption and investment. However, when the precommitment of deposits by households is minimal, such that the principal restriction is a pre-set deposit rate, the liquidity effect is still present, bank intermediation remains countercyclical, and the behaviour of consumption and investment is cyclical in nature in tandem with the actual experience. This brings out three features of interest rate policy followed by banks. First, bank deposit rates on transaction accounts move quite sluggishly as they represent average rather than marginal rates. Second, interest rates paid on managed liabilities become more responsive to market rates. Managed liabilities, however, represent only a fraction of deposit funds. Third, interest rates on bank loans to firms are normally tied to lines of credit. All of these issues may significantly affect the cyclical properties of bank lending, and hence its role in transmitting monetary policy decisions to the real economy. Accordingly, interest rate policies, in particular, deposit rate policies followed by banks are receiving progressively greater attention in recent years (Einarsson and Marquis, 2003).
4.11 Traditionally, local market conditions play an important role in deposit pricing policy of banks. In this context, it was found that typically banks in more concentrated markets offer lower interest rates on deposits and higher rates on loans (Berger and Hannan, 1989). According to the traditional literature, bank deposit rates would not be affected from a rapid increase in average bank size, provided the local market concentration remains essentially unchanged. However, the experience of the recent banking consolidation shows that increase in the average size of banks, which have not impacted local market concentration, have changed local market conditions and influenced determination of deposit rates. Increase in bank size might affect deposit rates if regional or large nationwide organisations compete in different ways than small, local institutions, even when the different organisations have similar local market shares. Furthermore, although banking markets are generally local in nature, evidence from the development in recent years shows that multi-market banks compete differently than the banks that operate primarily in the local market. During the period of 1988 to 2004 in the US, as a result of the consolidation process, the effect of size structure on deposit rates followed typically an inverse-V shaped pattern. Up to the year 2000, bank mergers that moved deposits to mega banks pushed down the deposit rates as mega banks tended to be less aggressive competitors than small banks. This was partially, but not completely, offset by the fact that multi-market banks tended to be more aggressive competitors. During the subsequent period, the trend reversed, which reflected that mega banks became more aggressive competitors which led to an increase in deposit rates. These underlying trends bring to the fore several features of deposit pricing. First, as banks grow larger, they have access to more non-deposit liabilities. Typically, this reduces the desire for them to compete intensively for deposits. Second, as banks grow in size and operate in multiple markets, they become less sensitive to local market conditions. Third, since banks compete more intensively against other of similar size, the growing presence of multimarket mega-banks instills more aggressive competition among them leading to higher deposit rates (Rosen, R. J., 2007).
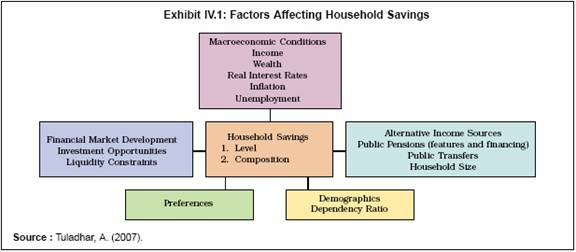
4.12 Finally, since household savings form a potential pool of resources for intermediation by banks, the evolving dynamics in determinants of household savings have a critical bearing on banks in their management of resource mobilisation. While the banks’ accessibility of resources is expected to grow in tandem with the increasing level of household savings, the actual recourse of the same would depend upon the households’ decisions on their portfolio composition of savings. The level and composition of household savings, in turn, are influenced by macroeconomic conditions, financial market development and regulation, alternative income sources, demographics and preferences of the household sector (Exhibit 1). Cross-country evidence on asset composition of household balance sheets reveals that non-financial assets constitute a major share in total assets in countries where developments in housing sectors have opened up new investment opportunities. On the other hand, the composition shifts in favour of financial assets in countries with well developed financial markets, partly facilitated by relatively cheap housing and extensive reliance on private pension plans. Within financial assets, the preference for liquid assets held mostly in the form of bank deposits is observed to be high in countries with a long history of public confidence in banking, which is also influenced, to an extent, by lack of confidence in the real estate and capital markets (Davies, et. al., 2007).
III. DEPOSIT MOBILISATION BY BANKS IN INDIA
4.13 Since the first episode of bank nationalisation in 1969, financial intermediaries, especially banks have been at the core of the financial intermediation process in India. They have mobilised a sizeable share of savings of the household sector and channelling them to the deficit sectors, viz., the private corporate and public, thereby supporting the growth process. The analysis of bank deposits in this section is attempted using the flow of funds data and the regular data on deposits of scheduled commercial banks (SCBs). The flow of funds data, though available with a considerable time lag (i.e., latest data available are for the period 2000-01), could provide useful insights into the relative position of the banking sector vis-à-vis the other sectors.
Flow of Funds
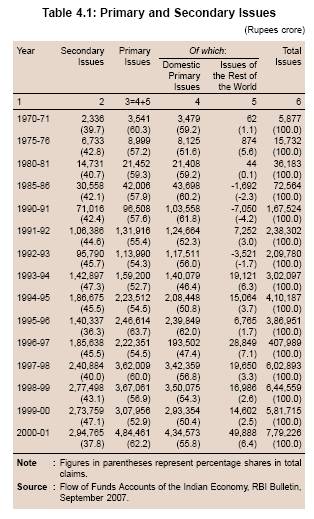
4.14 The channeling of resources from the surplus units to the deficit units was reflected in the flow of funds (FOF) accounts of the Indian economy across the six sectors, viz., households, corporates, government, banks, other financial institutions (OFIs) and the rest of the world sector. Households, the consistent surplus sector, met to a large extent the deficits of the public and private corporate sectors, and to a limited extent of the rest of the world sector. Funds were provided to meet the requirements of the deficit sectors either directly (primary issues) or through the financial intermediaries such as banks and OFIs (secondary issues). A notable feature from the sectoral distribution of claims was a general rise in the share of secondary issues from 39.7 per cent in 1970-71 to 47.1 per cent in 1999-00 with a corresponding decline in the share of primary issues. This reflected an important role played by financial intermediaries in the flow of funds process in the Indian economy (Table 4.1). In this context, it may be noted that flow of funds data for the Indian economy, which require availability of comprehensive information on financial transactions across all the sectors and instruments of the economy, are released with a considerable lag. This section utilises the latest available data for 2000-01, which was published in the RBI Bulletin released in September 2007.
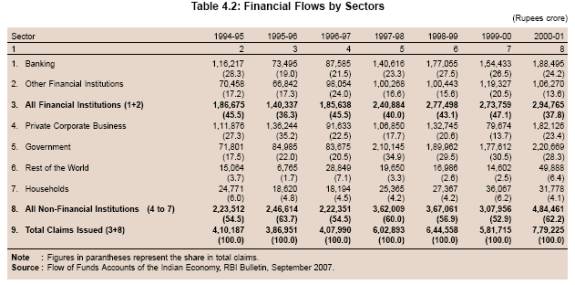
4.15 The relative significance of financial claims by the various sectors show year to year variations. The financial intermediation process has been dominated by the banking system. The share of claims by all financial institutions in total claims moved in the range of 36.3 per cent and 47.1 per cent; it averaged 42.2 per cent during the period 1994-95 to 2000-01. Financial flows through the banking sector increased from Rs.1,16,217 crore in 1994-95 to Rs.1,88,495 crore in 2000-01 with the share of financial flows through the banks in the flows through the financial intermediary sector, on the whole, increasing from around 62 per cent in 1994-95 to around 64 per cent in 2000-01. The share of the banking sector in total claims declined from 28.3 per cent to 24.2 per cent, while that of the OFIs declined from 17.2 per cent to 13.6 per cent during this period (Table 4.2). The share of non-financial institutions, led by the Government and to an extent by the private corporate sector, increased over this period.
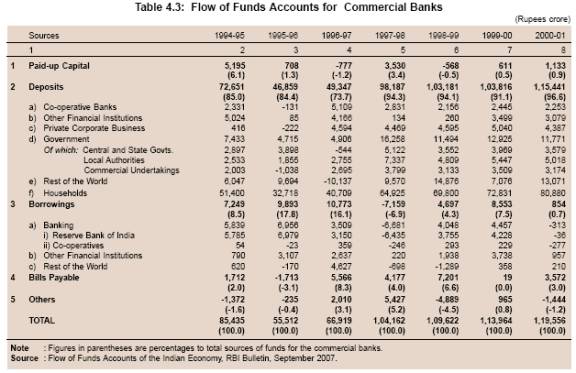
 4.16 The various sources of funds for the banks, as reflected in the flow of funds accounts of the Indian economy, showed large fluctuations. A notable feature, however, was that the deposits continued to constitute the largest source of funds for the banks. The share of deposits in total sources for the commercial banks increased steadily from 85 per cent in 1994-95 to around 97 per cent in 2000-01. The shares of paid-up capital and borrowings declined sharply between 1994-95 and 2000-01 (Table 4.3). While deposits were mobilised primarily from households, the share of the corporate sector in bank deposits increased. The share of households in total commercial bank deposits remained around 70 per cent over the period 1994-95 to 2000-01, while that of the private corporate sector increased from 0.6 per cent to 3.8 per cent. The share of rest of world rose from 8.3 per cent to 11.3 per cent. On the other hand,
the share of financial institutions in commercial bank deposits declined from 6.9 per cent to 2.7 per cent during the same period. Bank deposits from the government sector include deposits held by the local authorities and public sector commercial undertakings apart from the Central and State Governments. A notable feature was the increase in the holdings of deposits by the local authorities with banks. Borrowings, as a source of funds for the commercial banks, were driven by the borrowings from the Reserve Bank, other financial institutions and from the rest of the world sector. The rationalisation of the refinance facilities from the Reserve Bank, whereby refinance facilities other than export credit refinance facility was withdrawn, led to lower recourse of borrowings by banks from the Reserve Bank. Financial institutions constituted the main source of funds in the form of borrowings for banks, followed by the rest of the world sector in 2000-01.
 Bank Deposits
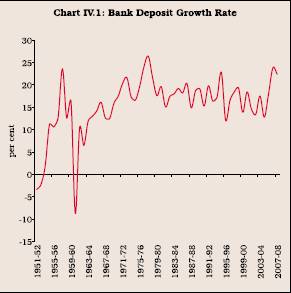
4.17 The banking sector has played an increasingly important role in the financial intermediation process by mobilising savings in the form of deposits. Yearly aggregate deposit growth of scheduled commercial banks, which remained highly volatile during the period 1951-52 to 1960-61, stabilised thereafter (Chart IV.1).
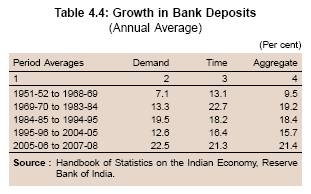
4.18 A major turning point in the post-independence history of the banking sector was nationalisation of 14 major private sector commercial banks in July 1969. Bank deposit growth of SCBs in the post-nationalisation period could be broadly divided into four phases, viz., Phase I (1969-1984); Phase II (1984-1995); Phase III (1995-2005); and Phase IV (2005-2008) (Table 4.4).
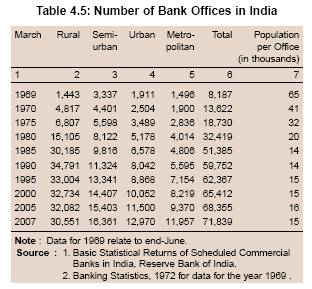
4.19 In the first phase, the aggregate deposit growth of SCBs increased sharply averaging 19.2 per cent during 1969-1984 as compared with 9.5 per cent during the pre-nationalisation phase (1951-1969). Net financial savings (net of financial liabilities) of the household sector increased sharply by 49.2 per cent in a single year in 1970-71, i.e., immediately after banks were nationalised. Consequently, physical savings of households declined by 8.9 per cent in 1970-71. Large branch expansion by commercial banks, especially in rural and semi-urban areas following nationalisation of 14 major private sector banks in 1969 also had a significant positive impact on deposit growth of banks. The second round of nationalisation of six private sector banks in 1980 led to further expansion of branch network and helped spur the growth of deposits. The number of bank offices in rural and semi-urban areas increased from 1,443 and 3,337, respectively, in 1969 to 30,185 and 9,816, respectively, in 1985. Consequent to the large branch expansion, outreach of the banking system expanded as reflected in the population per office, which declined from 65,000 in 1969 to around 14,000 in 1985 and has remained broadly stable thereafter (Table 4.5).
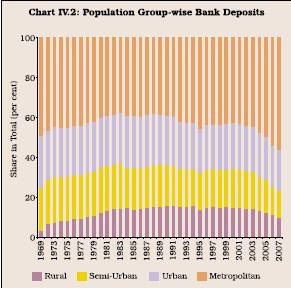
 4.20 As a result, the share of rural deposits in total deposits increased from 3.1 per cent in 1969 to 14.4 per cent by 1984, which was primarily responsible for raising the overall deposit growth during the period 1969-1984. Similarly, the shares of semi-urban and urban deposits also increased somewhat up to the mid-1980s. On the other hand, the share of metropolitan deposits in total deposits declined sharply from 49 per cent to around 39 per cent over the same period (Chart IV.2).
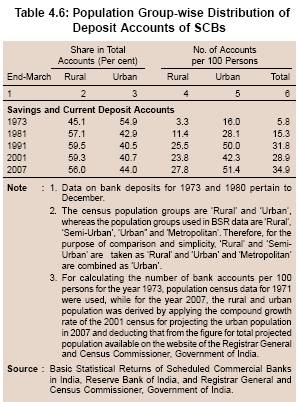
4.21 Increased access to banking facilities helped improve the banking penetration. At the all-India level, the number of savings and current deposit accounts with SCBs per hundred persons increased from 5.8 in 1973 to 15.3 in 1981 and further to 31.8 in 1991. It declined to 28.9 in 2001 before increasing again to 34.9 in 2007. In rural areas, the number of savings and current deposit accounts with SCBs per hundred persons increased from 3.3 in 1973 to 11.4 in 1981 and further to 25.5 in 1991. It declined to 23.8 in 2001 before increasing again to 27.8 in 2007 in line with the emphasis on financial inclusion by the Government and the Reserve Bank. The share of deposits in rural areas in banks’ total savings and current deposit accounts, which had increased up to 1991, however, declined in recent years (Table 4.6). In this context, it may be noted that apart from the SCBs, deposit facilities are also provided by primary agricultural credit societies (PACS), urban co-operative banks (UCBs) and post offices and, therefore, they also need to be taken into account in assessing the penetration of financial services in India (see Chapter VII for details).
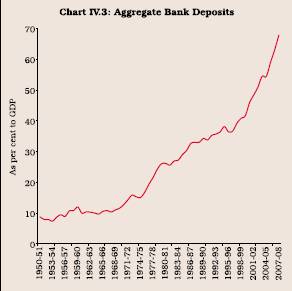
4.22 The process of banking habit was also facilitated by the establishment of the Deposit Insurance Corporation in 1962 (against the backdrop of failure of banks), which offered protection to bank depositors, particularly small account holders. This restored faith of savers in the banking system as reflected in the ratio of aggregate bank deposits to GDP, which increased from an average of 9-10 per cent during the 1950s and the 1960s to an average of 18 per cent during the 1970s (Chart IV.3).
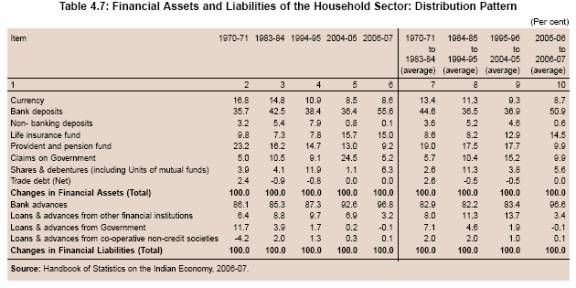
4.23 The share of bank deposits in gross financial savings of the household sector also increased from 35.7 per cent in 1970-71 to 42.5 per cent in 1983-84 reflecting the impact of bank branch expansion (Table 4.7). The share of bank deposits declined to 38.4 per cent by 1994-95 mainly due to disintermediation in the financial system on account of households’ preference for capital market instruments. The Government’s policy thrust on small saving schemes led to a further decline in the share of bank deposits to 36.4 per cent by 2004-05. However, there was a reversal in this trend with the share of bank deposits increasing to 55.6 per cent in 2006-07, reflecting aggressive deposit mobilisation by banks, partly facilitated by the extension of tax benefits to special deposit schemes as detailed in the subsequent sections. The higher interest rates on time deposits and unchanged interest rates on small savings contributed to some shift of funds from small savings to bank deposits.
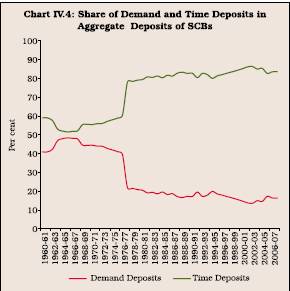
4.24 A major structural break occurred in components of bank deposits in 1977-78 due to definitional changes in the treatment of savings deposits. In 1977-78, the share of demand deposits declined sharply, primarily reflecting the switch towards time deposits on account of the change in the treatment of apportionment of savings deposits into two components – demand and time – in March 1978. In terms of the revised definition, SCBs were required to treat the average of the monthly minimum balances in savings accounts eligible for interest payments as ‘time’ liability, while the remaining portion was to be treated as the ‘demand’ liability of the savings account. Furthermore, banks were instructed to calculate the proportions between ‘demand’ and ‘time’ liabilities twice a year as at end-June and end-December. Also, following the recommendations of the Chore Committee in 1978, banks’ reliance on the cash credit reduced significantly as the corporates were required to contribute not less than 25 per cent of their current assets from their own funds and long-term resources. To the extent, corporates reduced their reliance on bank credit, it resulted in the decline in current deposits (Chart IV.4).
4.25 A compositional analysis of bank deposits also reveals that the share of term deposits, which was 55.7 per cent at end-March 1980, declined to around 51 per cent in 1981-82 reflecting a switch towards the new 12 per cent 6-year National Savings Certificates (NSC), which was introduced during the year. There was also a sharp increase in the issue of shares and debentures, particularly convertible debentures, by the corporate sector.
4.26 In the second phase (1984-1995), the aggregate deposit growth decelerated marginally to 18.4 per cent. The growth of demand deposits accelerated during this phase, while that of time deposits decelerated resulting in the overall slowdown in aggregate deposit expansion. The deceleration in time deposits growth was the result of (a) slowdown in expansion of branch network, and (b) substitution of time deposits held in banks with other saving instruments. The number of offices of SCBs, which showed nearly a four-fold increase between 1969 and 1980, expanded by less than two-fold between 1980 and 1995. Second, bank deposits were substituted in favour of other instruments. Units of mutual funds, shares and debentures, deposits of non-banking financial companies (NBFCs) and small savings grew rapidly, which was reflected in increase in their shares in household financial savings (refer Table 4.7).
4.27 The substitution of funds, particularly, in favour of units of mutual funds during the latter part of the 1980s and the early 1990s, to some extent, was facilitated by the availability of tax benefits under Section 80M of the Income Tax Act. Under this section, the dividend received by the companies was exempted from the income tax so long as the dividend paid by them was more than the dividend received. As a result, corporates invested large funds in the then Unit Scheme-64 (US-64) of the erstwhile Unit Trust of India (UTI). Apart from corporates, individual investors were also attracted to units of mutual funds. In addition to UTI, as many as 21 new mutual funds were set up between 1987-88 and 1995-96, which launched about 128 schemes. In the face of increased competition from newly established mutual funds, UTI also followed an aggressive policy of launching new schemes, especially during the latter half of the 1980s to meet investor’s diverse income and liquidity needs. Out of 41 schemes introduced between 1964 and 1992, as many as 26 schemes by UTI were introduced between 1987 and 1992. Between 1987-88 and 1991-92, financial assets of mutual funds grew at an average annual rate of 153 per cent (Raj, 1999). Although a part of increase in financial assets might have emanated from appreciation of investments, a major part of such assets was funded from fresh mobilisation of funds. Capital market conditions in this phase were also buoyant (as against depressed conditions in the 1970s). As a result, units of mutual funds and direct investments in shares provided higher returns than interest rates on bank deposits. This encouraged switching of household financial savings from bank deposits to shares and debentures and units of mutual funds. Deposits mobilised by NBFCs during this phase also grew rapidly. The number of NBFCs, which had increased two fold between 1970 and 1980, rose by nearly eight times between 1980 and 1994. An idea of large deposit mobilisation by NBFCs can be had from their financial assets, which grew at an average annual rate of 44.6 per cent during 1990-94. Small savings also increased significantly as reflected in increase in the share of claims on Government in financial savings of the household sector. During this phase, the share of bank deposits in financial savings of the household sector declined sharply (refer Table 4.7). An empirical study conducted for India also found that time/term deposits of scheduled commercial banks were substituted in favour of units of mutual funds, non-convertible debentures (NCDs), life insurance policies of LIC and small savings (Raj, op cit)1.
4.28 Bank deposit growth continued to decelerate further in the third phase (1995-2005) with the average aggregate deposit registering a growth of 15.7 per cent, although income levels increased fur ther reflecting the impact of improvement in real GDP growth. However, in this phase, deceleration to a large extent was caused by deceleration in demand deposits and to some extent time deposits. The sharp deceleration in demand deposits growth was due to the successive reduction in the stipulated minimum maturities of domestic term deposits. The minimum maturities of time deposits were gradually shortened from 46 days to 30 days in July 1996, from 30 days to 15 days in April 1998, and further from 15 days to seven days for wholesale term deposits of Rs.15 lakh and above in April 2001 and for retail term deposits under Rs.15 lakh in October 2004. This led to switch of funds
from saving deposits (demand liability portion) to term deposits. In order to provide banks the flexibility in their operations and improve efficiency, not only the minimum maturity period of term deposits was brought down but also banks were gradually accorded freedom in fixing the interest rates on their domestic term deposits for specific maturities (Box IV.1).
Box IV.1 Deregulation of Deposit Interest Rates in India
The process of deregulation of domestic deposit rates began when banks were allowed to set interest rates for maturities between 15 days and up to 1 year subject to a ceiling of 8 per cent effective April 1985. However, this freedom was withdrawn by end-May 1985 in the face of an ensuing price war. The process of deregulation was resumed in April 1992 by replacing the existing maturity-wise prescriptions by a single ceiling rate of 13 per cent for all deposits above 46 days. The ceiling rate was brought down to 10 per cent in November 1994, but was raised to 12 per cent in April 1995. Banks were allowed to fix the interest rates on deposits with maturity of over 2 years in October 1995 which was further relaxed to maturity of over one year in July 1996. The ceiling rate for deposits of ‘30 days up to 1 year’ was linked to the Bank Rate less 200 basis points in April 1997. In October 1997, the deposit rates were fully deregulated by removing the linkage to the Bank Rate. Consequently, the Reserve Bank gave the freedom to commercial banks to fix their own interest rates on domestic term deposits of various maturities with the prior approval of their respective Boards of Directors/Asset Liability Management Committee (ALCO). Banks were permitted to determine their own penal interest rates for premature withdrawal of domestic term deposits and the restrictions on banks that they must offer the same rate on deposits of the same maturity irrespective of the size of deposits was removed in respect of deposits of Rs.15 lakh and above in April 1998 with the bank board’s laying down policy in this regard. Banks were encouraged to put a flexible interest rate system on deposits (with a fixed rate option) in practice as early as possible in April 2002. Now banks have complete freedom in fixing their domestic deposit rates, except interest rate on savings deposits, which continues to be regulated and is currently stipulated at 3.5 per cent.
In line with the regulation of domestic deposit rates, interest rates on various NRI deposit schemes were also regulated by the Reserve Bank. Prior to August 1985, interest rate on the prevalent NRI deposit schemes was stipulated two percentage points higher than the prescribed domestic term deposit rates. Subsequently, interest rates on FCNR(A) were revised taking into account trends in international interest rates. The differential, however, widened in the early 1990s, reflecting the need to attract these deposits in view of the external payments crisis of 1991. As part of the financial sector reforms, the detailed maturity-wise prescriptions were rationalised for NRE deposits and subjected to a single prescription of ‘not more than 13 per cent’ in October 1992 and ‘not more than 12 per cent’ in April 1993 in line with the flexibility provided for domestic deposits. With a view to aligning the maturity structure of NRE and domestic deposits, interest rates on NRE term deposits of maturity over 2 years were freed in April 1996, while those for maturity over 1 year were freed in April 1997. Effective September 13, 1997, banks were given complete freedom to decide interest rates across all maturities. Similarly, with regard to FCNR(B) scheme, banks were allowed to determine the interest rates (fixed or floating with an interest reset period of 6 months) subject to a prescribed ceiling effective from April 16, 1997. Earlier, the interest rates on FCNR(B) deposits were the same as those prescribed for FCNR(A) deposits. The minimum maturity period was also raised from six months to 1 year, effective October 1999 and from July 26, 2005 banks were allowed to accept FCNR(B) deposits up to a maximum maturity period of five years, against the earlier maximum limit of three years. In the case of NR(NR)RD scheme, banks were allowed the flexibility to fix the interest rates from the inception of the scheme in June 1992, i.e., even before freeing the domestic deposit rates.
In response to changing conditions in the financial markets, however, interest rates on NRE term deposits were linked to the international rates by way of a ceiling of 250 basis points over and above the US Dollar LIBOR/SWAP rates of corresponding maturities, effective July 17, 2003. The ceiling rates were progressively reduced (to 100 basis points above LIBOR rates on September 15, 2003 and further to 25 basis points above LIBOR rates on October 18, 2003) and brought down to LIBOR/SWAP rates for corresponding maturities with effect from close of business as on April 17, 2004. Subsequently, the ceiling rate was raised again in stages to 100 basis points above LIBOR by April 18, 2006 before fixing at LIBOR with effect from April 24, 2007. Alongside, the NRE savings deposits rate was delinked from the domestic savings deposits rate and the ceiling rate on NRE savings deposits was fixed at 6-month US Dollar LIBOR/SWAP rate effective April 17, 2004. However, with effect from the close of business in India on November 17, 2005, the interest rates on NRE saving deposits are the same as applicable to domestic savings deposits.
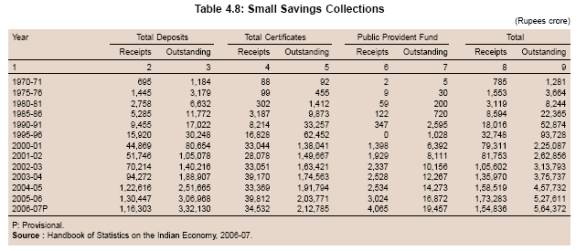 4.29 In this phase, however, bank deposits faced competition mainly from post office deposits and small savings, the collection under which increased by more than four times (Table 4.8).
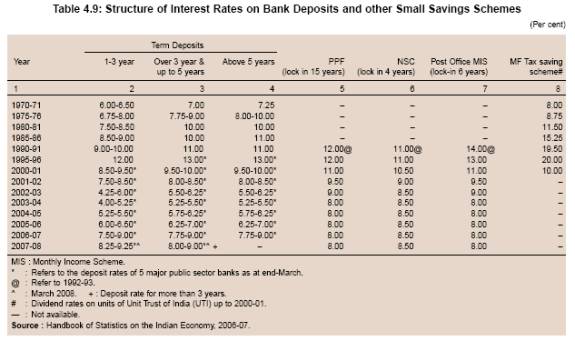
4.30 With the deregulation of various deposit rates as part of the financial sector reforms, interest rates on term deposits of all maturity spectrums declined from 12-13 per cent to 4.00-5.50 per cent between 1995-96 and 2003-04. During this period, interest on other saving instruments also declined. However, the decline in interest rate on other instruments was significantly lower than that on term deposits (Table 4.9).
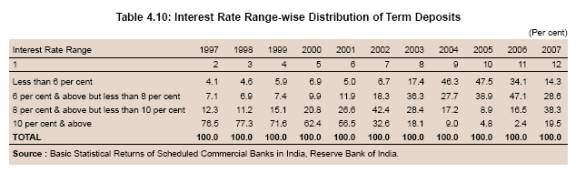
4.31 Reflecting the softening of interest rates and shortening of maturity profile of term deposits, a distinct shift was noticed in the interest rates at which banks contracted term deposits. The share of deposits contracted at the interest rate of 10 per cent and above in total deposits of SCBs declined consistently from 77.3 per cent in 1998 to 9.0 per cent in 2004. On the other hand, the share of deposits contracted at less than 6 per cent in total deposits of banks increased from 4.1 per cent in 1997 to 46.3 per cent in 2004. Deposits contracted at up to 8 per cent interest rate constituted as much as 74 per cent of total deposits in 2004 as compared with 11.2 per cent in 1997 (Table 4.10).
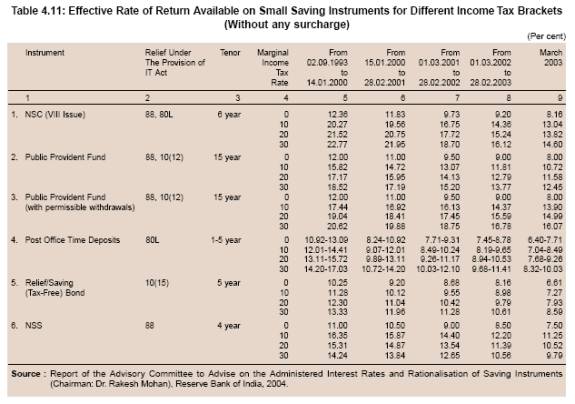
 4.32 With small savings rate generally being higher than the time deposit rates of similar maturities and the Government providing tax benefits for small savings, the effective rate of returns on such savings was often higher than the return on time deposits. As against annual rate of return of 5.25-5.50 per cent on term deposits with maturity of over five years in 2003-04, investors in marginal tax bracket of 30 per cent earned 14.6 per cent on NSC, 12.5 per cent on PPF and 8.32-10.03 per cent in post office deposits (Table 4.11).
 4.33 Accordingly, the growth in small savings collection was significantly higher than that in bank deposits. Collections of small savings more than doubled during 2000-01 to 2004-05 (Chart IV.5). Despite deceleration, the share of overall bank deposits in the gross financial savings of the household sector remained broadly unchanged. Besides increase in the share of claims on Government, the share of life insurance fund during this phase also increased sharply. However, the combined increase in the shares of claims on Government and life insurance funds was broadly matched by the decline in the share of capital market instruments (refer Table 4.7).
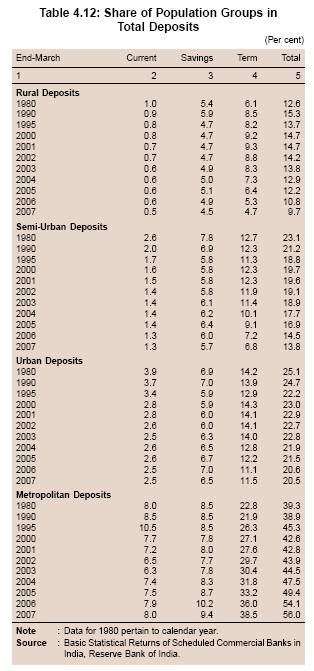
4.34 As a result of increased competition from post offices, which was mainly from rural and semi-urban areas, the shares of rural, semi-urban and urban deposits in total deposits declined from their peaks in the 1980s and the early 1990s. Concomitantly, the share of metropolitan deposits in total deposits of banks increased from the early 1990s, partly reflecting the growing significance of new private sector banks, which are operating largely in urban and metropolitan areas. A disaggregated analysis of deposit types reveals that the share of the rural sector in total bank deposits, which had increased from 12.6 per cent in 1980 to 15.3 per cent by end-March 1990, declined to 12.9 per cent by end-March 2004, reflecting largely the decline in the share of term deposits. Similar trends were observed in respect of shares of deposits in semi-urban and urban areas. On the other hand, the share of metropolitan areas in total bank deposits persistently moved up in the current decade due mainly to increase in the share of term deposits. Another noteworthy feature was the decline in the share of current deposits in total deposits in respect of both urban and metropolitan areas (Table 4.12). This, to an extent, could be explained by the decline in the share of industry in total credit as detailed in Chapter VI. Since industry avails a part of credit by way of cash credit, reduced dependence on bank credit leads to reduction in cash credit limit and balances in current account. This perhaps also represented better cash management by the industry. On the other hand, the share of saving deposits in total deposits remained broadly unchanged in all population groups.
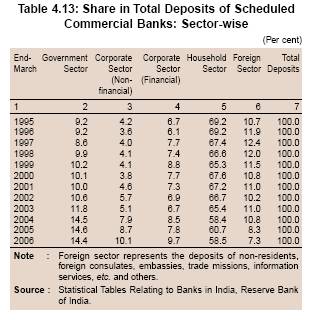
4.35 In terms of ownership pattern, the share of the household sector in banks’ total deposits declined from 69.2 per cent in 1995 to 58.4 per cent in 2004 (Table 4.13). The share of the Government sector in total deposits of SCBs increased from 9.2 per cent in 1995 to 14.5 per cent by end-March 2004. This could be attributed mainly to improved public sector savings rate which, in turn, was due to improved performance of the non-departmental government enterprises. The average saving rate of the non-departmental enterprises of the public sector increased from 3.0 per cent of GDP during 1991-92 to 1996-97 to 4.1 per cent during 2003-04 to 2006-07 (Mohan, 2008). The corporate sector’s (both financial and non-financial) share in total deposits also rose in recent years, reflecting their improved performance. Increased resource mobilisation by other financial intermediaries also led to increased parking of funds with the banking sector.
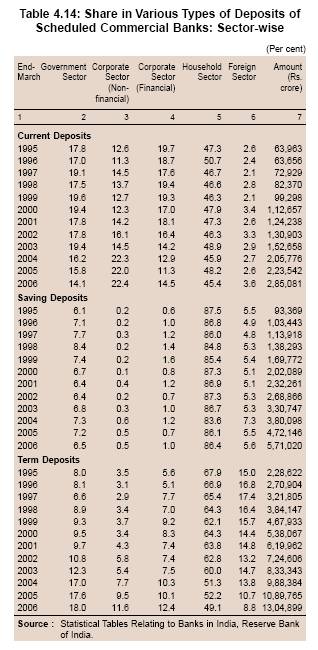
4.36 Disaggregated analysis of ownership pattern according to types of deposits of SCBs indicates that the decline in the share of the household sector occurred mainly because of decline in their share in term deposits. On the other hand, the increase in the deposits of the Government
and the corporate sectors was mainly on account of increase in their share in
deposits held by the household sector; its share ranged between 84-88 per cent between 1995 and 2004.

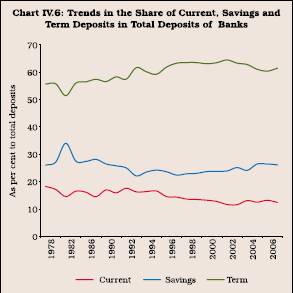
4.37 On the whole, the share of term deposits increased from 59.2 per cent at end-March 1995 to 63.1 per cent at end-March 2000 and further to a peak of 64.4 per cent at end-March 2002. The share of savings deposits declined from 24.2 per cent at end-March 1995 to 23.7 per cent at end-March 2000. Subsequently, the share of saving deposits increased to around 26.1 per cent by end-March 2007, while that of term deposits declined to 61.5 per cent (Chart IV.6).
4.38 However, within term deposits, the maturity profile of term deposits shortened significantly beginning 1990. The share of deposits of longer (above 5-year) maturities declined significantly, while that of deposits of shorter (up to 1-year) maturities increased (Table 4.15). The share of term deposits with maturity of 1-3 years also declined significantly, while that of term-deposits with maturity of 3-5 years declined marginally. This pattern was discernible broadly both in respect of individual and non-individuals. The decline in interest rates on term deposits and the increase in tax-adjusted returns on other saving instruments were the two major factors that contributed to this trend.

4.39 In the fourth phase 2005-06 to 2007-08, deposit growth accelerated on account of acceleration in both demand and time deposits (refer Table 4.4). With a pick-up in growth momentum from 2003-04, credit demand from banks increased on a sustained basis, leading banks to devise strategies for aggressive deposit mobilisation. The sharp acceleration in demand deposits in this phase reflected, to some extent, the increase in the balances in current account in tandem with the increased offtake of bank credit as also parking of funds by mutual funds and corporates in view of buoyant capital market conditions. Insofar as time deposits are concerned, in order to provide level playing field, the Government in the Union Budget 2006-07 also extended the tax benefits under Section 80C for fixed deposits in scheduled banks with maturity of five years and above (Box IV.2). In view of sustained growth in credit offtake from banks at a higher level since 2004-05, banks also began to raise interest rates on term deposits of different maturity above the small savings rates to improve the attractiveness of various deposit schemes. However, interest rates on post office deposits remained unchanged (refer Table 4.9). Accordingly, the interest rate differentials narrowed down initially and subsequently turned in favour of bank deposits. As a result, there was a shift of funds from small savings to bank deposits (refer Chart IV.5).
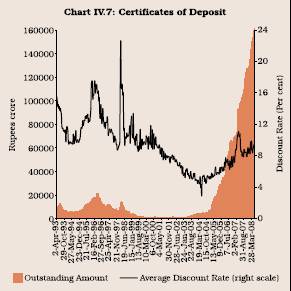
4.40 Apart from tax benefits on long term deposits, the introduction of bank deposit schemes for senior citizens at higher interest rates also led to improved mobilisation of time deposits by banks. The lowering of the minimum maturity period of certificates of deposit (CDs) to 7 days in April 2005 also generated increased interest in CDs. CDs, introduced in June 1989, are essentially securitised short-term time deposits, which provide greater flexibility to investors for deploying their short-term surplus funds. They are issued by banks during periods of tight liquidity at relatively higher discount rates as compared with term deposit rates. Notwithstanding deregulation of interest rates on CDs in 1992 and reduction in minimum issue size to Rs.1 lakh and requirement of issuance only in dematerialised form in 2002, there was hardly any activity in this market segment up to 2004, except the years of credit pick-up during the mid-1990s. With sustained pick-up in bank credit growth at around 30 per cent from 2004-05, banks increasingly resorted to the issuance of CDs to supplement their deposit mobilisation in order to support the strong credit demand. The flexibility of return that can be offered by the cash-strapped banks to attract bulk deposits made CDs the preferred route for mobilising resources, especially by private and foreign banks with limited branch network and retail customer base. Accordingly, the outstanding amount of CDs issued by banks increased from Rs.12,078 crore at end-March 2005 to Rs.93,272 crore by end-March 2007 and further to Rs.1,47,792 crore as on March 28, 2008. Accordingly, the share of outstanding CDs in aggregate deposits of SCBs increased from less than 1 per cent in 2004-05 to 4.6 per cent during 2007-08. The average discount rate on CDs, which had hardened from 5.3 per cent at end-March 2005 to 11.1 per cent at end-March 2007 in line with the general hardening of interest rates, eased somewhat thereafter (Chart IV.7).
Box IV.2 Rationalisation of Small Savings Rates
As part of the process of deregulation of interest rates, the Government had rationalised interest rates on small savings in 1999-2000. In recent years, the Government attempted to further rationalise the tax treatment prevalent on the various financial savings instruments, which were not homogeneous. There is considerable variation in the taxation of contributions made to savings schemes, the tax levied on the accumulations in such schemes and the tax treatment at the final stage of withdrawal. This lack of uniformity tends to induce artificial distortions and bias amongst the various financial instruments. While many of the savings plans are exempted from tax at all the three stages ‘exempt-exempt-exempt’ (EEE), others are subject to tax on either the accumulations or payments received at the terminal stage. Recognising the best international practice relating to taxation of financial savings as the ‘exempt-exempt-taxed’ (EET) method, the Government of India also switched over to this system in a phased manner by April 1, 2006. As a first step, this required switching from the rebate method to income based deduction method. Therefore, as per the proposal of the Union Budget 2005-06, the then existing method of providing tax rebate under Section 88 for contributions/investments in specified savings schemes were replaced by an income based deduction for contributions by inserting a new Section 80C under Chapter-VI-A of the Income-tax Act. Accordingly, an individual or a Hindu Undivided Family
was allowed a deduction from income of an amount not exceeding Rs.1 lakh with respect to sums paid or deposited in the previous year, out of income chargeable to tax, in cer tain specified schemes, which was successively raised to Rs.1,15,000 (inclusive of health insurance premium) in 2007-08 and further to Rs.1,30,000 in the Budget 2008-09. The additional amount of Rs.15,000 would be allowed for health insurance premium likely for dependant parents. The saving instruments eligible for tax benefit under the new schemes under Section 80C of the Income Tax Act are the same as those entitled for rebate from income-tax under Section 88, and included life insurance premia, contributions to provident fund or schemes for deferred annuities, purchase of infrastructure bonds, payment of tuition fees, repayment of principal amount of housing loans, etc. The coverage of Section 80C has been proposed to be enlarged in the Budget 2008-09 by including the Senior Citizens Savings Scheme 2004 and the Post Office Time Deposit Account as eligible saving instruments. The small savings rates as well as the marginal income tax rates have remained unchanged since March 2003, while the tax exemption limits under Section 80C have been revised upwards in successive Budgets. In respect of capital market instruments, although short-term capital gains attract higher tax rates, the exemption of long-term capital gains makes these instruments relatively more attractive compared to term deposits.
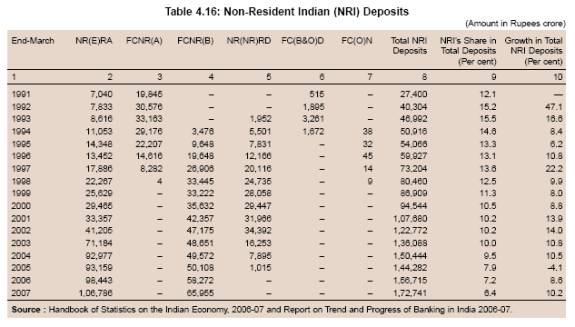
4.41 In this phase, the growth of non-resident (NRI) deposits decelerated significantly. As a result, the share of NRI deposits in aggregate deposits of SCBs, which constituted 15.5 per cent at end-March 1993,declined consistently (except in 1997) to 9.5 per cent at end-March 2004 and further to 6.4 per cent at end-March 2007 (Table 4.16). As a result, the share of foreign deposits in total deposits declined significantly (refer Table 4.13). The sharp decline witnessed beginning 2003-04 could be attributed to the rationalisation of various NRI deposit schemes and decline in the ceiling interest rates prescribed by the Reserve Bank for various deposit schemes as part of the strategy to manage capital flows as well as increased recourse to foreign currency borrowings by banks in view of lower interest rates abroad. The present ceilings in respect of FCNR(B) deposits of all maturities is LIBOR/SWAP rate minus 75 basis points and for NR(E)RA deposits is at the LIBOR/ SWAP rate effective from April 24, 2007. NRI deposit schemes were introduced in the 1970s and in the 1990s to support balance of payments (Box IV.3).
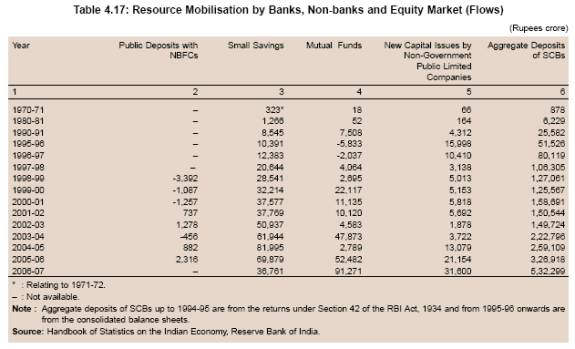
4.42 The deceleration in NRI deposits, however, did not have any significant impact on the overall deposit growth. The acceleration in deposits was also registered despite increased competition faced by banks from capital market instruments (shares/ debentures/units of mutual funds). It may be noted that while dividend income on capital market instruments is exempt from tax, investors also do not have to pay tax on long-term capital gains, while short-term capital gains are taxed at 10 per cent (raised to 15 per cent in the Budget for 2008-09). Funds mobilised by mutual funds and through new capital issues increased sharply, reflecting bullish sentiment in the capital market. However, with the Indian economy moving on to a higher growth path and sharp acceleration in the overall as well as sectoral saving rates, there was a general improvement in resource mobilisation by banks, non-banks and through equity market instruments (Table 4.17).
4.43 A significant shift was noticed in the various components of household sector financial savings. The share of bank deposits in household sector savings increased significantly from 36.9 per cent during 1995-96 to 2004-05 to 50.9 per cent during 2005-06 to 2006-07. The share of capital market instruments and life insurance fund also increased. On the other hand, the share of claims on Government declined (refer Table 4.7).
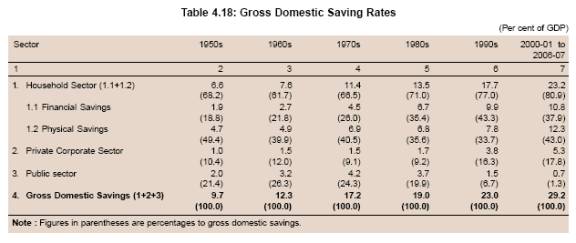
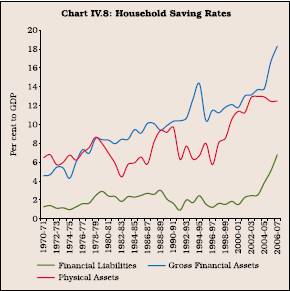
4.44 Bank deposits constitute the single largest source of domestic savings. Despite some fluctuations from time to time, bank deposits have maintained their predominant position in domestic savings and have played an important role in stepping up the share of financial savings of the household sector in gross domestic savings from an average of 1.9 per cent in the 1950s to 10.8 per cent during 2000-2007. The household sector has increasingly incurred financial liabilities, par ticularly through bank advances, to undertake its investments in physical assets in the form of construction, machinery and equipment, and change in stocks in recent years, which tended to dampen the net household financial savings. It is, however, significant to note that physical savings of the household sector have also moved in tandem with the increase in gross financial savings (Table 4.18 and Chart IV.8). Although a part of savings in physical assets is for genuine requirements, quite a significant part is locked up in unproductive assets.
Box IV.3 Non-Resident Deposits
India, like many other developing countries, has been mobilising a part of their external capital requirements through special deposit schemes designed for nonresidents by banks, in both foreign currency and local currency. Against the backdrop of the oil shocks in the 1970s and in order to tap the savings of Non-resident Indians (NRIs) employed in oil-rich countries, the Reserve Bank devised special deposit schemes for the first time in February 1970 with the introduction of Non-Resident External Rupee Account [NR(E)RA] which was followed by Foreign Currency Non-Resident (Account) [FCNR(A)] scheme in November 1975. The FCNR(A) scheme, where foreign exchange risk was borne initially by the Reserve Bank and subsequently by the Government, was withdrawn in August 1994 in view of its implications for the central bank’s balance sheet and its quasi-fiscal costs to the Government. In order to provide depositors with an alternative to FCNR(A) under the market determined exchange rate regime, a new scheme known as Foreign Currency Non-Resident (Bank) [FCNR(B)] was introduced under which the foreign exchange risk was borne by banks on the basis of their risk perceptions. A new rupee denominated scheme, Non-Resident Non-Repatriable Rupee Deposit [NR(NR)RD], which was initially non-repatriable, was subsequently provided with features of repatriation of only interest income. The NR(NR)RD scheme was withdrawn in April 2002. Thus, currently only two NRI deposit schemes - the NR(E)RA scheme, also known as the NRE scheme and the FCNR(B) scheme -are in operation. While NRI deposits provided an important source of external finance, the acceptance of these deposits by banks had monetary implications. Therefore, the policy since the 1990s has been to retain the attractiveness of NRI deposit schemes, while at the same time reduce the effective cost of borrowing in terms of interest outgo and the cost to macroeconomic management. In line with these objectives, while interest rates on these deposits were gradually deregulated, the reserve requirements and, in recent period, interest rate ceilings have been fine-tuned in relation to capital flows cycles as part of the strategy of modulating these flows consistent with the overall macroeconomic management.
Apart from accessing external resources through NRI deposits schemes, banks have also resorted to mobilisation of funds from abroad through special deposit schemes in response to certain unfavourable external developments from time to time. Three such schemes have been launched since 1991 through banking channels with exchange rate guarantees. In the aftermath of the Balance of Payments (BoP) crisis, the State Bank of India (SBI) floated the 5-year India Development Bonds (IDBs) in October 1991 and raised US $ 1.6 billion. In view of an anticipated shortfall in capital flows, especially debt flows, the SBI floated a 5-year Resurgent India Bonds (RIBs) in August 1998 and raised US $ 4.2 billion. On the third occasion, the SBI floated a 5-year India Millennium Deposits (IMDs) scheme in December 2000 and raised US $ 5.5 billion as a pre-emptive step to check any possible depletion of India’s foreign exchange reserve in the face of surge in world petroleum prices.
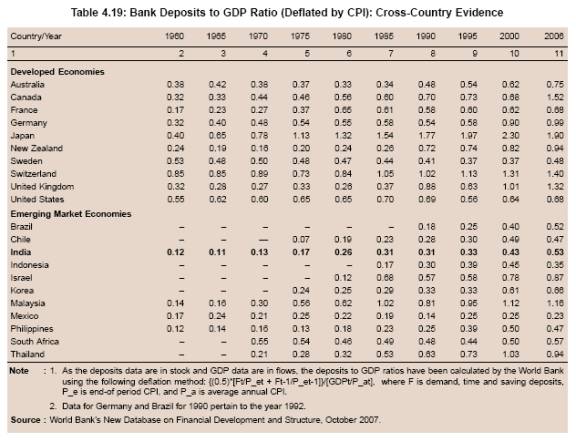
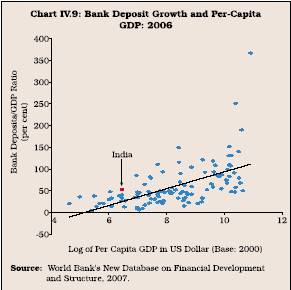
4.45 Although the bank deposits to GDP ratio (deflated by consumer price index) in India moved up gradually over the years, it was still lower than almost all advanced countries and several emerging market economies in Asia included in the sample (Table 4.19). This was despite the fact that some of the advanced countries are predominantly market-based systems. An analysis of 116 countries covering both developed and developing economies reveals that the bank deposits to GDP ratio, in general, tends to move up as income levels rise (Chart IV.9).
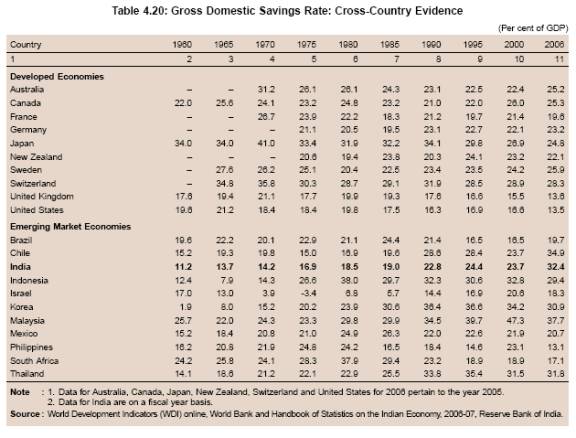
4.46 One of the major reasons for the low deposit-GDP ratio in India was the high share of physical savings in total savings even as India’s savings rate compared favourably with several advanced and emerging market economies (Table 4.20).
Liability Structure of Banks: Deposits versus Borrowings
4.47 Deposit is the main source of funds for banks in most countries. However, in some countries, banks also depend heavily on borrowings, which raise questions about liquidity and solvency and overall stability of the banking system (Box IV.4).
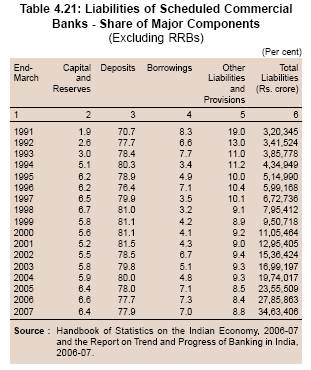
4.48 Deposits constitute a major source of funds for banks in India. The share of deposits in total liabilities of banks remained broadly steady over the years. The share of capital and reserves in total liabilities, which was very small in 1990-91, increased significantly to 6.2 per cent by end-March 1995 in line with the emphasis on the capital adequacy requirements based on risk-weighted assets under the Basel I norms which were introduced from 1992-93. The capital to risk-weighted assets ratio (CRAR), which was 8 per cent to start with, was raised to 9 per cent from the year ended March 2000. Further, the Reserve Bank also continuously assessed risks weights on certain categories of advances as a prudential measure to protect the balance sheets of banks during phases of rapid credit expansion. This prompted banks to raise resources from the market and also plough back profits (see Chapter V). However, the share of capital and reserves in total liabilities has remained broadly unchanged from 1995. Banks supplemented their resources through borrowings from various financial institutions such as NABARD, EXIM Bank and erstwhile IDBI as well as from the Reserve Bank in the form of refinance and rediscounting facilities. The Reserve Bank’s accommodation to commercial banks was in the form of food credit refinance, export credit refinance, standby refinance against pledge of Government securities during times of mismatch between sources and uses of fund and discretionary refinance to tide over temporary financial stringencies. During the 1990s, there were some rationalisation of the various refinance facilities along with reductions in the cash reserve ratio (CRR) from a peak of 15 per cent in 1991 to 9.5 per cent in November 1997, which was reflected in the decline in the share of borrowings in total liabilities between 1990-91 and 1997-98. Subsequently, the share of borrowings increased again, reflecting flexibility provided to banks to tap foreign currency borrowings, especially for granting pre-shipment credit in foreign currency (PCFC)/export bills rediscounting (EBR) to exporters. Banks were also allowed to use funds generated through buy-sell swaps in the domestic foreign exchange markets for granting such loans, subject to aggregate gap limit approved by the Reserve Bank. The share of overseas foreign currency borrowings in the aggregate deposits of banks gradually increased from around 0.1 per cent of total deposits at end-March 2001 to almost 2.3 per cent at end-March 2007 in line with the policy flexibility and the easing of interest rates abroad. Apart from overseas borrowings, banks also borrowed by way of call/term funding from financial institutions, whose share in total liabilities increased from almost zero per cent in 1998-99 to about 3.2 per cent in 2006-07. Some banks also raised funds by way of debt instruments from the capital market as past Tier II capital requirements and to support infrastructure financing. On the whole, however, the share of borrowings in total liabilities of banks has remained broadly the same since 1992. On the other hand, the share of other liabilities and provisions declined consistently mainly reflecting the decline in non-performing assets (NPAs) of banks as percentage of their gross advances (which declined from 15.7 per cent in 1996-97 to 2.5 per cent by 2006-07) and consequent decline in provisioning (Table 4.21).
 Box IV.4 Deposits versus Borrowings: Some Issues
Traditionally, deposits constituted the primary source of funding for banks for undertaking financial intermediation, while their recourse to borrowings arose when the depositors switched their financial assets towards alternative instruments in line with the development of financial markets. As deposits are generally insured up to a threshold limit by the Government, they allow savers to retrieve their funds on demand without any capital loss, thereby ensuring full safety. On the other hand, the absence of both default risk and restrictions on access allows banks to mobilise deposits at lower rates relative to other financial institutions as the benefits of deposits insurance is available to banks almost without any payment of premium. Thus, insured deposits are not only a subsidised source of funds but also constitute the preferred ‘core’ funding for banks. As against insured deposits, recourse to borrowings is not only more costly but is also considered to be more sensitive to a bank’s financial health and returns available on alternative financial instruments. As the providers of uninsured funds risk losing their money in the case of a bank failure, they are more likely to demand a higher return or pull out some of its money from the bank.
Notwithstanding the embedded features of liquidity and safety, savers tend to divert a part of surplus funds away from bank deposits towards investing in mutual funds, equity, debt instruments and contractual savings instruments such as insurance, and provident and pension funds. Apart from financial market development, many other factors such as changes in demographics and individual preferences also play a role in such shifts. While older people may rely on investment income and be risk averse rather than tie up their money for a long period of time, working (middle-age) population may seek higher returns when saving for retirement and have more flexibility to invest for the long-term. Even without changes in demographics, if households change their preferences and begin placing more importance to returns rather than safety of insured deposits, then also there could be a flight from bank deposits. Furthermore, greater access by households to alternative investment avenues enabled by developments in information processing, telecommunications technology and advances in financial engineering have lowered the transactions costs to households while channeling their funds into non-deposit assets.
These shifts have several implications for resource management by banks. First, the decline in cheaper insured deposits may raise costs for banks by making them rely on more expensive funding through borrowings. The shift to non-deposit funding would, therefore, require banks to engage in more active, complex and costly management of their funding base to ensure that they can meet their repayment commitments. Accordingly, banks may have to pay a higher rate on deposits to retain money which otherwise might switch to other investments having its implications for bank profitability and fund stability. Second, in certain circumstances, raising funds through non-deposit sources such as borrowing or bulk deposits may be cheaper at the margin than the insured deposits even if the rates paid on non-deposit funds are actually higher. This could be due to higher non-interest costs required to raise insured deposits such as the expense of branches, staff and technology. Furthermore, while raising rates to attract new deposits could also increase the cost of its existing deposit base, borrowings can be raised by banks without altering the cost for its existing deposits. Therefore, banks, in the face of growing preferences towards non-deposit instruments, may find it economical to reduce their branch structure or to carry out new techniques for raising money. However, with increasing reliance on non-deposit sources of funding, banks would have to develop the requisite expertise to design prompt and cost-effective repayment schedules, establish additional sources of emergency backup funds, and build up buffer of marketable and liquid securities.
In this new environment, thus, banks face the challenge of proper assessment of risks associated with borrowed liquidity vis-à-vis stored liquidity inherent in core deposits. Regulators also need to be proactive in dealing with the emergence of any systemic risks arising out of increased recourse to borrowings.
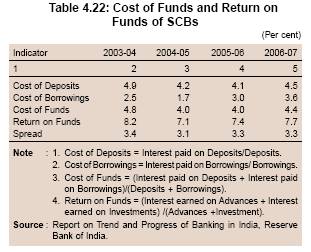
4.49 The cost of deposits, which reflects the average rate of contracting deposits of different types and different maturities over a period of time, declined between 2003-04 and 2005-06 before increasing marginally in 2006-07 in the wake of hardening of domestic interest rates. The cost of borrowing was lower than the cost of deposits. However, the gap between the two narrowed down significantly in 2006-07 (Table 4.22). In this context, it may be noted that while deposit rates are inherently sluggish and adjust with a lag to the liquidity conditions, interest rates on managed liabilities (i.e., borrowings) respond more swiftly to the evolving market cost of funds, as is evident from international experiences. An increase in the cost of funds was also accompanied by an increase in the return on funds in 2006-07. As a result, banks were more or less able to maintain their spread.
4.50 To sum up, banks in India have played an important role in financial intermediation by mobilising deposits from the public, and stepping up the savings rate. Growth of bank deposits has varied over different periods of time and has been accompanied by some distinct features in each phase. In the phase beginning immediately after nationalisation of banks, bank deposit growth accelerated sharply as rapid branch expansion that followed nationalisation enabled banks to tap savings from the rural areas. In the second phase (1984-1995), bank deposit growth decelerated as banks faced increased competition from alternative saving instruments, especially capital market instruments (shares/debentures/units of mutual funds) and non-banking financial companies. This was the phase of disintermediation as savings instead of being deployed in bank deposits were increasingly deployed in alternative saving instruments. Bank deposit growth decelerated further between 1995 and 2004. In this phase, banks faced competition from post office deposits, which carried significantly higher tax-adjusted returns than bank deposits. Despite this, however, bank deposits maintained their share in the savings of the household sector. During this phase, both ownership pattern and maturity pattern underwent a significant change. Bank deposits held by the Government and corporate sectors increased significantly. As a result, the share of deposits held by the household sector declined significantly even as the share of banks deposits in household sector financial savings remained broadly unchanged. The share of term deposits in total deposits increased. This was largely on account of increase in the share of the Government and the corporate sectors, as the share of the household sector in term deposits declined. However, within term deposits, there was a significant shortening of maturity profile in favour of short-term deposits.
 4.51 In the fourth phase (2005-2008), bank deposit growth accelerated significantly as a result of vigorous resource mobilisation efforts by banks. This was facilitated by extension of benefits available on post office deposits to bank deposits. Growth of post office deposits and other small savings decelerated sharply. During this phase, the growth of NRI deposits decelerated sharply. However, banks were also able to mobilise large funds by way of certificates of deposit. During this phase, funds mobilised by mutual funds and by corporates through new capital issues increased significantly. As a result, the share of bank deposits and capital market instruments in the financial savings of the household sector increased sharply and that of claims on Government declined significantly.
4.52 The share of deposits and borrowings in the overall liabilities of banks has remained broadly unchanged in the post-reform period. The cost of borrowings between 2003-04 and 2006-07 was lower than the cost of deposit. However, the gap between them narrowed down significantly during 2006-07.
4.53 On the whole, the banking sector has played an important role in stepping up the savings rate of the household sector. However, physical savings have continued to grow in tandem with financial savings of the households and the challenge for the banking sector is to convert unproductive physical savings into financial savings. This issue is addressed in Section V in the light of cross country experiences set out in the following section.
IV. CROSS-COUNTRY EXPERIENCES
4.54 International experience shows that the role of financial intermediation has evolved over time, and varied across countries in tune with their state of financial development. A feature resulting from the evolutionary process of financial development has been progressive reduction in transaction costs and asymmetric information which have, to some extent, resulted in decline in the importance of traditional banking business of taking deposits and extending loans. Second, in tune with this, other financial intermediaries such as the pension funds and mutual funds have grown in importance in the recent period. Third, as financial development has introduced new financial markets such as financial futures, which are markets for intermediaries rather than individuals, the demand for new forms of financial intermediation has grown in relation to the traditional forms. Therefore, in recent years, modern theories of intermediation have developed that stress risk trading, risk management and participation costs as the key reasons for existence of modern intermediaries. In this modern set up, although the importance of non-bank intermediaries such as pension funds and mutual funds has increased significantly, banks have continued to play a significant role by diversifying their activities from traditional form of financial intermediation, whereby the sources of income originate more from fee-based activities to meet the demand for funds rather than through accepting deposits and extending loans. The key features of evolution of this financial intermediation process and the associated implications for the banking sector are borne out by the experience of development of financial systems in the US, the UK, France, Germany and Japan (Allen and Santomero, 2001).
4.55 In the United States, despite improved performance of banks, the consolidation process in the banking industry has resulted in the loss of its market share to other types of financial intermediaries. The decline in the banking sector’s share in total intermediary assets has been noticeable since the mid-1970s, after a period of relative stability over 1940-1970. The share of commercial banks in total financial intermediary assets declined from 42 per cent in 1970 to below 25 per cent in 2005. With banks losing access to core deposits (as savers moved to non-bank financial institutions with the development of the financial system), they could not extend the benefits of relationship lending to borrowers prompting them to switch away from banks to not only the entities offering close substitutes to bank loans but also to those entities that issued securities (Mester, 2007). Accordingly, the shares of finance companies and asset-backed securities (ABS) issuers, and government-sponsored enterprises (GSEs), real estate investment trusts (REITs) and mortgage companies in total financial intermediary assets in the US increased sharply during the 1990s (Table 4.23). Despite their loss in the market share of intermediary assets, financial assets of the banking sector, as percentage of GDP, have not declined markedly (Scholtens van Wensveen, 1999). This suggests a change in the ownership pattern of the financial assets, whereby there has been a switch in asset holdings from those held directly to those held by non-bank intermediaries. Thus, the banking sector has experienced a reduction in its size in relation to other intermediaries but not relative to total financial assets of the economy. This has been consistent with long-term trend of a decline in the individual ownership of corporate equity in the US.
4.56 Nevertheless, the banks in the US have been losing their share in business and consumer lending to other non-banking intermediaries. The shrinking market share of the banking sector implies that the synergies between the liability and asset sides of the bank balance sheet have reduced. The decline in the market share of the banks may have begun from the liabilities side instead of assets side of the balance sheet, thereby reflecting a decline in demand for deposits rather than a decline in demand for relationship lending. Studies have found empirical evidence of an explicit link between banks’ liability structure and its distinctive lending behaviour (Berlin and Mester, 1999). Most banks undertake relationship lending, which is typically associated with lower loan rates, less stringent collateral requirements, a lower likelihood of credit rationing, more contractual flexibility and reduced costs of financial distress for borrowing firms. The foundation of relationship lending depends on the ability of the banks to raise core deposits. The core deposits are rate inelastic in character and enable banks to offer relationship lending by insulating their cost of funds from economic shocks. The banks are, therefore, able to offer multi-period contracts to the borrowers insuring them against adverse credit shocks. However, as banks lose access to core deposits when savers switch their financial savings towards mutual funds, they offer less insurance (loan-rate smoothing) to borrowers. This results in banks losing their market share to intermediaries that hold securities rather than loans. This process explains as to how banks have lost their market share not only to entities offering close substitutes to bank loans but also to entities issuing securities. The declining demand for deposits not only raises banks’ cost of funds but also reduces the feasibility of relationship lending by banks, reducing firms’ demand for bank loans as they became less distinctive. In other words, the banking sector has been shrinking since their loans have become less “special”, reflecting declines in the cost of information processing and communication which have lowered the cost of the duplication of bank services.
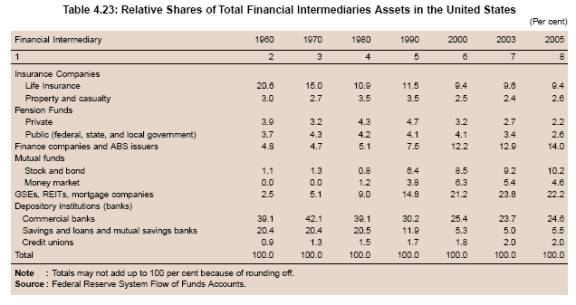
4.57 Banks have been losing ground on the liability side of their balance sheet. In particular, as the dependency ratio increased in the US as well as other industrial countries, consumer demand shifted towards saving products from credit products. Asset accumulation in anticipation of retirement has been becoming more important and this market growth has been the fastest for household wealth accumulation. However, the traditional bank deposits – the time and savings account – have been losing ground to mutual funds which have much leaner cost structures and offered significantly higher returns. Accordingly, time and saving deposits of banks have declined steadily relative to fixed income mutual funds since 1980. Furthermore, as non-banks are introducing new technologies, banks are also losing ground in their fundamental role of facilitating payments. The widespread use of credit cards has also eroded the central role played by demand deposits of banks in the payment system. The payment vehicles are increasingly being issued by primarily monoline organisations or distributed nationally by mass mailing which is different from usual multi-product banking relationship and has further eroded banks’ previous unique role and demand for its deposit products. The declining role of the traditional intermediation business has led to a decline in the importance of net interest income for both the banking sector and the economy as a whole in the US. As this decline in the basic intermediation business has been economically motivated and technologically driven, it is viewed as likely to be irreversible (F. Allen, et. al, op. cit).
4.58 Although the intermediation business has declined, banks in the US have shifted from traditional intermediation function towards fee-producing activities such as trusts, annuities, mutual funds, mor tgage banking, insurance, brokerage and transactions services. Therefore, while the spread income accounted for a share of 80 per cent in total bank earnings in the late 1980s, region and money centre banks earned more than half of their income from fees and trading income in the late 1990s. Consequently, the structure of banks in the US has altered over the years whereby they are no longer the main repository of liquid savings for the financial system and the primary source for business and consumer finance.
4.59 The trends relating to banks in the US are increasingly being mirrored in other economies such as France, Germany and the UK. The ratio of households’ claims on banks as a proportion of their total financial claims has declined in all these countries, which is also being reflected in respect of all non-financial sectors on banks. The ratio of liabilities of banks to non-bank financial intermediaries compared to total financial liabilities has risen significantly. Simultaneously, the ratio of securities liabilities of banks to total financial liabilities has risen somewhat for France, marginally for Germany but stayed roughly the same for the UK over the period 1981-1996 (Schmidt, et al., 1998).
4.60 A feature emerging from the cross country experience is that banks’ ability to attract household deposits reflected the different holding pattern of total assets ultimately held by the households in the different economies. For instance, households held only 19 per cent of their assets in terms of cash equivalents including deposits in the US, whereas the share was slightly higher at 24 per cent in the UK in 1994. A significant proportion of 31 per cent was held in the form of fixed income assets such as domestic and foreign bonds, and loans and mortgages, while the largest portion, 46 per cent was held in risky assets including domestic and foreign equity and real estate in the US. In the UK, however, households held significantly lower amounts in fixed income assets at 13 per cent and substantially higher shares in risky equity and real estate assets, at 52 per cent. On the other hand, households are relatively shielded from risk in Japan. They kept 52 per cent of their assets in cash and cash equivalents, 19 per cent in fixed income assets and only 13 per cent in risky equity and real estate assets. Households were also found to be risk averse in France and Germany where they kept 33 per cent and 40 per cent, respectively, of their asset holdings in cash and cash equivalents. It may also be noted that not only the households hold higher shares of their assets portfolio in risky assets in the US and the UK as compared to Germany, France and Japan, but also they hold more in financial assets. Thus, as quantum of financial assets increases, the share of risky assets borne by the households also increases.
4.61 Another factor explaining the relatively higher proportion of household assets in bank deposits in Japan, France and Germany as compared to the US and the UK is that the financial markets are relatively less developed in the former group of countries. In the presence of incomplete financial markets, long-lived financial institutions like banks allow effective inter-temporal smoothing of risks that cannot be diversified at a given point of time, thereby inducing
the households more to park their financial savings with banks than in the case of economies with developed financial systems. In these economies, banks acquire a ‘buffer’ of short-term liquid assets when times are good and run this buffer down when times are bad. As a result, households that hold most of their assets in bank accounts and other fixed income assets are shielded from risk and are able to smooth consumption streams. On the other hand, in the case of economies with developed financial markets, competition faced by banks from financial markets may not make inter-temporal smoothing by banks viable in the long run. This is because, in good years, households shift their savings out of the banking system for investing in the market to reap better returns and thereby avoid accumulation of bank reserves. Therefore, in bank-based systems such as those in Japan, France and Germany, risk management can be achieved through inter-temporal smoothing as banks eliminate risk by investing in shor t-term liquid assets. Other kinds of risk management are relatively less important as cross sectional risk sharing is correspondingly reduced in importance. On the other hand, in market-based financial systems, inter-temporal smoothing by financial intermediaries is ruled out by competition from financial markets. Financial markets allow high returns in good times and there is an incentive for households to withdraw their deposits from banks and invest the funds in the market. In such a financial system, setting cross-sectional risk sharing becomes correspondingly more important. The individuals or institutions acting on their behalf have to ensure that risks are managed and traded in a way so that those who are more tolerant of risk end up bearing it. Financial systems in such countries become more market oriented and risk management through the use of derivatives and other similar techniques becomes more important. This is also reflected in the evolutionary process of the financial system in the US. Until the mid-1970s, banks were the dominant form of financial institutions in the US and the structure was more like in Japan, France and Germany, whereby banks undertook inter-temporal smoothing. Subsequently, however, the occurrence of financial innovations has changed the form of financial system from a bank-based to a market-based one in the US with banks increasingly demonstrating their willingness to compete with markets. Accordingly, they have entered new markets and developed new products, while their traditional role of taking deposits and extending lending has been steadily shrinking. This has been accompanied by a shift from inter-temporal smoothing to cross-sectional risk sharing. The role of surviving intermediaries has evolved to facilitate cross-sectional management of risks through derivatives and so forth, rather than adopting inter-temporal smoothing of risks.
4.62 In Australia, the performance of the banking system since 1995 has been driven to a large extent by the developments in the household sector. Households have progressively invested an increasing share of their financial assets in market-linked products, through direct holding of equities, investments in unit trusts, and holdings of assets in superannuation and other managed funds. This also reflected, to some extent, changes made in retirement saving arrangements in Australia, notably the introduction of compulsory employer superannuation contributions, which were increased to 9 per cent of an employee’s earnings in 2002. To the extent that households invested in market-linked assets, the share of household savings held in deposits with banks and other deposit-taking institutions declined. The development of financial markets changed the banking environment instilling competitive pressures in banks’ traditional business lines, notably deposit taking and household lending. Banks initially hoped to attract a significant share of retirement savings into specially designated retirement savings accounts (RSAs) following the Government’s approval for these products in 1996. The RSAs are essentially term deposits that attract concessional tax rates if held until retirement age. These products, however, could not evoke much saving interest from the households because even though they were capital guaranteed the rates of interest failed to match the strong returns on investments in equity-based funds during the buoyant share market run in the 1990s. Reflecting limited success achieved in this regard, some of the largest banks adopted an alternative strategy by beginning a series of major acquisitions of asset/ wealth management funds so as to access the fees and income associated with the growing wealth-management sector. Consequently, nearly all of the Australian-owned banks offer some form of wealth management products. As a result of this expansion, banks controlled an estimated 40 per cent of retail funds under management in Australia in 2005 as compared to less than 20 per cent in the mid-1990s. Although these banks had difficulty in maintaining their share after acquisitions, wealth management has become an increasingly important source of revenue for the banking sector. While households’ demand for credit has been strong, the household saving rate has fallen and an increasing share has been channelled into non-deposit products. Thus, bank lending growth has outpaced the growth of low-cost retail deposits. Furthermore, the competition among banks for these deposits has also intensified and increasingly some of them have introduced high-yield on-line saving accounts beginning in the late 1990s offering high rates of interest to the depositors relative to traditional transaction and term deposits.
4.63 The banks in Australia also adopted a number of alternative approaches to fund their domestic lending growth, including securitisation and issuing debt securities. While some small banks made extensive use of the strategy of securitisation of their loans, the large banks funded the shortfall by accessing domestic wholesale markets and increasingly, by sourcing of funds from offshore. Consequently, the aggregate of foreign liabilities of Australian banks exceeded the value of retail deposits and accounted for 27 per cent of their total liabilities in 2005 as compared with 15 per cent in the mid-1990s. The foreign liabilities of Australian banks stood at around $ 370 billion in December 2005, with nearly two-thirds of these in the form of negotiable debt securities. The rest of the foreign liabilities comprised non-resident deposits and intragroup transfers. The intra-group transfers formed a relatively important source of funds for foreign bank branches operating in Australia. The shares of retail deposits and wholesale deposits were 23 per cent and 50 per cent, respectively, of total liabilities of the banking system. Australian banks issued securities to a range of markets and currencies, with over 80 per cent of outstanding offshore debt securities being issued into the US and UK markets and a further 10 per cent in Hong Kong and Japan. Despite offshore debt being predominantly (80 per cent) foreign denominated, Australian banks have little exposure to foreign-exchange risk, which is typically hedged using cross-currency swaps and foreign-exchange forward contracts. Net foreign currency debt on the balance sheets of Australian banks was $186 billion as at March 2005 ($117 billion four years ago), of which $168 billion was hedged in derivative markets. A concern, however, that is sometimes raised regarding banks’ reliance on foreign funding is the potential rolling over of debt in times of stress. Notwithstanding the difficulties that some emerging market sovereigns have had experienced in refinancing their foreign currency-denominated debt, there was little evidence that in countries with developed capital markets and floating exchange rates, the foreign investors were less likely to roll over their debt securities than were domestic investors (Hall and Veryard, 2006).
4.64 In comparison with the advanced countries, the saving rates in emerging market economies (EMEs) have generally remained higher; the banking systems played an important role in raising the saving rates. In Korea, the foundations of the modern financial system were laid during the early 1950s when the central and commercial banking systems were realigned under the new institutional bases provided by the Bank of Korea Act and the Banking Act. Specialised banks were established during the 1960s, to facilitate capital mobilisation and strengthen financial support for underdeveloped or strategically important sectors. Most non-bank financial institutions were introduced during the 1970s in order to diversify the financing sources, promote the development of the money market, and attract funds into the organised market. With a shift from a government-orientated stance on economic policy towards a market-orientated stance beginning the early 1980s, the number of commercial banks and non-bank financial institutions increased further as part of a series of broad measures to spur financial liberalisation and internationalisation. In the aftermath of the currency crisis in 1997, the Korean financial system underwent substantial changes in the course of the implementation of a comprehensive financial reform programme. In particular, the number of banking and non-banking financial institutions declined as a result of consolidation. Reflecting the structural changes in the financial system in Korea, the share of banks in total assets declined from around 67 per cent in 1995 to around 60 per cent in 2006. The share of merchant banking corporations in the total assets declined from around 5 per cent to around 1 per cent over the same period. This led to an increase in the shares of insurance companies from around 7 per cent to around 13 per cent and that of investment trust management companies from around 8 per cent to around 10 per cent during the same period. As at the end of June 2007, commercial banks in Korea consisted of 7 nationwide commercial banks and 6 local banks (with a total of 4,900 branches) and 36 foreign bank branches. The business demarcation, however, was strict with commercial banks permitted to engage in very limited securities business. They were also not allowed to undertake insurance business until August 2003, after which bancassurance was introduced permitting them to sell insurance products. The principal sources of funds for banks continue to be in the form of deposits, which was around 60 per cent at end-June 2007,while borrowings constituted around 25 per cent of the total sources of funds. Regarding the uses of funds, the banks deployed the largest proportion in extending loans which was around 71 per cent at end-June 2007.
4.65 In Thailand, the structure of financial system underwent significant changes both in terms of number of market participants and the volume of their market activities. By the mid-1980s, 30 commercial banks had 1,526 branches handling the majority of transactions in Thailand. The 16 largest banks accounted for over 90 per cent of assets, deposits, and loans of the commercial banks, indicating a high concentration and little competition in the banking industry (Barbara, 1987). With the growing wave of globalisation in the mid-1980s, Thailand began a progressive deregulation of the financial sector. On the interest rate front, the authorities gradually removed interest rate ceilings in order to encourage savings mobilisation and to make the financial system more dynamic. Interest rate ceilings on long-term time deposits were abolished in June 1989, on short-term time deposits in March 1990, on savings deposits in January 1992, and on loan rates in June 1992. In addition, the central bank in 1992-93 gave commercial banks more flexibility by loosening the requirement of government bond holding as a pre-requisite for opening up new branches. The obligations of commercial banks to extend credits to rural borrowers or those in the vicinity were also relaxed to cover more related occupations and wider geographical areas. An analysis of the liabilities of banks reveals that the share of deposits in total liabilities, which had declined from 77 per cent to 70 per cent in 1996, increased to 79 per cent reflecting post-crisis recovery. Thereafter, the share of deposits again declined to around 72 per cent in 2007. On the other hand, the share of borrowings in total liabilities, which had increased from 9 per cent in 1991 to 9.3 per cent in 1996, declined to 3.4 per cent in 2003 before increasing to 8.5 per cent in 2007. The ownership pattern shows that bank deposits in Thailand are predominantly held by households. However, the share of individuals in total deposits declined from around 69 per cent in 1999 to around 61 per cent in March 2008. On the other hand, the share of the business sector in total deposits rose from 16 per cent to 20 per cent during the same period.
4.66 The general decline in deposits since the early 1990s was reflected in the persistent fall in the gross domestic savings rate of Thailand from a peak of 36.3 per cent of GDP in 1991 to 35.1 per cent in 1997 (the crisis year). After recovering to the pre-crisis peak in 1998, the saving rate continued its declining trend and reached 31.8 per cent in 2006. This drop in the saving rate was mainly on account of the household sector, which could be attributed to three major factors such as the rise of social security programme, the boom in consumption and the shift between corporate and household savings. Since the early 1990s, the government, in its efforts to mobilise savings, instituted a multi-pillar approach to social safety net programme to ensure appropriate welfare for old ages and retirees as well as promote domestic saving. On the other hand, public and corporate sector saving rates behaved pro-cyclically. The share of net public saving in the gross saving rose from a low single digit in the early 1980s to roughly 25-28 per cent during the pre-crisis period of economic boom before dropping to 10 per cent right after the crisis. It, however, recovered to 18 per cent of gross national saving in 2002-03. The share of net corporate saving rose steadily from 9 per cent of gross national saving in the early 1980s to 25 per cent right before the crisis, reflecting the higher growth of the corporate sector income relative to other sectors in the economy during the time period. After the crisis, its share, however, plummeted temporarily to 6 per cent, but rose subsequently to a high of around 26 per cent in 2002-03, given favourable economic conditions and rising corporate profits after the crisis (Pootrakool et al, 2005).
4.67 In China, prior to the late 1970s, People’s Bank of China (PBC) was virtually the only financial institution that conducted all types of financial services business (though very limited in variety and size), besides being the regulator. The dual banking system emerged in 1984 with the separation of commercial banking from central banking (Shiyu, et al. 2006). Apart from the separation of Industrial and Commercial Bank of China from the PBC, three other specialised banks emerged. However, their business operations were limited within the framework of a planned economy. In tandem with the reforms towards a socialist market economy, these specialised banks were made to transform into real commercial banks in 1993. This was facilitated by the emergence of three large policy banks in 1994 to separate policy financing and commercial financing. The Law of Peoples’ Republic of China on Commercial Banks was enacted, establishing the specialised banks as state-owned commercial banks but making them responsible for their business operations. By the end of 2004, apart from the four state-owned commercial banks and three policy banks, several other type of banks such as 12 share-holding commercial banks, 112 city commercial banks, 681 urban credit co-operatives (UCCs), 32,854 rural credit co-operatives (RCCs), eight rural cooperative banks, seven rural commercial banks, 211 foreign financial institutions, 220 foreign bank representative offices, four asset management companies, 59 trust and investment companies, 74 finance companies, 12 financial leasing companies, three auto financing companies and a large number of post office savings institutions emerged. Reflecting the expansion of the financial system, deposits grew steadily from 31.1 per cent of GDP in 1978 to 176.2 per cent of GDP in 2004. Despite the diversification of the financial systems in terms of institutions and markets, banks continue to predominate reflecting more public confidence on banks over other market-based institutions facilitated by the implicit insurance cover provided by the State. Although the Gover nment has attempted to provide similar protection and intervention to capital market, the nature of capital market has tended to make the public less confident. Therefore, the process towards market-based financial activity in China has yet to be steady or significant (Liping He, 2005).
4.68 To sum up, the cross-country experiences suggest that as the financial sector develops, the savers are attracted towards new financial instruments away from the traditional bank deposits. This is more so when capital markets witness favourable conditions. The decline in the deposits held by the household sector, however, is compensated by deposits by non-bank intermediaries. Thus, the banking sector experiences a reduction in size in relation to other intermediaries, but not in relation to total financial assets of the economy. In fact, the current phase of the banking sector in India more or less mirrors this pattern. Nevertheless, banks combine aggressive deposit mobilisation with exploring newer ways of raising cost-effective non-deposit resources to meet their resource requirements. This, however, poses many challenges to both the banks and the regulators in view of its implications for liquidity and solvency of banks and the overall stability of the financial system. In emerging markets, resource mobilisation by banks has played an important role in sustaining high domestic saving rates. In recent years, however, deposits mobilised by banks moderated somewhat, reflecting disintermediation, boom in consumption as well as the need for enhanced social security programmes necessitated by the changing demography.
V. EMERGING ISSUES AND THE WAY FORWARD
4.69 As the Indian experience shows, the acceleration of economic growth has been largely enabled by the sustained increase in the level of domestic savings, expressed as proportion of GDP. Historically, household savings have been the mainstay of the gross domestic savings of the Indian economy. In recent years, however, there has been sharp increase in the private corporate savings and public sector savings rates, reflecting strong growth in corporate profitability and fiscal prudence due to the implementation of the Fiscal Responsibility and Budget Management (FRBM) Act, 2003. It may, however, be noted that the improvement in corporate sector savings on account of higher profitability was largely an outcome of the reforms pursued over the years, whereby forces of global competition and conducive policy environment led to an improvement in productivity and efficiency. In the years ahead, acceleration in the saving rate of the private corporate sector may not continue at the same scale in view of the fact that the early benefits of reforms reaped by the corporate sector, especially by deleveraging of balance sheets, may not be available at the same scale in future (Mohan, 2008). Similarly, with the Central Government budgeting a revenue deficit of 1 per cent of GDP instead of 0 per cent of GDP as stipulated under the FRBM Act for 2008-09 and further risks to fiscal consolidation from various factors, including the expected pressures from the implementation of the Sixth Pay Commission award, there would be limits to further increases in public sector saving rates in the short run. Therefore, improving the household sector saving rate should constitute the main plank for sustaining the overall domestic savings in the Indian economy.
4.70 In this regard, it may be noted that the share of financial savings (net of financial liabilities) in total household savings has declined by almost 10 percentage points to around 47 per cent in the current decade, reflecting higher savings in physical assets. Accordingly, a major challenge would be to raise financial saving rate which would depend on further deepening of the financial sector through introduction of new instruments with features catering to the household sector’s requirement consistent with their risk-return and maturity profiles as well as through the continuation of insurance and pension reforms. Furthermore, another challenge would be to release resources of the household sector held in physical assets over and above the genuine requirement for savings in various financial assets. Although households continue to hold their financial savings mainly in the form of bank deposits, there was a significant decline in its share in total financial savings from an average of around 45 per cent during 1970-1984 to around 37 per cent during 1995-2005, before increasing to 51 per cent in the last two years. The recovery partly reflects the aggressive efforts at mobilisation of time deposits by banks from 2005-06 onwards to meet high credit demand and was partly facilitated by the Government measure of extending tax incentives on special bank deposit schemes. The interest rate differential between small savings/post office deposits and bank deposits, which narrowed down initially, turned subsequently in favour of bank deposits in view of unchanged interest rates on small savings/post office deposits, which also made the bank deposits more attractive. Accordingly, the sharp jump in time deposit growth reflected to an extent some switch away from small savings, signifying only a portfolio shift and it is a moot question as to whether the current trend would be sustained. Therefore, to sustain the recent trend in deposits, banks need to tap hitherto untapped savings, especially in rural areas, by introducing appropriate deposit schemes suitable to savers with various risk and return profiles.
4.71 The current phase of high growth has been supported by a step up in the household gross financial saving rate, which, in turn, has been led by aggressive mobilisation of deposits by the banks. It is observed that the increase in the growth rates of real GDP from 5.8 per cent during 1992-93 to 2002-03 to 8.8 per cent during 2003-04 to 2006-07 was supported by the household gross financial saving rate increasing from 12.1 per cent of GDP to 15.6 per cent. Over the same period, the ratio of bank deposits to household gross financial savings increased from 36.7 per cent to 44.0 per cent. A sensitivity analysis based on these trends shows that raising real GDP growth by one percentage point would require 1.2 percentage point increase in the household gross financial saving rate (gross financial savings/nominal GDP) in the current phase of economic growth. This, in turn, would require the ratio of bank deposits to gross financial savings to grow by 2.5 percentage point. In the light of the growing resource requirements for sustaining the high growth momentum of the Indian economy, banks would have to reassess their traditional strategies of resource mobilisation, including from the rural sector.
Implications of Changing Pattern of Bank Deposits
4.72 Following the financial liberalisation since the early 1990s, some shifts have taken place in the ownership pattern of bank deposits. The household sector’s share in aggregate deposits has steadily declined, while the shares of the Government and corporate sectors have increased. The decline in household sector’s share reflects mainly the sharp fall in their shares in term deposits. The increased interests from the corporate and Government sectors reflects the favourable impact of successive shortening of the stipulated minimum maturity of time deposits as well as the policy of allowing banks to offer differential interest rates on wholesale term deposits. Another notable feature in respect of time deposits has been the decline in the share of deposits of over five years maturity across all the sectors, reflecting availability of alternative saving instruments with attractive returns. This phenomenon is not confined to India alone and was observed in several other countries, as was alluded to earlier.
4.73 As the financial sector develops, the share of non-deposit saving instruments tend to increase at the expense of bank deposits. This trend is expected to accentuate in the coming years. The challenge, therefore, for the banks is to mobilise hitherto untapped savings and to improve their services to not only retain their existing depositors but also attract new depositors. They would also have to widen their deposit base through exploring new opportunities thrown up by the recent emphasis on inclusive growth and financial inclusion. As the growth process strengthens and becomes more inclusive, it is expected that demand for financial products would accelerate rapidly, necessitating a greater penetration of banking services.
Changing Demographics and Financial Services
4.74 Banks also have to recognise the changing saving patterns associated with the changing demographic profiles. The proportion of population in the working age group of 15-64 years is expected to increase steadily from 62.9 per cent in 2006 to 68.4 per cent in 2026. Accordingly, the dependency ratio (ratio of dependent to working age population), which declined from 0.80 in 1991 to 0.73 in 2001, is expected to decline further to 0.59 by 2011 (GoI, 2008). The changing demographics appear to have played a role in the shift in composition of household savings towards physical assets, especially reflecting housing demand. Accordingly, banks would also need to devise innovative strategies of mobilising surplus resources from a progressively younger age profile of savers. Another noticeable feature emerging in India is that public sector employment, which grew by an average of 1.53 per cent per annum during 1983-1994, declined by 0.70 per cent during 1994-2005. On the other hand, growth in private sector employment in the organised sector accelerated from 0.44 per cent to 0.58 per cent over the same period. With the private sector leading the growth in organised employment, there would be an increased demand for varied financial products such as insurance and other contractual saving instruments consistent with the changing risk-return profiles of the working age population. The changing demographics and employment patterns would generate demand for a wide range of financial services such as insurance, housing and other financial products with innovative features. In order to reap the benefits of the changing demographics and employment patterns, banks would have to re-orient their role as financial intermediaries beyond the traditional confines of passive deposit mobilisation and lending by providing a package of financial services as demanded by the customers. Ipso facto, the customers would be keeping their deposits with the banks.
Rural Deposit Mobilisation – Need for Innovations
4.75 Against the backdrop of a decline in the share of rural deposits in total deposits of SCBs since the 1990s, there is a need to step up efforts to access rural savings to raise the overall deposit mobilisation of banks. Although there are many challenges, the rural sector throws up vast opportunities for banks to reap the benefits of low cost large deposit base, which may not be available to other financial intermediaries. The international experience provides some useful lessons in this regard.
4.76 The rural sector harnesses the power of providing small amounts of household savings which can be mobilised by the banks that can be made available for productive uses to rural and agricultural enterprises. A major challenge faced by banks in rural areas is that deposit transactions often involve small amounts and display irregular patterns reflecting seasonality and erratic nature of small scale income generating activities. In order to cater to this demand, many banks in the Philippines have adopted ‘piggy banking’ concept, whereby small locked boxes were provided to the savers to be maintained at their homes after opening of the savings account with a minimum deposit. The keys were kept with the banks. This allowed the clients to save small amounts on a daily basis in their boxes and bring them to the banks when they intended to deposit their savings. This enabled reduction in banks’ time on collections (USAID, 2005). Another major challenge lies in identifying appropriate technologies to reduce significantly the costs of doing rural business that result from low population density and poor physical infrastructure. While technological and management information system (MIS) solutions are necessary to overcome this challenge, their impact on the efficiency, quality of services, bottomlines and outreach potential of the banks need to be carefully assessed. For instance, local technology firms in the Philippines helped develop open source software to meet the specific needs with multiple branches and units and the central bank’s data processing and reporting requirements. This software allowed customisation of the technology by the rural banks and its flexible adjustment in tandem with additions or changes in products. It proved to be high quality and cost effective system that improved the banks’ ability to quickly and efficiently handle multiple transactions and more clients. Thus, although there are challenges in tapping rural savings, the international experience shows that these challenges could be met effectively by adopting some innovative methods. The experience of other countries with suitable adaptations can be a guide to the banks attempting to expand their outreach in the rural sector and boost rural savings.
Competition from Other Intermediaries/Markets
4.77 With greater avenues for the deployment of funds and the prospects for higher returns enabled by the development of markets, investors progressively diversify their por tfolios across instruments and institutions, thereby demanding financial services for management of cross-sectional risks. This leads to a change in the nature of the demand for intermediation services, whereby investors look beyond stable returns offered by bank deposits while parking their surplus funds. This, in turn, leads to the emergence of a number of specialised intermediaries/markets that are able to cater to the evolving investor requirements. Against the backdrop of the ongoing financial innovations following the adoption of financial liberalisation in India in the early 1990s, equity market related instruments such as equity shares and units of mutual funds have been gaining importance in view of their higher returns, albeit with higher embedded risks. To an extent, this trend has resulted from the natural process of financial market development, whereby new instruments gain popularity with a decline in transactions cost and asymmetric information. By enabling investors in better assessment of risk-return perceptions, this has widened the choices of investments. With traditional deposit base of banks shrinking with these developments, there is a need for them to extend their outreach to prospective depositors/investors by expanding the ambit of the specialised financial services offered by them by repackaging and redesigning of products to suit individual needs.
4.78 Banks, however, face various constraints compared to non-banks while diversifying their activities. First, non-banks are able to manage their resources more effectively by having a leaner cost structure and quickly adopting new technologies, thereby offering higher returns. Furthermore, non-bank intermediaries such as brokerages, asset management firms and mutual funds are able to offer specialised services like cash management and wealth management for various investors, including high net worth individuals. Second, unlike non-banks, banks are often subjected to various regulatory requirements such as statutory stipulations of reserve requirements, directed lending, prudential regulations driven provisioning requirements and limits on capital market exposures. While these measures promote financial stability, they constrain the diversification opportunities thrown by a developing financial system. Third, special deposit schemes announced by the Government from time to time which offer not only higher returns but also provide tax incentives, boost effective returns vis-à-vis the traditional bank deposits, thereby constraining banks’ effor t at deposit mobilisation. While various restrictions on banks and prudential requirements may be justifiable from the special role banks play in the system, the policy anomaly arising out of tax benefits needs to be removed to provide banks a level playing field.
Need for Continued Focus on Deposits
4.79 Banks have the benefit of low cost deposit base which, to an extent, make them immune from the day-to-day market volatilities. Thus, the core deposit base serves as a source of ‘stored liquidity’ which is durable as compared with ‘borrowed liquidity’ originating from the market. Another distinguishing feature is that while deposits rates are relatively more rigid, interest rates on borrowing vary more flexibly in tune with the market conditions. During periods of favourable macroeconomic conditions characterised by abundant liquidity and low nominal rates, the low perception of financial risks often induces financial market participants to undertake progressively higher risks. On the other hand, during periods of turbulence caused by any unforeseen event, the resultant reassessment and repricing of risks by investors trigger heightened uncertainties in the market and thereby expose the excessively leveraged entities to the risk of default. Therefore, while accessing the market for borrowed liquidity have the benefits, the probability of excessive leveraging associated with borrowings calls for adequate safeguards to protect the fund base from unforeseen events. This was borne out by the Northern Rock crisis, a UK-based bank, which had a higher share of borrowed liquidity vis-à-vis stored liquidity. Faced with problems in mobilising funds from the market due to the tightening of credit conditions, the performance of the bank was adversely affected prompting depositors to withdraw their money in large numbers, which ultimately resulted in a bank run.
4.80 Banks in India have traditionally relied on deposits for their funding requirements. Their reliance on borrowings has been insignificant. As the economy expands and the demand for funds increases, banks at times may find their deposit resources to be insufficient for meeting the growing demand, thereby encouraging them to raise funds by way of borrowings. Going by the Northern Rock experience, heavy borrowing by banks has serious implications, especially during financial distress, and, therefore, too much reliance on borrowings needs to be avoided. In case banks resort to such borrowings, they also need to adopt appropriate internal risk management strategies. In particular, while the increased flexibility given to banks in India in recent years opens up new opportunities for raising resources, the enhancement of associated risks would demand appropriate management of their liabilities through minimising costs along with mitigation of risks arising from adverse movement in interest rates and exchange rates. They need to regularly review their business strategies so that they are in a position to combine longer term viable financing with profitability in operations.
Need for Skill Development in Banks
4.81 Banks while gearing to face competition from non-banks and capital market instruments both at home and abroad, which is likely to increase in future, would have to appropriately price and package their products to remain competitive, which would demand appropriate skill development at bank levels. While banks have the potential, they need to invest significantly in skill enhancement at all levels, for developing innovative products and delivering new service modes in the face of increased competition. Public sector banks face added challenges while attracting and retaining new personnel in the face of rigid compensation structures in comparison with private and foreign sector banks.
Implications for Monetary Policy
4.82 Moving forward, resource mobilisation that dovetails into the transition to the higher growth trajectory is likely to lead to more product innovations on the part of both banks and non-banks. With the blurring of distinctions between banks and non-banks from the functional perspective and increased substitutability of bank deposits with other saving instruments, the assessment of monetary aggregates for drawing policy perspectives would have to be carefully undertaken. Furthermore, addition of new features into the financial instruments would have implications for the conventional mode of accounting based on identifiable characteristics of money. With the growth process strengthening and becoming more inclusive, the demand for housing, urban services, retail and utilities is expected to be scaled up as disposable incomes grow. In such a scenario, it is likely that growth in bank credit and monetary aggregates might deviate, and persistently so, from what might be expected from historical relationships and elasticities in view of the ongoing structural changes. This raises the critical issues of clarity in reading signs of inflation, asset prices and systemic liquidity from money/credit expansion.
VI. SUMMING UP
4.83 Historically, banks in India have played a central role in mobilising and allocating resources for supporting the growth process. The nationalisation of private sector banks in 1969 marked a turning point in the history of the banking sector in India. Large branch expansion that followed enlarged the deposit base of banks in rural and semi-urban areas. Although another wave of nationalisation in 1980 carried forward this process, the aggressive strategies of fund mobilisation by mutual funds and NBFCs in the backdrop of buoyant capital market in the second half of the 1980s set in process of some disintermediation of household savings. Some deceleration in bank deposit growth was again observed during 1995-2005 in tune with the maturing of saving preferences under a deregulated market environment. However, bank deposits growth accelerated significantly during 2005-2008 due to vigorous deposit mobilisation efforts by banks in the wake of strong credit offtake. This was despite the sharp growth in other instruments such as shares and units of mutual funds.
4.84 Bank deposits have all along been the mainstay of the savings process in the Indian economy. Although banks have played an increasingly important role in stepping up the financial savings rate, physical savings, nevertheless, have tended to grow in tandem with the financial savings. A major challenge, thus, is to convert unproductive physical savings into financial savings. This is also necessary for banks as they face several challenges in realising the full potential of deposit mobilisation in a growing economy. Bank deposits have become relatively less attractive to the households in view of the availability of a wide menu of alternative saving instruments offering scope of higher returns to savers. Furthermore, savers have also become more informed in managing risks of their portfolios through the use of specialised services offered by other financial intermediaries. This behaviour is expected to accentuate in future. In view of the shrinking share of the household sector deposits in total deposits, banks need to explore ways of broadening the depositor base as also provide improved services for retaining their clientele. It is, therefore, necessary for banks to seek for new sources of deposits. There is an enormous potential in rural and semi-urban areas and banks need to tap these sources. This, however, would require banks to offer customised products with features suitable to individual risk-return requirements as well as economise on their operational costs through diversification of activities. In this context, the recent policy emphasis on financial inclusion offers greater scope for banks to widen their deposit base. Furthermore, the changing demographics and employment patterns have also thrown opportunities for banks to expand their role by bringing the depositors with younger age profile within their fold. The substitution of funds from banks to non-bank instruments and vice-versa has been observed in the recent past and such trends may also occur in future. This would call for greater care in the assessment and interpretation of monetary aggregates. |
 IST,
IST,


