 IST,
IST,
IV. Price Situation
Inflation pressures firmed up in a number of economies during the first half of 2005-06, reflecting the impact of further increases in international crude oil prices. Although international crude oil prices have reached record highs and a significant part of the increase is now increasingly viewed as somewhat permanent, the impact on economic activity and inflation expectations seems to have been largely contained till recently reflecting a variety of factors such as increased competition due to globalisation, fall in intensity of oil use in advanced economies, and continuous pre-emptive monetary tightening through measured increases in policy rates in a number of economies. However, in view of the sharp increase in consumer price inflation recently, the issue of changes in inflation expectations has been revived globally in the recent weeks.
In India, inflation eased further in the second quarter, despite continued dominance of supply-side factors. Fiscal and monetary measures undertaken since mid-2004 to reduce the impact of imported price pressures on domestic inflation and to stabilise inflationary expectations, coupled with the base effects and the revival of monsoon, enabled a moderation in the headline inflation rate during the first half of 2005-06. It needs to be recognised that the pass-through of high international crude oil prices to domestic prices remains incomplete.
Global Inflation
Reflecting the impact of continuing increases in international crude oil prices, consumer price inflation in developed countries is projected to edge up to 2.2 per cent in 2005 from 2.0 per cent in 2004 and its recent trough of 1.5 per cent in 2002. In developing Asia, although inflation is projected at 4.2 per cent in 2005, unchanged from 2004 - but double of 2.1 per cent recorded in 2002 - a number of economies in the region such as Thailand, the Philippines and Indonesia face large upward inflationary pressures from fuel prices. Even as inflation has remained firm, interest rate cycles across the world show a divergent trend reflecting the differences in the strength of economic activity. While the US, Canada, India, Korea, Thailand, Indonesia and the Philippines have raised their policy rates in the past six months, monetary policy has been eased in the UK, Brazil, Sweden and Poland. At the same time, accommodative stance continues in Japan and euro area to support economic recovery. However, in view of the sharp increase in consumer price inflation in September 2005, the European Central Bank while leaving the policy rates unchanged in its latest meeting held on October 6, 2005 stressed that strong vigilance with regard to upside risks to price stability is warranted, so that the increase in the current inflation rate does not translate into higher underlying inflationary pressures in the euro area.
In the US, consumer price inflation, which had decelerated to 2.5 per cent in June 2005, accelerated to 4.7 per cent by September 2005 due to sharp increase in energy costs. Core inflation (i.e., excluding food and energy prices) after edging up during 2004 appears to have stabilised at around two per cent since early 2005. Reflecting the strong economic activity and the incipient inflationary pressures, the
Table 22: Inflation Indicators – Developed Economies
|
(Per cent) |
|||||||||
|
Country/ |
Key Policy |
Policy |
Changes in |
2004 |
2005 (Latest) |
||||
|
Region |
Rate/Bank |
Rates |
Policy Rates in |
||||||
|
Inflation |
Growth |
Inflation |
Growth |
||||||
|
Reserve Target |
(Latest) |
basis points |
|||||||
|
(y-o-y) |
(September) |
(y-o-y) |
|||||||
|
(January 2005 - |
|||||||||
|
October 19, 2005) |
(Q2) |
||||||||
|
1 |
2 |
3 |
4 |
5 |
6 |
7 |
8 |
||
|
Australia |
Cash Rate |
5.50 |
25 |
2.3 |
3.2 |
2.5 (Q2) |
2.6 |
||
|
Canada |
Overnight Rate |
3.00 |
50 |
1.8 |
2.9 |
2.6 |
* |
2.7 |
|
|
Euro area |
Interest Rate on |
2.00 |
Unchanged |
2.1 |
2.0 |
2.6 |
1.1 |
||
|
Main Refinancing |
|||||||||
|
Operations |
|||||||||
|
Japan |
Target Balance of |
30-35 |
Unchanged |
0.0 |
2.7 |
-0.3 |
* |
1.4 |
|
|
Current Account |
trillion yen |
||||||||
|
New Zealand |
Official Cash Rate |
6.75 |
25 |
2.3 |
4.8 |
3.4 (Q3) |
2.6 (Q2) |
||
|
UK |
Repo Rate |
4.50 |
-25 |
1.3 |
3.2 |
2.5 |
1.5 |
||
|
US |
Federal Funds Rate |
3.75 |
150 |
2.7 |
4.2 |
4.7 |
3.6 |
||
|
*August. |
|||||||||
US Federal Reserve persevered with its measured pace of monetary tightening raising its target Federal Funds rate by a further 100 basis points since end-March 2005 (25 basis points hike at each of its four meetings) to take the Fed Funds rate to more neutral levels (Table 22). According to the US Federal Open Market Committee (FOMC), although higher energy and other costs have the potential to add to inflation pressures, longer-term inflation expectations in the US remain well contained. The FOMC has thus continued to remove policy accommodation at a measured pace.
In the UK, CPI inflation accelerated to 2.5 per cent in September 2005 – the highest rate since January 1997 – driven up by higher oil prices, catching up with producer price inflation (Chart 21). The Bank of England, however, cut the policy repo rate by 25 basis points on August 4, 2005 in response to the weakening of
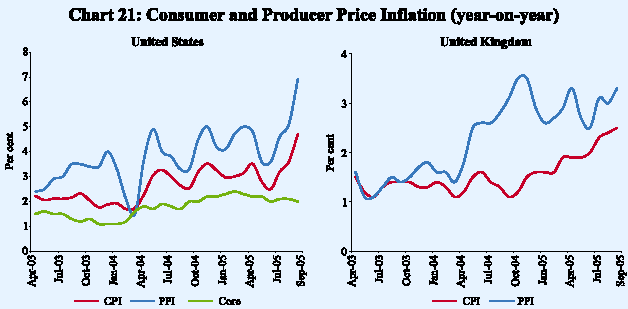
economic activity. As pressures from labour costs remained contained, risks to inflation are seen as weighted slightly to the downside in the medium term.
Euro area inflation, measured by the Harmonised Index of Consumer Prices (HICP), led by high oil prices increased to 2.6 per cent in September 2005 -exceeding the target of ‘close to 2.0 per cent’ (Chart 22). Taking into account the potential second-round effects in wage and price setting behaviour triggered by ongoing oil price rises, the European Central Bank (ECB) has chosen to maintain its existing monetary policy stance (unchanged since March 2003) even as economic activity is likely to weaken in 2005.
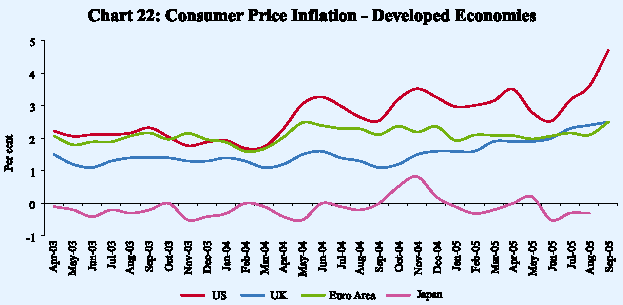
In Japan, mild deflation continues. Consumer prices, year-on-year, declined by 0.3 per cent in August 2005 as compared with a decline of 0.2 per cent a year ago. Producer price inflation remained steady at 1.7 per cent in August 2005 due to higher oil prices. With annual rate of change in consumer prices projected to be nil or a slight increase towards the end of the year, the Bank of Japan (BoJ) persisted with the target range for bank reserves at 30-35 trillion yen set since January 2004 while allowing the balance of current accounts with it to fall short of the target in case of weak liquidity demand.
In China, producer price inflation (y-o-y) increased to 5.3 per cent in August 2005 driven up by higher crude oil prices (36.2 per cent). On the other hand, consumer price inflation decelerated to 1.6 per cent in August 2005 from 5.3 per cent a year ago, due to a decline in prices of food items and clothing as well as incomplete pass through of higher oil prices to domestic oil prices (Chart 23). Various administrative and monetary measures by the People’s Bank of China (PBC) have been able to moderate money and credit growth.
Amongst other Asian economies, inflation in Indonesia increased to 9.1 per cent in September 2005, driven up by increases in administered fuel prices and currency depreciation. With inflation expected to be 9 per cent in 2005 – above
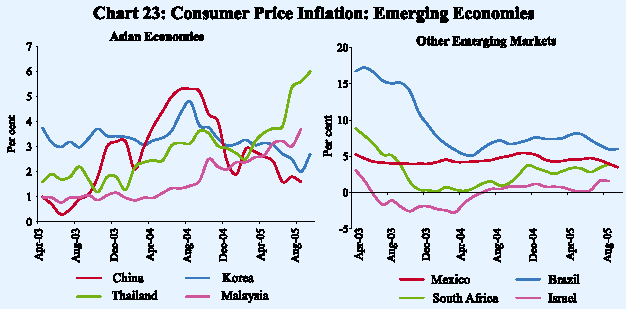
the medium-term inflation target of 6 (+/-1) per cent - and continued uncertainty over world oil prices, the Bank Indonesia raised the policy rate by a further 150 basis points - 50 basis points on September 6, 2005 and another 100 basis points on October 4, 2005 - to 11.0 per cent. In the Philippines too, CPI inflation at 7.0 per cent in September 2005 remains above the target of 4-5 per cent. With supply-side inflation pressures expected to build up further over the policy horizon through the second-round effects of higher oil prices, the Bank of Philippines raised the policy reverse repo rate further by 25 basis points on September 22, 2005. In Thailand, both headline (6.0 per cent) and core (2.3 per cent) inflation accelerated in September 2005 driven up by persistent increases in oil prices. With growth momentum remaining strong and probability of core inflation exceeding the target range (0-3.5 per cent) due to increasing oil prices, the Bank of Thailand raised policy interest rates further by 100 basis points - 50 basis points each on September 7 and October 19, 2005 - to 3.75 per cent (Table 23). In Korea, although inflation at 2.7 per cent in September 2005 (3.9 per cent a year ago) was below the target, inflationary pressures are seen due to the persistently high oil prices. The Bank of Korea accordingly reversed its accommodative stance pursued since November 2004 and raised the policy rate by 25 basis points to 3.50 per cent on October 11, 2005.
To conclude, inflation pressures have increased in a number of economies during 2005-06 so far. However, despite large oil price increases during 2004 and 2005, the rise in global consumer price inflation has been relatively muted so far compared to the earlier oil shocks. This reflects a number of factors: the declining role of commodity prices in final output and reduced intensity of oil use, especially in advanced economies; heightened competition brought about by forces of globalisation and increased deregulation; and, finally, better anchored inflation expectations have so far mitigated the second round effects of the oil price hikes. Another reason as to why headline inflation has been muted so far is that the pass-through from international prices to
Table 23: Inflation Indicators – Developing Economies
|
(Per cent) |
||||||||||
|
Country/ |
Key Policy |
Policy |
Changes in |
2004 |
2005 (Latest) |
|||||
|
Region |
Rate/Bank |
Rates |
Policy Rates in |
|||||||
|
Inflation |
Growth |
Inflation |
Growth |
|||||||
|
Reserve Target |
(Latest) |
basis points |
||||||||
|
(y-o-y) |
(September) |
(y-o-y) |
||||||||
|
(January 2005 - |
||||||||||
|
(Q2) |
||||||||||
|
October 19, |
2005) |
|||||||||
|
1 |
2 |
3 |
4 |
5 |
6 |
7 |
8 |
|||
|
Brazil |
Selic Rate |
19.50 |
175 |
6.6 |
4.9 |
6.0 |
3.9 |
|||
|
China |
M2 |
3.9 |
9.5 |
1.6 |
* |
9.5 |
||||
|
India |
Reverse Repo Rate |
5.00 |
25 |
3.8 |
6.9 |
# |
3.4 |
* |
8.1 |
|
|
Israel |
Key Rate |
3.75 |
(-) 15 |
-0.4 |
4.4 |
1.6 |
* |
4.8 |
||
|
Korea |
Overnight Call Rate |
3.50 |
0.25 |
3.6 |
4.6 |
2.7 |
3.3 |
|||
|
Mexico |
Reserve Requirement |
79 million |
10 million |
4.7 |
4.4 |
3.5 |
3.1 |
|||
|
(Peso short position) |
pesos |
(tightened) |
||||||||
|
Philippines |
Reverse Repo Rate |
7.25 |
50 |
6.0 |
6.0 |
7.0 |
4.8 |
|||
|
South Africa |
Repo Rate |
7.00 |
(-) 50 |
1.4 |
3.7 |
3.9 |
* |
4.5 |
||
|
Thailand |
14-day Repo Rate |
3.75 |
175 |
2.7 |
6.1 |
6.0 |
4.4 |
|||
|
* August. # Fiscal year 2004-05. |
||||||||||
domestic prices of oil has been less than complete due to sharing of the burden by the Governments, especially in a number of emerging economies. However, with oil prices continuing their upward movement, the policy of low pas-through to domestic oil prices poses risks to fiscal health and macroeconomic stability. Furthermore, it also discourages efficiency in use of oil. Many countries have, therefore, begun to pass on higher oil prices to domestic consumers.
Global Commodity Prices
Continuous upward movements in international crude oil prices to record highs have dominated global commodity markets since early 2004 (Chart 24). Non-fuel commodity prices, on the other hand, which had moved up again during the last quarter of 2004-05 led by sharp increases in metals prices appear to
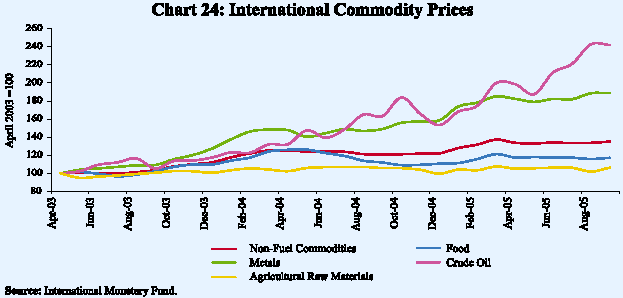
have stabilised, albeit at elevated levels, during April-September 2005. The IMF’s non-fuel commodity price index declined by 1.6 per cent in September 2005 over March 2005 and year-on-year growth in the index slowed down to 11.8 per cent in September 2005 from 16.7 per cent a year ago.
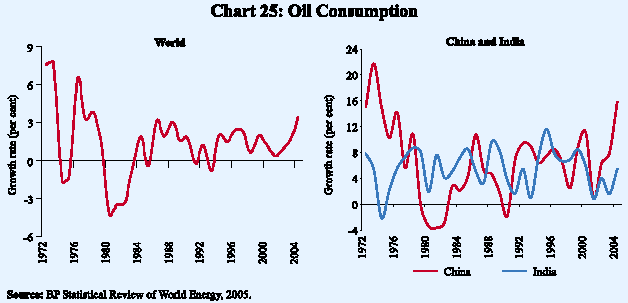
Strong growth in global demand, lags in developing new supply and economic resilience to higher energy costs have supported oil prices at elevated levels despite periodic increases in supply by the Organisation of the Petroleum Exporting Countries (OPEC). Global demand for oil is estimated to have increased sharply from less than one per cent during 2002 to 3.2 per cent during 2004 – the fastest rate of growth since 1978 (Chart 25). In particular, Chinese oil demand increased by around 16 per cent during calendar year 2004 contributing one third of incremental global demand.
In an environment of strong demand and historically low levels of global spare production capacity, temporary supply disruptions due to tropical storms in the US (more recent being the hurricanes Katrina and Rita during August-September 2005) and concerns over stability of supplies from the Middle East due to geo-political uncertainties further added to nervousness in the world oil market. Besides fundamentals, speculative positions, which often react disproportionately to relatively minor supply shocks, have imparted a great deal of volatility to oil prices. Reflecting all these factors, international crude oil prices surged further in 2005-06, touching successive record highs in recent months. The US West Texas Intermediate (WTI) crude prices rose to a historical high of US $ 70.8 a barrel on August 30, 2005 in the immediate aftermath of Hurricane Katrina. Prices, however, moderated somewhat to around US $ 65 a barrel by end-September, 2005 reflecting concerted efforts by the International Energy Agency (IEA) to release emergency stocks of 2 million barrels a day (mb/d) of crude and products to compensate for the outage in the US Gulf Coast due to the Hurricane Katrina. The decision by the OEPC in its Vienna meeting during September 19-20, 2005 to make available existing spare capacity in member countries of around 2 mb/d for a three-month period and further signs of slowing global demand growth also helped moderate prices. On the whole, over the past one and a half year, international crude oil prices have surged by 83 per cent from US $ 33.7 per barrel in March 2004 to US $ 61.7 per barrel in September 2005 (Table 24). Dubai crude prices which were subdued during June-October 2004 relative to the increase in the prices of US WTI have risen faster since January 2005, narrowing the gap in pricing between markets.
Table 24: International Crude Oil Prices
|
(US dollars per barrel) |
||||||
|
Item |
2002-03 |
2003-04 |
2004-05 |
March 2005 |
June 2005 |
September 2005 |
|
1 |
2 |
3 |
4 |
5 |
6 |
7 |
|
Dubai Crude |
25.9 |
26.9 |
36.4 |
45.6 |
51.0 |
56.5 |
|
UK Brent |
27.6 |
29.0 |
42.2 |
53.1 |
54.3 |
63.0 |
|
US WTI |
29.2 |
31.4 |
45.0 |
54.2 |
56.4 |
65.5 |
|
Average Crude Price |
27.6 |
29.1 |
41.3 |
50.9 |
53.9 |
61.7 |
|
Memo item: |
||||||
|
Indian Basket Price |
26.6 |
27.8 |
38.9 |
48.8 |
52.4 |
59.3 |
|
Sources :International Monetary Fund and the World Bank. |
||||||
The Gulf of Mexico coast region is a major oil and natural gas supply centre for the United States with significant offshore oil and natural gas production, refining capacity, and petrochemical facilities, and serves as a major import hub and nexus for pipeline infrastructure. The recent hurricanes have caused significant direct damage to offshore rigs, refineries, pipelines, and ports in the Gulf of Mexico. The hurricane season is not yet over and the severity and location of hurricanes over the next few months could continue to influence world oil markets. With limited spare global crude oil production capacity and the U.S. oil production and refining industries still to recover, oil prices are likely to react sharply to any additional disruption of or damage to petroleum infrastructure (Table 25). The continued geo-political risks, such as the insurgency in Iraq and potential troubles in Nigeria
Table 25: World Supply-Demand Balance of Oil
|
(Million barrels per day) |
||||||||
|
Item |
2002 |
2003 |
2004 |
2005 (P) |
2005 |
|||
|
Q1 |
Q2 |
Q3 (P) |
Q4 (P) |
|||||
|
1 |
2 |
3 |
4 |
5 |
6 |
7 |
8 |
9 |
|
Demand |
||||||||
|
1. OECD |
47.9 |
48.7 |
49.5 |
49.6 |
50.4 |
48.6 |
49.4 |
50.0 |
|
2. Non-OECD |
30.4 |
31.2 |
33.0 |
34.1 |
33.6 |
33.7 |
33.9 |
35.3 |
|
-China |
5.2 |
5.6 |
6.5 |
6.9 |
6.7 |
6.9 |
7.0 |
7.2 |
|
A. Total (1+2) |
78.4 |
79.9 |
82.5 |
83.7 |
83.9 |
82.3 |
83.3 |
85.3 |
|
Supply |
||||||||
|
3. Total Non-OPEC |
47.9 |
48.9 |
50.1 |
50.2 |
50.4 |
50.6 |
49.7 |
49.9 |
|
4. OPEC |
29.0 |
30.7 |
32.9 |
34.1 |
33.7 |
34.0 |
34.3 |
34.5 |
|
B. Total (3+4) |
76.9 |
79.6 |
83.0 |
84.3 |
84.2 |
84.6 |
84.0 |
84.4 |
|
P : Projections. |
||||||||
|
Source : US Energy Information Administration, October 2005. |
||||||||
and Venezuela, have boosted the level of uncertainty in world oil markets. The consensus at the present moment thus appears to be that oil prices would remain at elevated levels at around US $ 60 per barrel or above.
Turning to non-fuel group, agricultural commodity prices eased during April-September 2005 on improved crop prospects/stocks. As the global production of wheat and coarse grains is likely to decline due to adverse weather conditions, prices are expected to remain firm. Rice prices are also expected to remain firm despite higher production due to rising production and marketing costs associated with the surge in oil prices.
Prices of oilseeds and oilseed-based products which had edged up from March 2005 in reaction to sudden deterioration of production prospects in South America eased in August-September 2005 with the waning of weather concerns in the main producing regions of North and South America and excess supplies continuing to dominate market conditions. On the other hand, notwithstanding some easing in August-September 2005, prices of edible oils and fats are expected to remain firm due to strong consumption demand, especially from China and India, demand for non-food uses like bio diesel from the EU and the US and below average stock levels.
Sugar prices after easing somewhat during April-June 2005 on the back of upward revision in estimates for global production during the 2004-05 season (October-September) edged up again during the second quarter. Free market sugar prices in the international market increased by 21.5 per cent between March 2005 and September 2005. Despite improved production prospects in India, shortfall in production in China is likely to keep prices at elevated levels in the coming months.
Global cotton prices declined further by about two per cent between March 2005 and September 2005 on top of a decline of 15.6 per cent during 2004-05 (April-March), reflecting a rebound in production. However, the lower prices have curtailed plantings and this, coupled with less favourable weather, is expected to result in a decline in world production during 2005-06. The International Cotton Advisory Committee (ICAC), therefore, expects prices to harden by about 19 per cent in 2005-06 in view of the tight balance between demand and supply conditions.
Metal prices firmed up further in the first half of 2005-06 on the back of robust construction and manufacturing demand from China and the US. Steel prices eased somewhat during July 2005 on the back of strong increase in Chinese production, higher inventories in the US and sluggish demand in Japan (Table 26). Prices, however, edged up again due to supply management efforts by steel producers in Europe in the form of production cuts and are likely to remain at elevated levels due to demand from China and higher raw material costs. With inventories falling to historical lows, copper prices continue to remain firm -prices increased by 14 per cent between March 2005 and September 2005 on top of an increase of about 47 per cent during 2004-05.
Table 26: World Commodity Prices
|
(Index 1995=100) |
|||||||
|
Commodity / Group |
2002-03 |
2003-04 |
2004-05 |
March 2005 |
June 2005 |
September 2005 |
|
|
1 |
2 |
3 |
4 |
5 |
6 |
7 |
|
|
All Commodities |
113.5 |
122.6 |
161.2 |
189.3 |
195.5 |
216.3 |
|
|
A. |
Fuel |
151.4 |
162.3 |
228.7 |
276.8 |
292.6 |
335.1 |
|
Crude Oil |
160.2 |
169.1 |
239.8 |
296.0 |
313.2 |
358.4 |
|
|
Average Crude Price |
|||||||
|
(US $/barrel) |
27.6 |
29.1 |
41.3 |
50.9 |
53.9 |
61.7 |
|
|
Coal (US $/tonne) |
26.2 |
32.3 |
56.8 |
52.7 |
52.8 |
47.0 |
|
|
B. |
Non-fuel Commodities |
78.8 |
86.1 |
99.4 |
109.1 |
106.5 |
107.4 |
|
Metals |
73.0 |
88.1 |
116.2 |
136.8 |
134.7 |
139.4 |
|
|
Steel Products # |
70.4 |
85.2 |
129.6 |
136.9 |
142.2 |
138.6 |
|
|
Agricultural Raw Materials |
80.6 |
82.1 |
85.7 |
87.8 |
86.8 |
86.8 |
|
|
Cotton (Cotlook ‘A Index’) |
50.3 |
67.3 |
56.8 |
56.2 |
54.0 |
54.9 |
|
|
Food Products |
83.8 |
89.6 |
97.8 |
101.7 |
98.6 |
98.4 |
|
|
Rice (US $/tonne) |
193.5 |
204.9 |
263.7 |
295.0 |
287.0 |
287.4 |
|
|
Wheat (US $/tonne) |
154.5 |
150.5 |
153.7 |
151.0 |
141.9 |
159.7 |
|
|
Sugar (Free Market) |
|||||||
|
(US cents per pound) |
6.7 |
6.5 |
8.3 |
8.9 |
9.0 |
10.8 |
|
|
Palm Oil (US $/tonne) |
384.5 |
430.9 |
399.7 |
374.8 |
369.6 |
370.0 |
|
|
Soybean Oil (US $/tonne) |
436.8 |
560.4 |
532.5 |
513.1 |
529.7 |
496.9 |
|
|
# World Bank’s composite price index for eight steel products (Base 1990=100). |
|||||||
Inflation Conditions in India
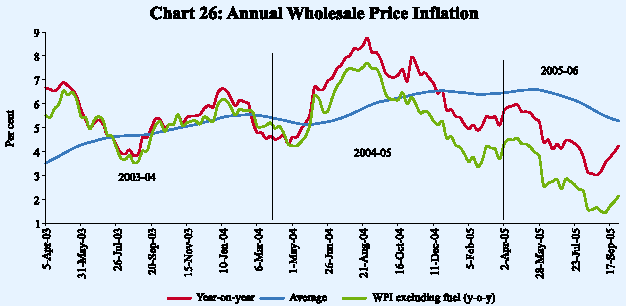
Headline inflation, measured by year-on-year (y-o-y) changes in the wholesale price index (WPI), moderated during the second quarter of 2005-06. WPI inflation eased to 4.2 per cent by October 1, 2005 – after touching an intra-year low of 3.0 per cent on August 30, 2005 - from 5.1 per cent at end-March 2005 (and 7.2 per cent a year ago). The average WPI inflation rate eased to 5.3 per cent on October 1, 2005 from 6.2 per cent a year ago and 6.5 per cent at the beginning of the year.
Despite hikes in petrol and diesel prices (7-8 per cent each in June and September 2005) and increase in electricity prices in June 2005, the moderation in headline inflation was due to monetary and fiscal measures; easing of primary articles prices following the recovery of the South-West monsoon; and base effects of higher prices in the previous year. Monetary measures - increases in cash reserve ratio (50 basis points during September-October 2004) and reverse repo rate (25 basis points each in October 2004 and April 2005) - sought to moderate inflationary expectations by demonstrable commitment to price stability.
Inflation outcome during 2005-06 so far has been dominated by the supply-side factors. The y-o-y WPI inflation excluding the fuel group was significantly lower at 2.1 per cent on October 1, 2005 and for the past year, it has remained around 1.5-2.0 percentage points below the headline inflation (Chart 26). However, when a significant part of what may be considered as permanent component of oil price increase is yet to be passed on, there is a need to consider two factors. First, the
advisability of treating the oil price increase as a shock rather than a permanent shift in relative prices may need to be questioned; and second, the inevitability of second order effects on inflation needs to be taken on board.
Prices of iron and steel, petroleum products and electricity - with a combined weight of around 16 per cent in the WPI basket - together contributed about 70 per cent of the headline inflation rate of 4.2 per cent on October 1, 2005. Minerals oil inflation alone contributed about one-half of the headline inflation (Table 27).
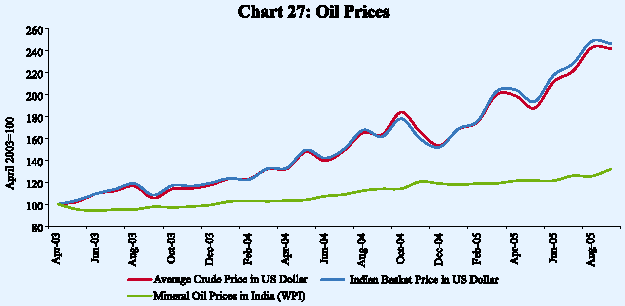
Domestic prices of petrol and diesel, which were revised upwards by about 7-8 per cent effective June 21, 2005 after a gap of almost seven months, were raised by almost a similar magnitude effective September 7, 2005. Even after this increase, domestic PoL prices have been lagging the increase in international oil prices (Chart 27). International crude oil prices (the Indian basket) increased by about 86 per cent between March 2004 and September 2005 from US $ 31.9 a barrel to US $ 59.3 a barrel. Over the same period, domestic mineral oil prices increased by about 30.0 per cent - petrol by 28.1 per cent and diesel by 38.2 per cent, with the burden being shared by the oil companies and the Central Government.
Cross-country analysis of pass-through shows that, between March 2004 and September 2005, domestic retail prices (including tax) (in US dollar terms) of petrol have increased ranging from 20.7 per cent (Italy) to 64.3 per cent (USA). The increase in diesel prices ranged between 25.2 per cent (UK) and 70.5 per cent (USA). In comparison, India’s domestic retail prices of petrol and diesel (average of four metros) increased by 26.4 per cent and 36.3 per cent, respectively. As a measure of the pass-through of international oil prices to domestic prices, the comparison of the change in domestic retail prices (inclusive of the tax component) is complicated by the tax component which varies from country to country - it is as high as 60-65 per cent of retail price of gasoline in European
Table 27: Wholesale Price Inflation in India (year-on-year)
|
(Per cent) |
|||||||||
|
2004-05 |
2004-05 |
2005-06 P |
|||||||
|
(October 2) |
(October 1) |
||||||||
|
Commodity |
Weight |
Inflation |
WCs |
Inflation |
WCs |
Inflation |
WCs |
||
|
1 |
2 |
3 |
4 |
5 |
6 |
7 |
8 |
||
|
All Commodities |
100.0 |
5.1 |
100.0 |
7.1 |
100.0 |
4.2 |
100.0 |
||
|
1. |
Primary Articles |
22.0 |
1.3 |
5.5 |
4.3 |
13.6 |
1.8 |
9.4 |
|
|
Food Articles |
15.4 |
3.0 |
8.9 |
1.8 |
4.0 |
4.1 |
14.8 |
||
|
i. |
Rice |
2.4 |
2.9 |
1.3 |
-1.4 |
- 0.5 |
4.1 |
2.1 |
|
|
ii. |
Wheat |
1.4 |
-1.1 |
-0.3 |
3.9 |
0.8 |
1.6 |
0.5 |
|
|
iii. |
Pulses |
0.6 |
-2.6 |
-0.3 |
1.8 |
0.2 |
5.1 |
0.7 |
|
|
iv. |
Vegetables |
1.5 |
11.9 |
2.3 |
1.4 |
0.3 |
3.5 |
1.3 |
|
|
v. |
Fruits |
1.5 |
11.5 |
4.1 |
-0.8 |
-0.2 |
5.5 |
2.3 |
|
|
vi. |
Milk |
4.4 |
-1.7 |
-1.5 |
4.0 |
2.5 |
0.4 |
0.4 |
|
|
vii. |
Eggs, Fish and Meat |
2.2 |
7.3 |
3.1 |
0.9 |
0.3 |
14.7 |
7.6 |
|
|
Non-Food Articles |
6.1 |
-6.9 |
-8.8 |
4.1 |
3.7 |
-4.3 |
-6.2 |
||
|
i. |
Raw Cotton |
1.4 |
-23.8 |
-6.5 |
-5.4 |
-1.0 |
-15.5 |
-4.5 |
|
|
ii. |
Oil Seeds |
2.7 |
-6.5 |
-3.4 |
8.8 |
3.2 |
-6.2 |
-3.8 |
|
|
iii. |
Sugarcane |
1.3 |
-0.7 |
-0.2 |
5.1 |
1.1 |
0.6 |
0.2 |
|
|
Minerals |
0.5 |
68.0 |
5.3 |
131.5 |
5.9 |
4.4 |
0.7 |
||
|
i. |
Iron Ore |
0.2 |
119.1 |
5.2 |
290.6 |
6.1 |
4.1 |
0.5 |
|
|
2. |
Fuel, Power, Light and Lubricants |
14.2 |
10.5 |
42.7 |
10.8 |
30.8 |
12.0 |
60.1 |
|
|
i. |
Mineral Oils |
7.0 |
16.0 |
34.9 |
16.9 |
25.4 |
17.7 |
49.1 |
|
|
ii. |
Electricity |
5.5 |
0.8 |
1.2 |
0.8 |
0.9 |
6.2 |
10.7 |
|
|
iii. |
Coal Mining |
1.8 |
17.1 |
6.4 |
16.3 |
4.5 |
0.7 |
0.4 |
|
|
3. |
Manufactured Products |
63.7 |
4.6 |
52.0 |
7.0 |
55.1 |
2.3 |
30.3 |
|
|
i. |
Food Products |
11.5 |
0.4 |
0.9 |
5.2 |
8.0 |
0.1 |
0.1 |
|
|
Of which: Sugar |
3.6 |
19.7 |
10.3 |
15.6 |
5.7 |
10.0 |
6.6 |
||
|
Edible Oils |
2.8 |
-8.4 |
-4.0 |
2.3 |
0.8 |
-7.8 |
-4.3 |
||
|
Oil Cakes |
1.4 |
-17.4 |
-6.4 |
-4.6 |
-1.2 |
-12.9 |
-5.1 |
||
|
ii. |
Cotton Textiles |
4.2 |
-12.7 |
-10.4 |
6.8 |
3.7 |
-13.4 |
-12.2 |
|
|
iii. |
Man Made Fibre |
4.4 |
0.6 |
0.3 |
6.0 |
1.9 |
-6.9 |
-3.7 |
|
|
iv. |
Chemicals and Chemical Products |
11.9 |
3.9 |
9.1 |
3.2 |
5.3 |
3.0 |
8.2 |
|
|
Of which : Fertilisers |
3.7 |
3.3 |
2.2 |
0.4 |
0.2 |
3.1 |
2.4 |
||
|
v. |
Basic Metals, Alloys and |
8.3 |
17.1 |
28.4 |
19.9 |
22.5 |
8.5 |
18.1 |
|
|
Metal Products |
|||||||||
|
Of which: Iron and Steel |
3.6 |
21.3 |
17.0 |
26.5 |
14.3 |
9.1 |
9.8 |
||
|
vi. |
Non-Metallic Mineral Products |
2.5 |
11.4 |
4.7 |
7.9 |
2.3 |
7.7 |
3.8 |
|
|
Of which: Cement |
1.7 |
10.2 |
2.9 |
6.0 |
1.2 |
9.3 |
3.1 |
||
|
vii. |
Machinery and Machine Tools |
8.4 |
7.1 |
8.6 |
6.3 |
5.6 |
4.1 |
6.1 |
|
|
viii.Transport Equipment and Parts |
4.3 |
6.2 |
4.3 |
6.4 |
3.2 |
2.6 |
2.2 |
||
|
Food Items (Composite) |
26.9 |
1.9 |
9.8 |
3.1 |
12.0 |
2.4 |
15.0 |
||
|
WPI Excluding Food |
73.1 |
6.3 |
90.2 |
8.7 |
88.0 |
4.9 |
85.0 |
||
|
WPI Excluding Fuel |
85.8 |
3.7 |
57.3 |
6.2 |
69.2 |
2.1 |
39.9 |
||
|
P : Provisional. WCs : Weighted Contributions. |
|||||||||
countries such as France, Germany and the UK. On the other hand, the share of taxes at 14 per cent is fairly low for the US. Excluding the tax component, data for select countries show that the pass-through to domestic gasoline and diesel prices is substantially higher at around 80-90 per cent (Table 28).
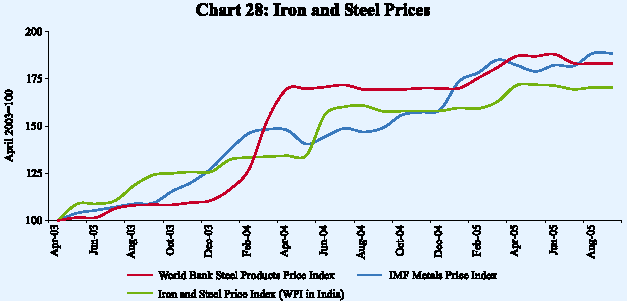
Domestic iron and steel prices increased during the first quarter of 2005-06 following the hikes in steel prices announced by various companies in April 2005. In line with easing trend in international metals prices during May-June 2005 and rising inventories, domestic companies announced cuts/rebates of about 10-12 per cent in prices of select products during June-July 2005. As international prices recovered on the back of production cuts by major steel producers, domestic
Table 28: Change in Average End-use Petroleum Products Prices:September 2005 over March 2004
|
(Per cent) |
|||||||||
|
Gasoline Prices |
Automotive Diesel |
||||||||
|
In National |
In US Dollar |
In National |
In US Dollar |
||||||
|
Currency |
Currency |
||||||||
|
Sr. |
Country |
Including |
Excluding |
Including |
Excluding |
Including |
Excluding |
Including |
Excluding |
|
No. |
Tax |
Tax |
Tax |
Tax |
Tax |
Tax |
Tax |
Tax |
|
|
1 |
2 |
3 |
4 |
5 |
6 |
7 |
8 |
9 |
10 |
|
1. |
France |
24.5 |
77.8 |
25.0 |
78.5 |
32.9 |
82.8 |
33.4 |
83.6 |
|
2. |
Germany |
23.9 |
78.7 |
24.4 |
79.7 |
29.7 |
79.2 |
30.2 |
79.8 |
|
3. |
Italy |
20.2 |
51.6 |
20.7 |
52.4 |
33.2 |
70.1 |
33.8 |
70.8 |
|
4. |
Spain |
29.1 |
65.6 |
29.6 |
66.1 |
38.8 |
76.1 |
39.3 |
76.8 |
|
5. |
UK |
24.4 |
77.7 |
23.9 |
77.1 |
25.8 |
79.2 |
25.2 |
78.3 |
|
6. |
Japan |
31.0 |
67.1 |
28.6 |
63.8 |
30.8 |
51.1 |
28.4 |
48.3 |
|
7. |
Canada |
45.3 |
70.3 |
63.6 |
91.6 |
41.0 |
56.0 |
58.6 |
75.8 |
|
8. |
USA |
64.3 |
82.8 |
64.3 |
82.8 |
70.5 |
97.4 |
70.5 |
97.4 |
|
9. |
Thailand |
63.3 |
85.0 |
56.7 |
77.5 |
65.8 |
90.7 |
59.1 |
83.1 |
|
10. |
China * |
14.6 |
14.1 |
15.1 |
15.4 |
||||
|
11. |
Korea @ |
3.8 |
17.9 |
21.8 |
38.7 |
||||
|
12. |
India |
28.1 |
26.4 |
38.2 |
36.3 |
||||
|
* : Between March 2004 and February 2005 |
|||||||||
companies raised prices again in August 2005. On the whole, iron and steel prices have increased by 5.5 per cent during the current financial year up to October 1, 2005 (Chart 28). All major metal producers in India also raised copper and zinc prices during the second quarter in line with international trends.
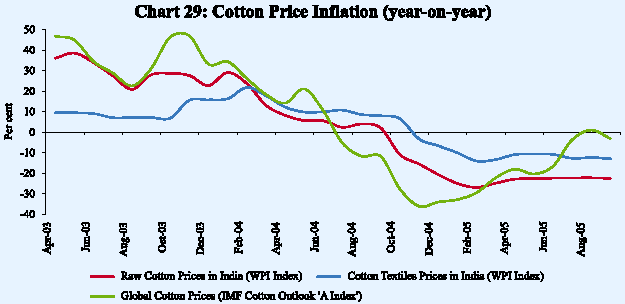
With the revival of the South-West monsoon, sowing picked-up sharply during July-August 2005 and kharif foodgrain production is expected to be higher than last year. This is likely to have a soothing effect on food prices in the second half of the current year. Higher sugarcane output is expected to contain sugar prices, which have so far remained high in line with international trends. Raw cotton prices - which increased marginally up to July 2005 reflecting worries about the monsoon - eased with the revival of the monsoon, in line with international trends (Chart 29).
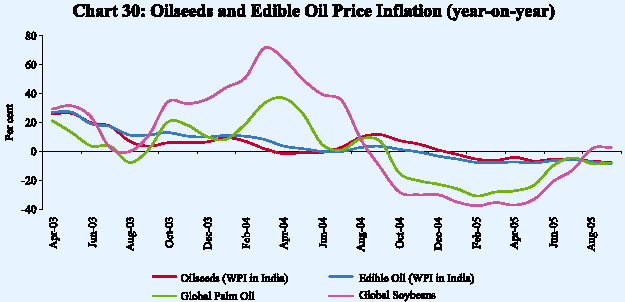
Oilseed prices have hardened, albeit marginally, during the current financial year so far reflecting last year’s shortfall in domestic production as well as expectations that production will be lower in the current season too. However, year-on-year, oilseeds inflation remains negative. Edible oil prices also declined in line with international trends (Chart 30).
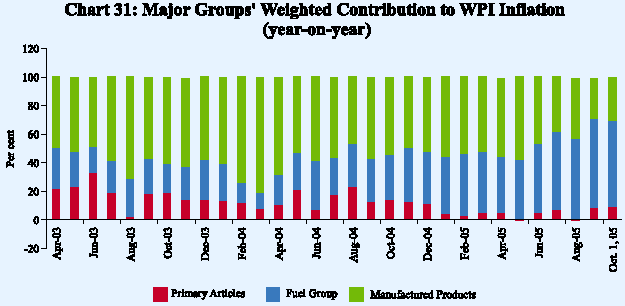
In brief, domestic WPI inflation during 2005-06 so far has been dominated by mineral oil prices. As much as 60.1 per cent of the y-o-y WPI inflation as on October 1, 2005 is due to the fuel group followed by manufactured products (30.3 per cent) (Chart 31). Primary articles’ contribution to the overall inflation has been lower so far despite the erratic monsoon.
Consumer Price Inflation
Consumer price inflation (measured by the CPI for Industrial Workers) during August 2005 was marginally lower than that during March 2005. Other measures of consumer price inflation, however, edged up reflecting higher food prices on account of the delayed onset and progress of the South-West monsoon (Table 29).
Table 29: Consumer Price Inflation (CPI) in India (year-on-year)
|
(Per cent) |
|||||||||
|
Inflation Measure |
March |
March |
August |
March |
June |
July |
August |
||
|
2003 |
2004 |
2004 |
2005 |
2005 |
2005 |
2005 |
|||
|
1 |
2 |
3 |
4 |
5 |
6 |
7 |
8 |
||
|
CPI-IW |
4.1 |
3.5 |
4.6 |
4.2 |
3.3 |
4.1 |
3.4 |
||
|
CPI- UNME |
3.8 |
3.4 |
4.0 |
4.0 |
3.9 |
4.8 |
4.3 |
||
|
CPI-AL |
4.9 |
2.5 |
3.0 |
2.4 |
2.7 |
3.6 |
3.2 |
||
|
CPI-RL |
4.8 |
2.5 |
3.0 |
2.4 |
2.7 |
3.8 |
3.2 |
||
|
Memo : |
|||||||||
|
WPI Inflation |
6.5 |
4.6 |
8.7 |
5.1 |
4.3 |
4.2 |
3.0 |
||
|
IW :Industrial Workers UNME:Urban Non-Manual Employees |
|||||||||
Disaggregated information on CPI (Industrial Workers) available up to July 2005 shows firming up of food prices due to the erratic monsoon. On the other hand, increase in the housing index - which includes rent paid for rented, self-owned and rent free houses - in the CPI-IW basket decelerated from its March 2005 level (Table 30). Services inflation - proxied by the miscellaneous group in
Table 30: Consumer Price Inflation for Industrial Workers (year-on-year)
|
(Per cent) |
|||||||||
|
March 2005 |
July 2004 |
July 2005 |
|||||||
|
Commodity |
Weight |
Inflation |
WCs |
Inflation |
WCs |
Inflation |
WCs |
||
|
1 |
2 |
3 |
4 |
5 |
6 |
7 |
8 |
||
|
CPI General Index |
100.0 |
4.2 |
100.0 |
3.2 |
100.0 |
4.1 |
100.0 |
||
|
1. |
Food Group |
57.0 |
1.6 |
21.7 |
1.2 |
21.4 |
4.0 |
54.3 |
|
|
i. |
Cereals and Products |
20.5 |
0.7 |
2.9 |
-1.1 |
-6.4 |
2.0 |
8.8 |
|
|
ii. |
Pulses and Products |
3.6 |
-2.0 |
-1.9 |
1.1 |
1.3 |
6.7 |
6.3 |
|
|
iii. |
Oils and Fats |
5.0 |
-7.1 |
-6.9 |
-5.6 |
-7.2 |
-3.1 |
-2.9 |
|
|
iv. |
Meat, Fish and Eggs |
4.3 |
5.0 |
6.3 |
5.9 |
9.4 |
5.8 |
7.6 |
|
|
v. |
Milk and Products |
6.5 |
1.7 |
2.5 |
4.3 |
7.7 |
1.3 |
1.8 |
|
|
vi. |
Condiments and Spices |
3.2 |
-9.0 |
-7.6 |
-3.6 |
-4.0 |
1.3 |
1.1 |
|
|
vii. |
Vegetables and Fruits |
5.7 |
6.5 |
8.2 |
1.8 |
3.6 |
11.9 |
18.2 |
|
|
viii.Other Foods |
8.3 |
7.8 |
17.7 |
5.9 |
17.1 |
6.1 |
14.2 |
||
|
2. |
Pan, Supari, Tobacco and Intoxicants |
3.2 |
2.1 |
2.1 |
2.8 |
3.5 |
2.2 |
2.3 |
|
|
3. |
Fuel and Light |
6.3 |
4.9 |
8.7 |
8.4 |
18.4 |
-6.5 |
-11.7 |
|
|
4. |
Housing |
8.7 |
20.4 |
50.0 |
11.7 |
36.8 |
11.7 |
31.4 |
|
|
5. |
Clothing, Bedding and Footwear |
8.5 |
2.3 |
3.3 |
2.1 |
3.7 |
2.3 |
3.3 |
|
|
6. |
Miscellaneous Group (Services) |
16.4 |
3.9 |
15.6 |
3.2 |
16.4 |
4.4 |
17.9 |
|
|
i. |
Medical Care |
2.6 |
4.4 |
3.2 |
5.8 |
5.3 |
2.7 |
2.0 |
|
|
ii. |
Education, Recreation and Amusement |
3.1 |
5.1 |
3.4 |
4.1 |
3.5 |
6.6 |
4.5 |
|
|
iii. |
Transport and Communication |
2.7 |
6.8 |
5.0 |
2.4 |
2.3 |
8.5 |
6.4 |
|
|
iv. |
Personal Care and Effects |
3.3 |
3.2 |
2.5 |
3.5 |
3.5 |
3.0 |
2.4 |
|
|
v. |
Others |
4.7 |
1.7 |
1.8 |
1.3 |
1.8 |
2.5 |
2.7 |
|
|
WCs : Weighted Contributions. |
|||||||||
the CPI-IW - edged up marginally, reflecting increase in the prices of education and recreation, and transport and communication.
Asset Prices and Inflation
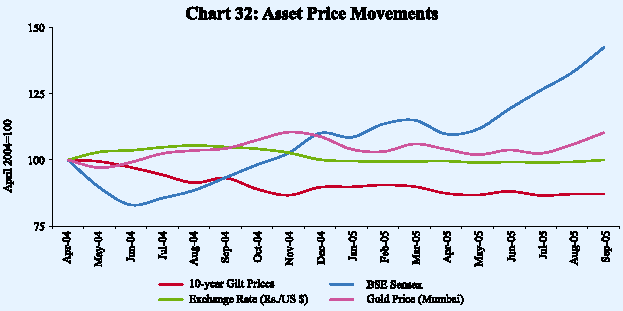
Equity markets reached successive record highs reflecting improved corporate performance, continued liquidity support by FIIs and recovery in monsoon (Chart 32). Corporate profitability remains strong and profits after tax increased by 54.2 per cent during April-June 2005. Gold prices remained firm in line with international trends on the back of sustained demand. Gilt prices have been largely range bound since May 2005 with intra-year movements influenced by trends in domestic inflation and liquidity conditions. The exchange rate of the rupee vis-a-vis the US dollar has generally remained stable during 2005-06 so far. During early October 2005, large current account deficit, slowdown in FII inflows and the strengthening of the US dollar vis-a-vis major currencies led to some downward pressure on the exchange rate.
पेज अंतिम अपडेट तारीख:


