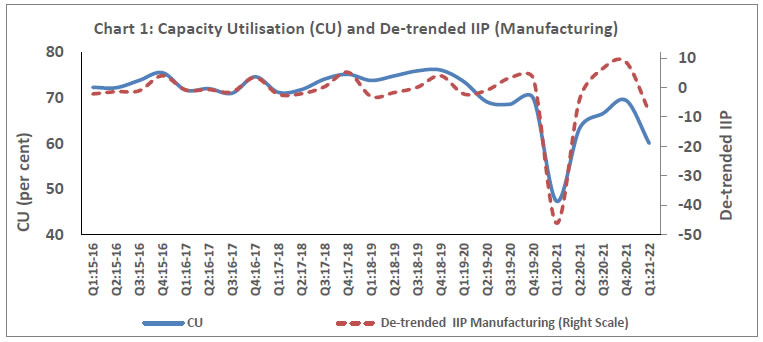
OBICUS Survey on the Manufacturing sector for Q1:2021-22
Today, the Reserve Bank released the results of the 54th round of the quarterly Order Books, Inventories and Capacity Utilisation Survey (OBICUS), which provides a snapshot of demand conditions in India’s manufacturing sector1 during April-June 2021. The survey covered 671 manufacturing companies.
Highlights:
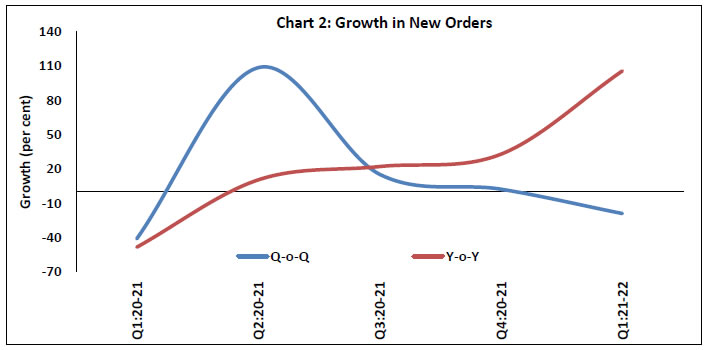
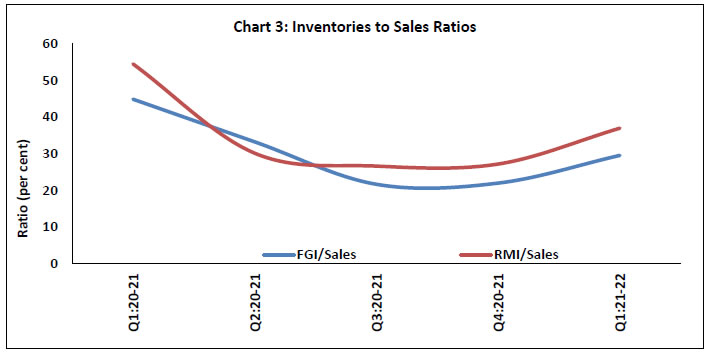
Due to the second wave of COVID-19 pandemic, several restrictions were imposed in many regions of the country, which adversely affected capacity utilisation (CU) in the Indian manufacturing sector; the impact was, however, less severe than that witnessed during Q1:2020-21 in the wake of lockdowns and other restrictions during the first wave (Chart 1).
At the aggregate level, CU for the manufacturing sector declined to 60.0 per cent in Q1:2021-22 from 69.4 per cent recorded in the previous quarter; it stood at 47.3 per cent a year ago.
The low base effect helped in surge in the annual growth (Y-o-Y) in new orders2 during Q1:2021-22; on a sequential basis (Q-o-Q), however, new orders fell in the aftermath of the second wave of the pandemic (Chart 2).
Finished goods inventory (FGI) to sales ratio3 increased during Q1:2021-22 due to fall in sales and rise in FGI. Raw material inventory (RMI) to sales ratio also increased as the decline in sales was at a faster pace than the drop in RMI (Chart 3).
Table 1: IIP*-Manufacturing and Capacity Utilisation (CU)
Quarter
Number of responding companies
Capacity Utilisation
IIP-Manufacturing (Quarterly Average)
De-trended Quarterly IIP-Manufacturing
Q1:2020-21
406
47.3
77.9
-46.1
Q2:2020-21
563
63.3
121.2
-3.9
Q3:2020-21
610
66.6
133.2
6.5
Q4:2020-21
557
69.4
136.5
8.7
Q1:2021-22
640
60.0
119.4
-8.1
*: Index of Industrial Production (Base: 2011-12)
Table 2: Order Books (Q1:2020-21 to Q1:2021-22)
Quarter
Number of companies
Amount (₹ Crores)
Q-o-Q Growth # (per cent) **
Y-o-Y Growth # (per cent)
Average Backlog Orders
Average New Order Book
Average Pending Orders
Backlog Orders
New Order Book
Pending Orders
Backlog Orders
New Order Book
Pending Orders
Q1:2020-21
100
103.7
71.0
109.3
-0.8
-41.1
5.4
1.3
-48.5
5.0
Q2:2020-21
137
146.3
184.8
154.1
0.5
108.6
5.2
6.0
10.4
8.6
Q3:2020-21
155
181.2
242.7
194.2
0.3
15.4
7.2
-13.8
22.1
-7.7
Q4:2020-21
85
199.8
243.4
196.3
7.6
2.3
-1.8
7.2
32.9
2.3
Q1:2021-22
120
188.1
171.0
197.8
-0.5
-19.0
5.3
11.8
105.7
17.3
#: Growth rates are calculated using three rounds common set of companies, namely, companies responded in the current quarter, one quarter ago and a same quarter a year ago. **: Not seasonally adjusted.
Table 3: Average Sales and Inventories (Q1:2020-21 to Q1:2021-22)
Quarter
Number of Companies
Amount (₹ Crores)
Ratio (per cent) #
Average Sales
Average Total Inv
Average FG Inv
Average WiP Inv
Average RM Inv
Total Inv /Sales
FG Inv /Sales
RM Inv /Sales
Q1:2020-21
352
553.0
439.9
169.8
74.3
195.9
113.8
44.8
54.5
Q2:2020-21
416
686.0
409.5
159.6
69.7
180.3
76.4
33.2
30.1
Q3:2020-21
471
719.6
372.3
143.5
60.0
168.8
56.8
21.7
26.6
Q4:2020-21
418
959.2
461.2
183.3
66.2
211.6
57.5
22.0
27.2
Q1:2021-22
478
869.2
489.7
208.8
79.7
201.2
78.6
29.5
36.9
#: Weighted average of industry level ratios using GVA as weights RM - Raw Material; WiP - Work in progress; FG - Finished Goods; Inv – Inventory. Note: The computations of order book growths and inventory to sales ratios are based on methodology given at footnote no. 2 and 3 and not on the basis of averages given in the table.
1 The survey responses are voluntary. Results of the previous survey round were released on the Bank’s website on August 06, 2021.
2 From this round of the survey, sequential (Q-o-Q) and annual (Y-o-Y) growth in order books are estimated by using the data reported by those companies which are common in OBICUS response in the latest quarter, one quarter ago and the corresponding quarter a year ago (i.e., three survey rounds). Up to the last round, such calculations were based on the companies which reported for the latest nine OBICUS rounds, which led to exclusion of the companies that missed reporting even in one of the latest nine rounds. Estimates of order book growth are revised since the 50th survey round (i.e., Q1:2020-21).
3 From this survey round, the methodology of computation of ‘inventory to sales’ ratio is revised by compiling it in two stages: (i) at the first stage, the industry-level ratios are calculated from OBICUS responses; and (ii) the final ratio is derived in the second stage as a weighted average of the industry-level ratios, using the Gross Value Added (GVA) weights from the Annual Survey of Industries (ASI) of the National Statistical Office (NSO). The ratios are now based on the full set of OBICUS responses for each survey round. Up to the last round, the ratios were estimated at aggregated-level by considering only those companies which responded in the latest five OBICUS rounds, which led to exclusion of the companies that missed reporting even in one of the latest five rounds. Estimates of these ratios have been revised since the 50th survey round (i.e., Q1:2020-21).
RbiTtsCommonUtility
PLAYING
LISTEN
LOADING...
0:062:49
Related Assets
RBI-Install-RBI-Content-Global
RbiSocialMediaUtility
Share this page:
Install the RBI mobile application and get quick access to the latest news!
RbiWasItHelpfulUtility
Was this page helpful?Thanks!
Would like to give more details?
Thank you for your feedback!Thank you for your feedback!