new private sector banks), with the increase being more pronounced
in respect of public sector banks. The maturity pattern of loans and advances
and investments of all bank groups remained broadly the same during 2007-08 as
in the previous year. The share of loans and advances with up to one year maturity
increased marginally in the case of all bank groups, barring foreign banks. Similar
trend was observed in investments across all bank groups. On the whole, assets
depicted a synchronous pattern with the liabilities. At end-March 2008, in general,
public sector banks and old private sector banks had higher proportion of both
liabilities and assets under longer maturity bucket. Furthermore, within the asset
portfolio, while the maturity profile of loans and advances was nearly similar
for all bank groups, barring foreign banks, investment pattern of new private
sector banks and foreign banks was more tilted towards shorter term maturity profile.
3. Off-Balance Sheet Operations
3.55 In line with the trend observed in recent years, SCBs continued to expand
their off-balance sheet (OBS) exposures. During 2007-08, off-balance sheet exposures
increased sharply by 88.4 per cent on the top of an increase of 80.2 per cent
during 2006-07. As a result, the total off-balance sheet exposure of SCBs at end-March
2008 was more than three times the size of their consolidated balance sheet as
compared with more than two times at end-March 2007 (Chart III.10).
Leveraged positions in derivatives as a means of diversifying income, improvements
in technology (trading and information services) and increasing use of derivatives
as tools for risk mitigation appear to have contributed to the growth in OBS exposures. 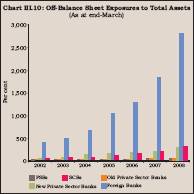
3.56 Among the bank groups, the off-balance sheet exposure of foreign banks
was at 2,830.5 per cent of their total assets, followed by new private sector
banks (301.8 per cent), public sector banks (61.5 per cent) and old private sector
banks (57.1 per cent) (Appendix Table III.14).
3.57 Of the total off-balance
sheet exposures of SCBs, foreign banks constituted the largest share (70.8 per
cent), followed by new private sector banks (15.6 per cent) and public sector
banks (12.9 per cent) (Chart III.11)
4.
Financial Performance of Scheduled Commercial Banks
3.58 Financial performance of SCBs during 2007-08 was shaped by the movements
in deposits interest rates across all maturities and lending interest rates along
with growth in the volume of their activities. Reflecting hardening of interest
rates, interest income increased sharply. Although deposit interest rates softened
between end-March 2007 and end-March 2008, deposits contracted at higher interest
rates at different points of time led to increase in interest expenditure. On
the whole, net interest income declined in relation to assets. Non-interest income,
however, grew significantly. Operating expenses of banks were contained. As a
result, profits of banks increased considerably during the year. Overall, return
on assets improved during the year, though return on equity declined marginally
as banks enlarged their capital base partly by raising resources from the capital
market and partly by ploughing back of profits. 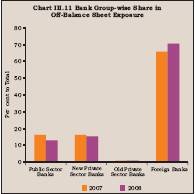
Table
III.20: Movements in Deposit and Lending Interest Rates |
(Per
cent) | Interest
Rates | March | March | March | June | October |
| 2006 | 2007 | 2008 | 2008 | 2008 |
1 | 2 | 3 | 4 | 5 | 6 |
Deposit Rates | | | | | |
Public Sector Banks | | | | | |
a) | Up
to 1 year | 2.25-6.50 | 2.75-8.75 | 2.75-8.50 | 2.75-9.00 | 2.75-10.25 |
b) | 1
year up to 3 years | 5.75-6.75 | 7.25-9.50 | 8.25-9.25 | 8.25-9.50 | 8.75-10.60 |
c) | Over
3 years | 6.00-7.25 | 7.50-9.50 | 8.00-9.00 | 8.00-9.35 | 8.50-9.75 |
Private Sector Banks | | | | | |
a) | Up
to 1 year | 3.50-7.25 | 3.00-9.00 | 2.50-9.25 | 3.00-8.75 | 3.00-10.50 |
b) | 1
year up to 3 years | 5.50-7.75 | 6.75-9.75 | 7.25-9.25 | 8.00-9.50 | 9.00-11.00 |
c) | Over
3 years | 6.00-7.75 | 7.75-9.60 | 7.25-9.75 | 8.00-10.00 | 8.25-11.00 |
Foreign Banks | | | | | |
a) | Up
to 1 year | 3.00-5.75 | 3.00-9.50 | 2.25-9.25 | 3.00-9.25 | 3.50-12.15 |
b) | 1
year up to 3 years | 4.00-6.50 | 3.50-9.50 | 3.50-9.75 | 3.50-9.75 | 3.50-10.50 |
c) | Over
3 years | 5.50-6.50 | 4.05-9.50 | 3.60-9.50 | 3.60-9.50 | 3.60-11.00 |
BPLR | | | | | | |
Public Sector Banks | 10.25-11.25 | 12.25-12.75 | 12.25-13.50 | 12.50-14.00 | 13.75-14.70 |
Private Sector Banks | 11.00-14.00 | 12.00-16.50 | 13.00-16.50 | 13.00-17.00 | 13.75-17.75 |
Foreign Banks | 10.00-14.50 | 10.00-15.50 | 10.00-15.50 | 10.00-15.50 | 10.00-17.00 |
Actual Lending Rates* | | | | | |
Public Sector Banks | 4.00-16.50 | 4.00-17.00 | 4.00-17.75 | 4.00-18.00 | - |
Private Sector Banks | 3.15-20.50 | 3.15-25.50 | 4.00-24.00 | 4.00-25.00 | - |
Foreign Banks | 4.75-26.00 | 5.00-26.50 | 5.00-28.00 | 5.00-25.50 | - |
- : Not Available | | | | | |
* : Interest rate on non-export
demand and term loans above Rs.2 lakh excluding lending rates at the extreme five
per cent on both sides. | Interest Rate Scenario
3.59 Lending rates of SCBs across various bank groups
showed a generally upward movement during the year (Table III.20).
Deposit rates across bank groups showed a general decline during 2007-08, though
foreign and private sector banks marginally increased their rates in some of the
maturitybuckets. Public sector banks reduced the maximum rate on term deposits
of all maturities (25 to 50 basis points), while they increased the minimum rates
for deposits of 1 to 3 years (100 basis points). Private sector banks increased
the maximum rates for deposits up to one year (by 25 basis points) and over three
years (by 15 basis points), while they reduced their interest rate on for deposits
of one to three maturity (by 50 basis points). The minimum rates for deposits
up to one year and over three years were reduced (by 50 basis points each) by
private sector banks, while they were increased for deposits of one to three years
(by 50 basis points). Foreign banks, on the other hand, reduced their minimum
rates for deposits up to 1 year (by 75 basis points) and over 3 years (by 45 basis
points). Interest rates offered by public sector banks on deposits of maturity
of one year to three years were placed in the range of 8.25-9.25 per cent in March
2008 as compared with the range of 7.25-9.50 per cent a year ago, while those
on deposits of maturity of above three years were placed in the range of 8.00-9.00
per cent in March 2008 as compared with the range of 7.50-9.50 per cent a year
ago. Similarly, interest rates offered by private sector banks on deposits of
maturity of one year to three years were placed in the range of 7.25-9.25 per
cent in March 2008 as compared with 6.75-9.75 per cent in March 2007, while those
on deposits of maturity above three years were placed in the range of 7.25-9.75
per cent in March 2008 as compared with 7.75-9.60 per cent in March 2007. Interest
rates offered by foreign banks on deposits of maturity of one year to three years
were placed in the range of 3.50-9.75 per cent in March 2008 as compared with
3.50-9.50 per cent in March 2007. 3.60 During the first half of 2008-09,
both the lending and deposits rates, in general, hardened. Interest rates of PSBs
on deposits of maturity of one to three years were placed in the range of 8.25-9.50
per cent in June 2008 as compared with 8.25-9.25 per cent in March 2008 and further
moved up to the range of 8.75-10.60 per cent in October 2008. The deposit rates
of private sector banks on deposits of maturity of one to three years and above
three years firmed up further to 9.00-11.00 per cent and 8.25-11.00 per cent,
respectively, in October 2008 as compared with 7.25-9.25 per cent and 7.25-9.75
per cent, respectively, in March 2008.
3.61 The range of benchmark
prime lending rates (BPLRs) of PSBs and private sector banks hardened somewhat
during 2007-08. Overall, there was an increase of around 75 basis points in the
BPLR of public sectors during 2007-08 as compared with that in the previous year
(Chart III.12). The BPLR of PSBs and private sector banks
were placed in the range of 12.25-13.50 per cent and 13.00-16.50 per cent, respectively,
in March 2008 as compared with 12.25-12.75 per cent and 12.00-16.50 per cent,
respectively, in March 2007.The range of BPLRs of foreign banks, however, remained
unchanged at 10.00-15.50 per cent during this period. The range of actual lending
rates on demand and term loans (other than export credit) for the SCBs widened
to the range of 4.00-28.00 per cent in March 2008 from the range of 3.15-26.50
per cent in March 2007 (Table III.20). 
3.62 The share of sub-BPLR lending in total lending of commercial banks, excluding
export credit and small loans, declined from 78 per cent at end-March 2007 to
about 76 per cent at end-March 2008. The band of BPLRs of private sector banks
and foreign banks was much wider than that of public sector banks. BPLRs of more
than half of private sector banks were in the range of 13.00-15.00 per cent at
end-March 2008, while those of other private sector banks in the range of 15.25-16.50
per cent. As regards foreign banks, BPLRs of twelve banks were in the range of
10.00-13.00 per cent. BPLRs of nine other foreign banks were in the range of 13.25-14.00
per cent and another seven in the range of 14.25-15.50 per cent.
3.63 Yields
in the Government securities market during 2007-08 hardened somewhat in the first
quarter, partly in response to global trends, CRR hikes, increase in market stabilisation
scheme (MSS) ceiling and issuance under the MSS. Yields softened after July 2007
on account of easy liquidity conditions, lower inflation, global trends in yields
and expectations of a rate cut by RBI in the beginning of 2008. Yields, however,
moved up after March 2008 on account of higher inflation(Table
III.21). The money market remained largely orderly during 2007-08, barring
occasional spells of volatility on account of large changes in capital flows and
cash balances of the Central Government with the Reserve Bank. Call rates, which
ruled easy from April 2008, edged up somewhat during May 2008, reflecting a decline
in the surplus liquidity in the banking system due to the cumulative impact of
a three-stage hike in the cash reserve ratio (CRR). CDs continued to be a preferred
alternative for mobilising resources by some banks during 2007-08 and thereafter
due to the flexibility of their timing and returns (Details given in Chapter 7).
Table
III.21: Structure of Interest Rates* |
(Per
cent) | Instrument | March
2006 | March
2007 | March
2008 | October
2008 | 1 | 2 | 3 | 4 | 5 |
I. | Debt
market | | | | |
| 1. | Government
Securities Market | | | | |
| | 5
-Year | 7.24 | 7.97 | 7.70 | 7.42 |
| | 10
-Year | 7.53 | 7.97 | 7.93 | 7.45 |
II. | Money
Markets | | | | |
| 2. | Call
Borrowing (Average) | 6.57 | 14.07 | 7.37 | 9.90 |
| 3. | Commercial
papers | | | | |
| | WADR
61 - 90 days | 8.72 | 11.65 | 10.79 | 16.27 |
| | WADR
91-180 days | 8.54 | 11.81 | 10.01 | 12.57 |
| | Range | 6.69-9.25 | 10.25-13.00 | 9.50-14.25 | 11.55-16.90 |
| 4. | Certificates
of deposit | | | | |
| | Range | 6.50-8.94 | 10.23-11.90 | 9.00-10.75 | 8.92-21.00 |
| | WADR
Overall | 8.62 | 10.75 | 10.00 | 12.57 |
| | 3
Months | 8.72 | 11.35 | 10.73 | 10.45 |
| | 12
Months | 8.65 | 10.59 | 9.97 | 10.26 |
| 5. | Treasury
Bills | | | | |
| | 91
days | 6.11 | 7.98 | 7.36 | 9.06 |
| | 364
days | 6.42 | 7.98 | 7.35 | 9.18 |
* : As at end-month.
WADR
- Weighted Average Discount Rate. |
Cost
of Deposits and Return on Advances
3.64 Though the deposit
rates showed a marginal decline between end-March 2007 and end-March 2008, the
cost of deposits of SCBs increased by one percentage point as compared with that
during the previous year. This essentially reflected the average cost of contracting
deposits of different types and different maturities at different points in time.
Thus, the rise in cost of deposits during 2007-08 partly reflected the increase
in deposit rate during the previous year. Though the cost of deposits increased
across all bank groups, the increase was more pronounced in the case of new private
sector banks (1.2 percentage points). Owing to higher lending rates, return of
advances of SCBs showed a significant improvement of one percentage point during
the year with the improvement being observed across all bank groups. The increase
was significantly higher in the case of new private sector banks (1.7 percentage
points). Return on investments by SCBs, however, declined marginally during 2007-08
from the previous year’s level mainly reflecting the prevailing financial
markets conditions. The decline in return on investments was observed across all
bank groups, barring new private sector banks which showed an increase of 0.8
percentage points. The improvement in the overall return on funds was lower than
the increase in the cost of funds, leading to a decline of around 20 basis points
in the spread (returns of funds over cost of funds) of banks during 2007-08
(Table III.22).
Income
3.65 Overall
income of SCBs during 2007-08 increased at a significantly higher rate of 34.3
per cent as compared with 24.4 per cent increase in the previous year. The income
to assets ratio improved to 8.5 per cent after remaining unchanged at 7.9 per
cent in the previous two years (Appendix Table III.15). Reflecting the higher
lending rates, interest income of SCBs during 2007-08 increased by 33.6 per cent
as compared with 25.0 per cent in the previous year (Table III.23).
‘Other income’ of SCBs during 2007-08 increased by 37.8 per cent as
compared with 21.7 per cent during the previous year, reflecting the increasing
diversification of sources of income by banks.
Table
III.22: Cost of Funds and Returns on Funds - Bank Group-wise
| (Per
cent) | Indicator | Public
Sector | Old
Private | New
Private | Foreign | Scheduled |
| Banks | Sector
Banks | Sector
Banks | Banks | Commercial
Banks |
| 2006-07 | 2007-08 | 2006-07 | 2007-08 | 2006-07 | 2007-08 | 2006-07 | 2007-08 | 2006-07 | 2007-08 |
1 | 2 | 3 | 4 | 5 | 6 | 7 | 8 | 9 | 10 | 11 |
1. | Cost
of Deposits | 4.5 | 5.4 | 4.9 | 5.7 | 4.7 | 5.9 | 3.1 | 3.8 | 4.4 | 5.4 |
2. | Cost
of Borrowings | 2.8 | 3.6 | 3.4 | 4.6 | 3.1 | 3.1 | 4.7 | 4.5 | 3.3 | 3.7 |
3. | Cost
of Funds | 4.4 | 5.3 | 4.8 | 5.7 | 4.5 | 5.5 | 3.5 | 4.0 | 4.3 | 5.3 |
4. | Return
on Advances | 7.7 | 8.6 | 8.6 | 9.6 | 8.3 | 10.0 | 8.7 | 9.8 | 7.9 | 8.9 |
5. | Return
on Investments | 7.1 | 6.8 | 7.0 | 6.5 | 5.7 | 6.5 | 7.5 | 7.1 | 6.9 | 6.7 |
6. | Return
on Funds | 7.5 | 8.0 | 8.0 | 8.6 | 7.4 | 8.7 | 8.2 | 8.7 | 7.6 | 8.2 |
7. | Spread
(6-3) | 3.1 | 2.7 | 3.2 | 2.9 | 2.9 | 3.2 | 4.7 | 4.8 | 3.2 | 3.0 |
Notes :1.Cost of Deposits
= Interest Paid on Deposits/Deposits.
2.Cost of Borrowings = Interest Paid
on Borrowings/Borrowings.
3.Cost of Funds = (Interest Paid on Deposits + Interest
Paid on Borrowings)/(Deposits + Borrowings).
4.Return on Advances = Interest
Earned on Advances /Advances.
5.Return on Investments = Interest Earned on
Investments /Investments.
6.Return on Funds = (Return on Advances + Return
on Investments)/(Investments + Advances). |
Table
III.23: Important Financial Indicators of Scheduled Commercial Banks
| (Amount
in Rs. crore) | Item | 2005-06 | 2006-07 | 2007-08 |
| Amount | Per
cent to | Amount | Per
cent to | Amount | Per
cent to |
|
| Assets |
| Assets |
| Assets |
1 | 2 | 3 | 4 | 5 | 6 | 7 |
1. | Income | 2,20,756 | 7.9 | 2,74,716 | 7.9 | 3,68,886 | 8.5 |
| a) | Interest
Income | 1,85,388 | 6.7 | 2,31,675 | 6.7 | 3,09,570 | 7.2 |
| b) | Other
Income | 35,368 | 1.3 | 43,041 | 1.2 | 59,315 | 1.4 |
2. | Expenditure | 1,96,174 | 7.0 | 2,43,514 | 7.0 | 3,26,160 | 7.5 |
| a) | Interest
Expended | 1,07,161 | 3.8 | 1,42,420 | 4.1 | 2,08,001 | 4.8 |
| b) | Operating
Expenses | 59,201 | 2.1 | 66,319 | 1.9 | 77,220 | 1.8 |
| | of
which : Wage Bill | 33,461 | 1.2 | 36,148 | 1.0 | 39,806 | 0.9 |
| c) | Provision
and | | | | | | |
| | Contingencies | 29,812 | 1.1 | 34,775 | 1.0 | 40,939 | 0.9 |
3. | Operating
Profit | 54,394 | 2.0 | 65,977 | 1.9 | 83,665 | 1.9 |
4. | Net
Profit | 24,582 | 0.9 | 31,203 | 0.9 | 42,726 | 1.0 |
5. | Net
Interest Income/Margin (1a-2a) | 78,227 | 2.8 | 89,255 | 2.6 | 1,01,570 | 2.3 |
Note: The
number of scheduled commercial banks was 85 in 2005-06, 82 in 2006-07 and 79 in
2007-08. |
3.66 The relative contribution of interest
and non-interest income in total income of SCBs showed significant variations
in recent years. The share of interest income, which had declined to a low level
of 78.5 per cent in 2003-04, increased during the following three years. In 2007-08,
however, it declined marginally to 83.9 per cent as compared with 84.3 per cent
in the previous year (Chart III.13). The share of non-interest
incomes showed a corresponding increase. 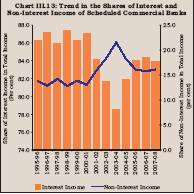
3.67
There was a discernible change in the relative contribution of interest and non-interest
income to total income during 2007-08. Non-interest sources contributed 17.3 per
cent to incremental income of SCBs as compared with 14.2 per cent during the previous
year. The interest component showed a corresponding decline during 2007-08 (Chart
III.14). Non-interest income in relation to total assets increased from 1.2
per cent in 2006-07 to 1.4 per cent in 2007-08. 
3.68
The composition of non-interest income of SCBs has undergone some changes in recent
years, particularly in terms of fee based income (Box III.2).
Income from trading, which increased significantly during 2001-02 to 2003-04,
declined in recent years.
3.69 Among bank-groups, income of new private
sector banks grew at the highest rate (45.8 per cent) during 2007-08, followed
by foreign banks (40.0 per cent), public sector banks (30.9 per cent) and old
private sector banks (28.8 per cent). The interest income to total assets ratio
of new private sector banks and SBI group improved during the year, while it declined
in the case of other bank groups [Appendix Table III.17(A to G)]. Expenditure
3.70 Expenditure of SCBs increased by 33.9 per cent during 2007-08 as compared
with 24.1 per cent in the previous year. Among the major components of expenditure
of SCBs, reflecting the impact of deposits contracted at different interest rates,
interest expended increased sharply by 46.0 per cent as compared with 32.9 per
cent in the previous year. Non-interest or operating expenses increased by 16.4
per cent as compared with 12.0 per cent in the last year. Provisioning made increased
marginally (Table III.24).
3.71 In relation to assets,
interest expenses increased to 4.8 per cent of total assets from 4.1 per cent
in 2006-07. Operating expenses as percentage of total assets, however, declined
marginally to 1.8 per cent in 2007-08 as compared with 1.9 per cent in the previous
year (Appendix Table III.25). As a result, banks’ burden
(excess of non-interest expenditure over non-interest income) declined significantly
to 0.4 per cent of total assets in 2007-08 as compared with 0.7 per cent in 2006-07
and 0.9 per cent in 2005-06. The efficiency ratio (operating expenses as percentage
of net interest income plus non-interest income) improved to 48.0 per cent during
2007-08 from 50.1 per cent in 2006-07, reflecting the rise in non-interest income
and decline in operating expenses, which combined together outweighed the decline
in net interest income (in relation to total assets). Box
III.2: Sources of Non-interest Income of Scheduled Commercial Banks With
the increased competition brought about by financial liberalisation, banks began
to diversify their activities and as such non-interest income of banks acquired
greater significance in the income portfolio of banks in India. An analysis of
data on scheduled commercial banks (excluding regional rural banks) from 2000-01
to 2007-08 suggests that the ratio of non-interest income to total income of scheduled
commercial banks increased from 13.0 per cent in 2000-01 to 21.6 per cent in 2003-04.
The ratio, however, declined thereafter to 15.7 per cent in 2006-07, before showing
a marginal increase in 2007-08 to 16.1 per cent (Chart 1). 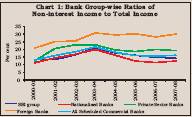
The
share of non-interest income in total income was the highest in respect of foreign
banks in each of the single year from 2000-01 to 2007-08, indicating their large
exposure to off-balance sheet items. On the other hand, the share of non-interest
income was the lowest in respect of nationalised banks.
Sources of non-interest
income of SCBs comprise: (i) commission, exchange, and brokerage; (ii) profit
on sale of investments; (iii) profit on exchange transaction; and (iv) miscellaneous
income. The miscellaneous income of banks includes profit on revaluation of investments,
profit on sale of fixed assets such as buildings. Of these, while profit on exchange
transactions and miscellaneous income showed more or less a steady trend, commission,
exchange and brokerage, and profit on sale of investments showed a divergent trend.
The share of commission, exchange and brokerage declined sharply during 2003-04,
in which year, however, the share of profit on sale of investments increased commensurately.
During 2006-07, when the commission, exchange and brokerage increased sharply,
that of profit on sale of investments showed a sharp decline (Chart
2). 
References:
1. Reserve Bank of India (2008a), Statistical Tables Relating to Banks in India
1979-2007.
———— (2008b), Annual Accounts of Scheduled
Commercial Banks, 2007-08.
Table
III.24: Variation in Income-Expenditure of
Scheduled Commercial
Banks | (Amount
in Rs. crore) | Item | 2006-07 | 2007-08 |
| Absolute | Per
cent | Absolute | Per
cent | 1 | 2 | 3 | 4 | 5 |
1. | Income
(a+b) | 53,961 | 24.4 | 94,169 | 34.3 |
| a) | Interest
Income | 46,287 | 25.0 | 77,895 | 33.6 |
| b) | Other
Income | 7,673 | 21.7 | 16,274 | 37.8 |
2. | Expenses
(a+b+c) | 47,340 | 24.1 | 82,646 | 33.9 |
| a) | Interest
Expenses | 35,259 | 32.9 | 65,581 | 46.0 |
| b) | Other
Expenses | 7,118 | 12.0 | 10,901 | 16.4 |
| c) | Provisioning | 4,963 | 16.6 | 6,164 | 17.7 |
3. | Operating
Profit | 11,583 | 21.3 | 17,688 | 26.8 |
4. | Net
Profit | 6,621 | 26.9 | 11,523 | 36.9 |
Source : Balance
Sheets of respective banks. | 4.1 per cent in 2006-07.
Operating expenses as percentage of total assets, however, declined marginally
to 1.8 per cent in 2007-08 as compared with 1.9 per cent in the previous year
(Appendix Table III.25). As a result, banks’ burden (excess of non-interest
expenditure over non-interest income) declined significantly to 0.4 per cent of
total assets in 2007-08 as compared with 0.7 per cent in 2006-07 and 0.9 per cent
in 2005-06. The efficiency ratio (operating expenses as percentage of net interest
income plus non-interest income) improved to 48.0 per cent during 2007-08 from
50.1 per cent in 2006-07, reflecting the rise in non-interest income and decline
in operating expenses, which combined together outweighed the decline in net interest
income (in relation to total assets).
3.72 Wages by SCBs increased at
a somewhat higher rate of 10.1 per cent in 2007-08 as compared with 8.0 per cent
in the previous year. In terms of percentage to total assets, however, the wage
bill of SCBs declined marginally to 0.9 per cent as compared with 1.0 per cent
in 2006-07. A similar decline was also observed in the ratio of wage bill to operating
expenses during 2007-08 (Chart III.15). Continuing the trend,
the wage bill to operating expenses ratio was the lowest in respect of new private
sector banks (31.2 per cent) in 2007-08, followed by foreign banks (39.9 per cent),
notwithstanding some increase in the ratio over the previous year. The wage bill
to operating ratio of other bank groups showed a marginal decline during 2007-08,
essentially reflecting the reduction in expenditure on wages due to continued
emphasis on technological updgradation. 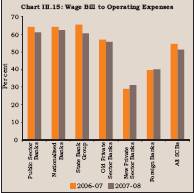
Net Interest Income
3.73 The difference between
interest income and interest expenses, i.e., net interest income, is
an important indicator of efficiency of the intermediation process by banks. Lower
net interest income in relation to assets is an indicator of higher efficiency.
Continuing the trend that began in 2004-05, net interest income (spread) of SCBs
as percentage of total assets declined to 2.3 per cent in 2007-08 from 2.6 per
cent in the previous year. Among the bank groups, net interest margin of foreign
banks and private banks increased, while that of PSBs declined during 2007-08
(Appendix Table III.23).
Operating Profits 3.74
Reflecting the buoyant growth in non-interest income on the one hand and a relatively
subdued growth in operating expenses on the other, operating profits of SCBs increased
by 26.8 per cent in 2007-08 as compared with an increase of 21.3 per cent in 2006-07.
Though the operating profits increased across all bank groups, the increase was
more pronounced in respect of new private sector and foreign banks. The operating
profits to total assets ratio during 2007-08 remained almost unchanged at the
previous year’s level of 1.9 per cent. At the individual bank level, the
operating profits to assets ratio showed large variations. The ratio varied between
11.1 per cent and (-)0.7 per cent in respect of foreign banks, between 2.8 per
cent to 0.8 per cent in the case of private sector banks (barring Sangli Bank
and Lord Krishna Bank which were merged during the year) and between 2.4 per cent
to 0.8 per cent for public sector banks (Appendix Table III.19).
Provisions
and Contingencies
3.75 Provisions and contingencies of
SCBs during 2007-08 grew at a marginally higher rate of 17.7 per cent as compared
with 16.6 per cent in the previous year. While provisions for loans during 2007-08
were higher by 5.3 per cent, provisions for depreciation in value of investments
declined by 11.6 per cent. Bank-group wise, provisions and contingencies as percentage
of total assets increased for private sector and foreign banks, while they declined
for PSBs.
Net Profit
3.76
Net profits of SCBs showed a significant increase of 36.9 per cent during 2007-08
as compared with 26.9 per cent in the previous year despite the larger increase
in provisions and contingencies (Table III.25).
Return
on Assets
3.77 Return on assets (RoA)
is an indicator of efficiency with which banks deploy their assets. During 2007-08,
the net profits to assets ratio of SCBs improved moderately to 1.0 per cent from
0.9 per cent in 2006-07. Though net profits as percentage of total assets improved
across all bank groups, the improvement was more pronounced in the case of old
private sector banks (Chart III.16). Foreign banks continued
to show the highest returns on assets.
Table
III.25: Operating Profit and Net Profit - Bank Group-wise |
(Amount
in Rs. Crore) | Bank
Group | Operating
Profit | Net
Profit |
| 2006-07 | Percentage | 2007-08 | Percentage | 2006-07 | Percentage | 2007-08 | Percentage |
|
| Variation |
| Variation |
| Variation |
| Variation |
1 | 2 | 3 | 4 | 5 | 6 | 7 | 8 | 9 |
Scheduled Commercial Banks | 65,977 | 21.3 | 83,665 | 26.8 | 31,203 | 26.9 | 42,726 | 36.9 |
Public Sector Banks | 42,655 | 12.3 | 50,441 | 18.3 | 20,152 | 21.8 | 26,592 | 32.0 |
Nationalised Banks | 27,456 | 24.0 | 31,663 | 15.3 | 12,950 | 29.2 | 16,856 | 30.2 |
State Bank Group | 14,292 | -4.9 | 17,444 | 22.1 | 6,572 | 10.3 | 9,006 | 37.0 |
Other Public Sector Bank | 907 | 13.2 | 1,333 | 47.0 | 630 | 12.4 | 729 | 15.7 |
Old Private Sector Banks | 3,021 | 33.8 | 3,605 | 19.3 | 1,122 | 29.6 | 1,978 | 76.3 |
New Private Sector Banks | 10,682 | 42.2 | 15,632 | 46.3 | 5,343 | 30.0 | 7,544 | 41.2 |
Foreign Banks | 9,619 | 44.5 | 13,988 | 45.4 | 4,585 | 49.4 | 6,612 | 44.2 |
Source : Balance
sheets of respective banks. | 
Return
on Equity
3.78 Return on equity (RoE), an indicator of
efficiency with which capital is used by banking institutions, declined to 12.5
per cent as at end-March 2008 from 13.2 per cent at end-March 2007, reflecting
mainly the impact of increase in resources raised from the capital market during
the year and reserves and surplus (Chart III.17). 
5.
Soundness Indicators
3.79 A sound and efficient banking
system is a sine qua non for maintaining financial stability. Therefore,
considerable emphasis has been placed on strengthening the capital requirements
in recent years. The capital to risk-weighted assets ratio (CRAR) of SCBs, a measure
of the capacity of the banking system to absorb unexpected losses, improved further
to 13.0 per cent at end-March 2008 from 12.3 per cent at end-March 2007. Asset
quality of SCBs also improved consistently in the past few years as reflected
in the decline in non-performing assets (NPAs) as percentage of total advances.
During 2007-08, while overall gross NPAs of SCBs declined to 2.3 per cent of gross
advances from 2.5 per cent in the previous year, net NPAs as percentage of net
advances remained at the previous year’s level of 1.0 per cent. Thus, in
terms of the two crucial soundness indicators, viz., capital and asset
quality, the Indian banking sector showed further improvement during 2007-08
(Chart III.18). 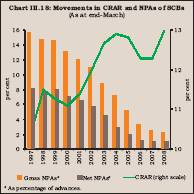
Asset
Quality
3.80 The trend of improvement in
the asset quality of banks continued during the year. Indian banks recovered a
higher amount of NPAs during 2007-08 than that during the previous year. Though
the total amount recovered and written-off at Rs.28,283 crore in 2007-08 was higher
than Rs.26,243 crore in the previous year, it was lower than fresh addition of
NPAs (Rs.34,420 crore) during the year. As a result, the gross NPAs of SCBs increased
by Rs.6,136 crore in 2007-08. This is the first time since 2001-02 that gross
NPAs increased in absolute terms (Table III.26). In this context,
it may be noted that banks had registered rapid credit growth during the previous
three years. Some slippage in NPAs, therefore, could be expected. Besides, some
other developments such as hardening of interest rates might have also resulted
in increased NPAs. Banks had extended housing loans at floating interest rates.
The hardening of interest rates might have made the repayment of loans difficult
for some borrowers, resulting in some increase in NPAs in this sector. It may
be noted that the increase in gross NPAs was more noticeable in respect of new
private sector and foreign banks, which have been more active in the real estate
and housing loans segments. Gross NPAs (in absolute terms) of nationalised banks
and old private sector banks continued to decline during the year. Gross NPAs
of State Bank group showed an increase. Notwithstanding increase in gross NPAs
of the banking sector, gross NPAs as percentage of gross advances declined further
to 2.3 per cent at end-March 2008 from 2.5 per cent a year ago. The NPAs ratio
(gross NPAs to gross advances) of new private sector banks increased significantly
during the year, while that of foreign banks increased marginally. The NPAs ratio
of all other bank groups declined.
Table
III.26: Movements in Non-performing Assets - Bank Group-wise
| (Amount
in Rs. crore) | Item | Scheduled | Public | Nationalised | State | Old
Private | New
Private | Foreign |
| Commercial | Sector | Banks | Bank | Sector | Sector | Banks |
| Banks | Banks | (20*) | Group | Banks | Banks | (28) |
| (79) | (28) |
| (8) | (15) | (8) |
|
1 | 2 | 3 | 4 | 5 | 6 | 7 | 8 |
Gross NPAs | | | | | | | |
As at end-March 2007 | 50,299 | 38,968 | 26,292 | 12,676 | 2,810 | 6,286 | 2,233 |
Addition during the year | 34,420 | 24,093 | 14,617 | 9,476 | 1,249 | 6,412 | 2,664 |
Recovered during the year | 28,090 | 22,466 | 15,791 | 6,675 | 1,501 | 2,272 | 1,849 |
Written off during the year | 193 | 0 | 0 | 0 | 1 | 0 | 191 |
As at end-March 2008 | 56,435 | 40,595 | 25,117 | 15,478 | 2,557 | 10,426 | 2,856 |
Net NPAs | | | | | | | |
As at end-March 2007 | 20,207 | 15,324 | 8,965 | 6,359 | 831 | 3,136 | 913 |
As at end-March 2008 | 24,733 | 17,836 | 9,328 | 8,508 | 740 | 4,906 | 1,250 |
Memo: | | | | | | | |
Gross Advances | | | | | | | |
(end-March 2008) | 25,07,885 | 18,19,074 | 12,18,554 | 6,00,521 | 1,13,404 | 4,12,441 | 1,62,966 |
Net Advances | | | | | | | |
(end-March 2008) | 24,77,039 | 17,97,504 | 12,03,782 | 5,93,722 | 1,11,670 | 4,06,733 | 1,61,132 |
Gross NPAs/Gross Advances Ratio | | | | | | | |
End-March 2007 | 2.5 | 2.7 | 2.7 | 2.6 | 3.1 | 1.9 | 1.8 |
End-March 2008 | 2.3 | 2.2 | 2.1 | 2.6 | 2.3 | 2.5 | 1.9 |
Net NPAs/Net Advances
Ratio | | | | | | | |
End-March 2007 | 1.0 | 1.1 | 0.9 | 1.3 | 1.0 | 1.0 | 0.7 |
End-March 2008 | 1.0 | 1.0 | 0.8 | 1.4 | 0.7 | 1.2 | 0.8 |
* : Includes IDBI Bank Ltd.
Note : Figures in parentheses are the number of banks.
Source
: Balance sheets of respective banks. | 3.81
Among the various channels of recovery available to banks for dealing with bad
loans, the SARFAESI Act and the debt recovery tribunals (DRTs) have been the most
effective in terms of amount recovered. The amount recovered as percentage of
amount involved was the highest under the SARFAESI Act, followed by DRTs (Table
III.27).
3.82 In the case of direct agricultural advances, the recovery
rate (percentage of recovery to demand) declined to 79.7 per cent for the year
ended June 2007 from 80.1 per cent a year ago (Table III.28).
3.83 The Reserve Bank has so far issued certificate of registration (CoR)
to eleven securitisation companies/reconstruction companies (SCs/RCs), of which
six have commenced their operations. At end-June 2008, the book value of total
amount of assets acquired by SCs/RCs registered with the Reserve Bank was at Rs.41,414
crore, showing an increase of 45.1 per cent during the year (July 2007 to June
2008). While security receipts subscribed to by banks/FIs amounted to Rs.8,319
crore, security receipts redeemed amounted to Rs.1,299 crore (Table
III.29). Movements in Provisions for Non-performing
Assets
3.84 Provisioning for non-performing assets tends
to follow a cyclical pattern. In the expansionary phase of business cycle, impairment
to balance sheets of banks tends to be relatively lower requiring lower provisioning
even as credit increases at a faster pace. The downturn phase of business cycle,
on other hand, increases the possibility of credit losses, leading to higher provisioning
requirements. The higher provisioning in the downturn phase may, thus, put pressure
on the credit availability and accentuate the contraction phase of business cycle.
3.85 Provisioning made during 2007-08 was higher than write-back of excess
provisioning during the year. Still, however, net NPAs increased during the year
due to increase in gross NPAs. Among bank groups, provisions made during the year
were higher than write-back of excess provisions for new private sector banks
and foreign banks whereas they were lower for public sector banks and old private
sector banks. Thus, the cumulative provisions at end-March 2008 were higher than
their respective levels a year ago in respect of new private sector and foreign
banks whereas they were lower for public sector and old private sector banks.
Cumulative provisions as percentage of NPAs declined marginally to 52.4 per cent
at end-March 2008 from 56.1 per cent at end-March 2007. Bank-group wise, the ratio
was the highest for old private sector banks (64.9 per cent), followed by PSBs,
new private sector banks and foreign banks (Table III.30 and
Appendix Table
III.24).
Table
III.27: NPAs recovered by SCBs through various Channels |
(Amount
in Rs. crore) | Recovery
Channel | 2006-07 | 2007-08 |
|
| No.
of cases | Amount | Amount | Col.
(4) as % | No.
of cases | Amount | Amount | Col.(8)
as % |
|
| referred | involved | Recovered | of
Col. (3) | referred | involved | Recovered | of
Col.(7) | 1 |
| 2 | 3 | 4 | 5 | 6 | 7 | 8 | 9 |
i) | Lok
Adalats | 160,368 | 758 | 106 | 14.0 | 186,535 | 2,142 | 176 | 8.2 |
ii) | DRTs | 4,028 | 9,156 | 3,463 | 37.8 | 3,728 | 5,819 | 3,020 | 51.9 |
iii) | SARFAESI
Act | 60,178# | 9,058 | 3,749 | 41.4 | 83,942# | 7,263 | 4,429 | 61.0 |
# :Number of notices issued.
|
Table
III.28: Recovery of Direct Agricultural |
Advances of PSBs |
(Amount
in Rs. crore) | Year | Demand | Recovery | Overdues | Percentage |
ended June | | | | of
Recovery | | | | | to
Demand | 1 | 2 | 3 | 4 | 5 |
2004 | 33,544 | 25,002 | 8,542 | 74.5 |
2005 | 45,454 | 35,733 | 9,721 | 78.6 |
2006 | 46,567 | 37,298 | 9,269 | 80.1 |
2007 | 73,802 | 58,840 | 14,958 | 79.7 |
Table
III.29: Details of Financial Assets
Securitised by SCs/RCs |
(Rs.
crore) | Item | End-June | End-June |
| 2007 | 2008 |
1 | 2 | 3 |
1. | Book
Value of Assets Acquired | 28,544 | 41,414 |
2. | Security
Receipts issued | 7,436 | 10,658 |
3. | Security
Receipts subscribed by | | |
| (a) | Banks | 6,894 | 8,319 |
| (b) | SCs/RCs | 408 | 1,647 |
| (c) | FIIs | - | - |
| (d) | Others(QIBs) | 134 | 692 |
4. | Amount
of Security Receipts | | |
| completely
redeemed | 660 | 1,299 |
3.86 Notwithstanding an increase in the fresh accretions to gross
NPAs (Rs.34,420 crore) of SCBs during 2007-08, gross NPAs as percentage of gross
advances declined during the year. The net NPA ratio (net NPAs as percentage of
net advances) declined in respect of public sector and old private sector banks,
while it increased in respect of new private sector banks and foreign banks. The
net NPAs to net advances ratio at end-March 2008 was highest (1.2 per cent) in
respect of new private sector banks, followed by public sector, foreign and old
private sector banks at 1.0 per cent, 0.8 per cent and 0.7 per cent, respectively
(Table III.31 and Appendix
Table III.27 and III.28).
3.87 The net NPAs to net advances ratio
at end-March 2008 of 75 banks (76 last year) out of 79 (82 last year) was less
than 2 per cent. The net NPAs ratio of only one foreign bank was higher than 5
per cent (Table III.32). During 2007-08, the net NPA ratio
of six banks each in the public sector and private sector improved (Appendix Table
III.27 and III.28).
3.88 Apart from decline in the NPA ratios, the improvement
in asset quality of SCBs during 2007-08 was also reflected in the different loan
asset categories. The share of ‘sub-standard’ loans showed a marginal
increase to 1.1 per cent from 1.0 per cent in the previous year. However, the
shares of loans in ‘doubtful’ and ‘loss’ categories, which
represent lower quality of assets than sub-standard assets, continued to decline
during 2007-08. Among these two categories (‘loss’ and ‘doubtful’),
while NPAs in ‘loss’ category continued to show decline in absolute
terms, NPAs in ‘doubtful’ category showed a marginal increase in 2007-08.
More or less a similar trend was observed across all bank groups, barring new
private sector banks in whose case the NPAs in all the three categories, viz.,
sub-standard, doubtful and loss increased during the year (Table
III.33).
Table
III.30: Movements in Provisions for Non-performing Assets - Bank Group-wise
| (Amount
in Rs. crore) | Item | Scheduled | Public | Nationalised | State | Old
Private | New
Private | Foreign |
| Commercial | Sector | Banks | Bank | Sector | Sector | Banks |
| Banks | Banks | (20*) | Group | Banks | Banks | (28) |
| (79) | (28) |
| (8) | (15) | (8) |
|
1 | 2 | 3 | 4 | 5 | 6 | 7 | 8 |
Provisions for NPAs | | | | | | | |
As at end-March 2007 | 28,188 | 22,139 | 15,851 | 6,288 | 1,807 | 3,087 | 1,152 |
Add :Provisions made during the year | 15,240 | 9,810 | 6,541 | 3,269 | 416 | 3,846 | 1,166 |
Less :Write-off, write back of excess during
the year | 13,750 | 10,769 | 8,006 | 2,763 | 564 | 1,574 | 841 |
As at end-March 2008 | 29,678 | 21,180 | 14,387 | 6,793 | 1,659 | 5,359 | 1,478 |
Memo: | | | | | | | |
Gross NPAs | 56,435 | 40,595 | 25,117 | 15,478 | 2,557 | 10,426 | 2,856 |
Outstanding Provisions to Gross NPAs (per
cent) | | | | | | | |
End-March 2007 | 56.1 | 56.8 | 57.4 | 49.6 | 66.0 | 49.1 | 51.1 |
End-March 2008 | 52.6 | 52.2 | 57.3 | 43.9 | 64.9 | 51.4 | 51.7 |
* : Includes IDBI Bank Ltd.
Note:Figures in parentheses indicate the number of banks in that
group at end-March 2008.
Source :Balance sheets of respective
banks. |
Table
III.31: Gross and Net NPAs of Scheduled Commercial Banks - Bank Group-wise
| (As
at end-March) | (Amount
in Rs. crore) | Bank
Group/Year | Gross | Gross
NPAs | Net | Net
NPAs |
| Advances | Amount | Per
cent to | Per
cent to | Advances | Amount | Per
cent to | Per
cent to |
|
|
| Gross | total |
|
| Net | total |
|
|
| Advances | Assets |
|
| Advances | Assets |
1 | 2 | 3 | 4 | 5 | 6 | 7 | 8 | 9 |
Scheduled Commercial Banks | | | | | | | | |
2005 | 11,52,682 | 59,373 | 5.2 | 2.5 | 11,15,663 | 21,754 | 1.9 | 0.9 |
2006 | 15,51,491 | 51,097 | 3.3 | 1.8 | 15,16,812 | 18,543 | 1.2 | 0.7 |
2007 | 20,12,510 | 50,486 | 2.5 | 1.5 | 19,81,237 | 20,101 | 1.0 | 0.6 |
2008 | 25,07,885 | 56,435 | 2.3 | 1.3 | 24,77,039 | 24,734 | 1.0 | 0.6 |
Public Sector Banks | | | | | | | | |
2005 | 8,77,825 | 48,399 | 5.5 | 2.7 | 8,48,912 | 16,904 | 2.0 | 1.0 |
2006 | 11,34,724 | 41,358 | 3.6 | 2.1 | 11,06,288 | 14,566 | 1.3 | 0.7 |
2007 | 14,64,493 | 38,968 | 2.7 | 1.6 | 14,40,146 | 15,145 | 1.1 | 0.6 |
2008 | 18,19,074 | 40,595 | 2.2 | 1.3 | 17,97,504 | 17,836 | 1.0 | 0.6 |
Old Private Sector Banks | | | | | | | | |
2005 | 70,412 | 4,200 | 6.0 | 3.1 | 67,742 | 1,859 | 2.7 | 1.4 |
2006 | 85,154 | 3,759 | 4.4 | 2.5 | 82,957 | 1,375 | 1.7 | 0.9 |
2007 | 94,872 | 2,969 | 3.1 | 1.8 | 92,887 | 891 | 1.0 | 0.6 |
2008 | 1,13,404 | 2,557 | 2.3 | 1.3 | 1,11,670 | 740 | 0.7 | 0.4 |
New Private Sector Banks, | | | | | | | | |
2005 | 1,27,420 | 4,582 | 3.6 | 1.6 | 1,23,655 | 2,353 | 1.9 | 0.8 |
2006 | 2,32,536 | 4,052 | 1.7 | 1.0 | 2,30,005 | 1,796 | 0.8 | 0.4 |
2007 | 3,25,273 | 6,287 | 1.9 | 1.1 | 3,21,865 | 3,137 | 1.0 | 0.5 |
2008 | 4,12,441 | 10,426 | 2.5 | 1.4 | 4,06,733 | 4,907 | 1.2 | 0.7 |
Foreign Banks | | | | | | | | |
2005 | 77,026 | 2,192 | 2.8 | 1.4 | 75,354 | 639 | 0.8 | 0.4 |
2006 | 98,965 | 1,928 | 1.9 | 1.0 | 97,562 | 808 | 0.8 | 0.4 |
2007 | 1,27,872 | 2,263 | 1.8 | 0.8 | 1,26,339 | 927 | 0.7 | 0.3 |
2008 | 1,62,966 | 2,857 | 1.8 | 0.8 | 1,61,133 | 1,250 | 0.8 | 0.3 |
Source : Balance
sheets of respective banks. |
Table
III.32: Distribution of Scheduled Commercial Banks by Ratio of Net NPAs to Net
Advances | (Number
of banks) | Bank
Group | As
at end-March |
| 2004 | 2005 | 2006 | 2007 | 2008 |
1 | 2 | 3 | 4 | 5 | 6 |
Public Sector Banks | 27 | 28 | 28 | 28 | 28 |
Up to 2 per cent | 11 | 19 | 23 | 27 | 28 |
Above 2 and up to 5 per cent | 13 | 7 | 5 | 1 | 0 |
Above 5 and up to 10 per cent | 3 | 2 | 0 | 0 | 0 |
Above 10 per cent | 0 | 0 | 0 | 0 | 0 |
Old Private Sector Banks | 20 | 20 | 20 | 17 | 15 |
Up to 2 per cent | 2 | 4 | 11 | 15 | 15 |
Above 2 and up to 5 per cent | 9 | 12 | 7 | 1 | 0 |
Above 5 and up to 10 per cent | 7 | 4 | 2 | 1 | 0 |
Above 10 per cent | 2 | 0 | 0 | 0 | 0 |
New Private Sector Banks | 10 | 9 | 8 | 8 | 8 |
Up to 2 per cent | 4 | 5 | 6 | 7 | 7 |
Above 2 and up to 5 per cent | 5 | 3 | 2 | 1 | 1 |
Above 5 and up to 10 per cent | 0 | 1 | 0 | 0 | 0 |
Above 10 per cent | 1 | 0 | 0 | 0 | 0 |
Foreign Banks | 33 | 31 | 29 | 29 | 28 |
Up to 2 per cent | 22 | 23 | 25 | 27 | 25 |
Above 2 and up to 5 per cent | 2 | 2 | 0 | 1 | 2 |
Above 5 and up to 10 per cent | 3 | 2 | 0 | 0 | 1 |
Above 10 per cent | 6 | 4 | 4 | 1 | 0 |
Sector-wise NPAs
3.89 The sector-wise analysis of
NPAs of public and private sector banks indicates that the NPAs in the priority
sector increased by 11.1 per cent during 2007-08 (4.8 per cent in the previous
year) mainly due to increase in NPAs in the agriculture sector (32.1 per cent)
and in the non-priority sector (10.3 per cent). At the aggregate level, the share
of priority sector NPAs in total NPAs at 54.4 per cent was broadly same as in
the previous year (54.0 per cent) [Table III.34, Appendix
Table III.29 (A) and 29
(B); and Appendix
Table 30 (A) and 30
(B)].
Table
III.33: Classification of Loan Assets - Bank Group-wise |
(As
at end-March) | (Amount
in Rs. crore) | Bank
Group | Standard | Sub-Standard | Doubtful | Loss | Total |
| Total |
| Assets | Assets | Assets | Assets | Gross |
| Gross |
|
|
|
|
|
|
|
|
| NPAs |
| Advances |
| Amount | Per | Amount | Per | Amount | Per | Amount | Per | Amount | Per | Amount |
|
| cent |
| cent |
| cent |
| cent |
| cent |
|
|
|
|
|
|
|
|
|
|
|
|
|
1 | 2 | 3 | 4 | 5 | 6 | 7 | 8 | 9 | 10 | 11 | 12 |
Scheduled Commercial Banks | | | | | | | | | | | |
2004 | 8,37,130 | 92.9 | 21,026 | 2.3 | 36,247 | 4.0 | 7,625 | 0.9 | 64,898 | 7.2 | 9,02,027 |
2005 | 10,93,523 | 94.9 | 14,016 | 1.2 | 37,763 | 3.3 | 7,382 | 0.6 | 59,161 | 5.1 | 11,52,684 |
2006 | 14,99,431 | 96.7 | 14,826 | 1.0 | 30,105 | 2.0 | 7,016 | 0.4 | 51,947 | 3.3 | 15,51,378 |
2007 | 19,61,877 | 97.5 | 20,010 | 1.0 | 24,408 | 1.2 | 6,215 | 0.3 | 50,633 | 2.5 | 20,12,510 |
2008 | 24,51,217 | 97.7 | 26,541 | 1.1 | 24,507 | 1.0 | 5,619 | 0.2 | 56,668 | 2.3 | 25,07,885 |
Public Sector Banks | | | | | | | | | | | |
2004 | 6,10,435 | 92.2 | 16,909 | 2.5 | 28,756 | 4.4 | 5,876 | 0.9 | 51,541 | 7.8 | 6,61,975 |
2005 | 8,30,029 | 94.6 | 11,068 | 1.3 | 30,779 | 3.5 | 5,929 | 0.7 | 47,796 | 5.4 | 8,77,825 |
2006 | 10,92,607 | 96.2 | 11,453 | 1.0 | 25,028 | 2.2 | 5,636 | 0.5 | 42,117 | 3.7 | 11,34,724 |
2007 | 14,25,519 | 97.3 | 14,275 | 1.0 | 19,873 | 1.4 | 4,826 | 0.3 | 38,974 | 2.7 | 14,64,493 |
2008 | 17,78,476 | 97.8 | 17,290 | 1.0 | 19,291 | 1.1 | 4,018 | 0.2 | 40,598 | 2.2 | 18,19,074 |
Old Private Sector Banks | | | | | | | | | | | |
2004 | 53,516 | 92.4 | 1,161 | 2.0 | 2,727 | 4.7 | 504 | 0.9 | 4,392 | 7.6 | 57,908 |
2005 | 66,212 | 94.0 | 784 | 1.1 | 2,868 | 4.0 | 549 | 0.8 | 4,201 | 6.0 | 70,413 |
2006 | 81,414 | 95.6 | 710 | 0.8 | 2,551 | 3.0 | 479 | 0.6 | 3,740 | 4.4 | 85,154 |
2007 | 91,903 | 96.9 | 760 | 0.8 | 1,783 | 1.9 | 425 | 0.4 | 2,969 | 3.1 | 94,872 |
2008 | 1,10,847 | 97.7 | 816 | 0.7 | 1,346 | 1.2 | 395 | 0.3 | 2,557 | 2.3 | 1,13,404 |
New Private Sector Banks | | | | | | | | | | | |
2004 | 1,13,560 | 95.0 | 1,966 | 1.6 | 3,665 | 3.0 | 321 | 0.3 | 5,952 | 5.0 | 1,19,512 |
2005 | 1,22,577 | 96.2 | 1,449 | 1.1 | 3,061 | 2.4 | 334 | 0.3 | 4,844 | 3.8 | 1,27,421 |
2006 | 2,28,504 | 98.3 | 1,717 | 0.7 | 1,855 | 0.8 | 460 | 0.2 | 4,032 | 1.8 | 2,32,536 |
2007 | 3,19,002 | 98.1 | 3,608 | 1.1 | 2,147 | 0.7 | 516 | 0.2 | 6,271 | 1.9 | 3,25,273 |
2008 | 4,02,013 | 97.5 | 6,473 | 1.6 | 3,106 | 0.8 | 849 | 0.2 | 10,428 | 2.5 | 4,12,441 |
Foreign Banks | | | | | | | | | | | |
2004 | 59,619 | 95.1 | 990 | 1.6 | 1,099 | 1.8 | 924 | 1.5 | 3,013 | 4.8 | 62,632 |
2005 | 74,705 | 97.0 | 715 | 1.0 | 1,035 | 1.3 | 570 | 0.7 | 2,320 | 3.0 | 77,025 |
2006 | 96,907 | 98.0 | 946 | 1.0 | 670 | 0.7 | 441 | 0.5 | 2,057 | 2.0 | 98,965 |
2007 | 1,25,453 | 98.1 | 1,367 | 1.1 | 605 | 0.5 | 447 | 0.3 | 2,419 | 1.9 | 1,27,872 |
2008 | 1,59,882 | 98.1 | 1,962 | 1.2 | 764 | 0.5 | 358 | 0.2 | 3,084 | 1.9 | 1,62,966 |
Note : Constituent
items may not add up to the total due to rounding off.
Source : Off-site
returns (Balance sheet returns) submitted by respective banks. |
Table
III.34: Sector-wise NPAs - Bank Group-wise* |
(Rs.
crore) | Sector | Public
Sector | Old
Private | New
Private | All
SCBs |
| Banks | Sector
Banks | Sector
Banks |
|
|
| 2006-07 | 2007-08 | 2006-07 | 2007-08 | 2006-07 | 2007-08 | 2006-07 | 2007-08 |
1 | 2 | 3 | 4 | 5 | 6 | 7 | 8 | 9 |
A. Priority Sector | 22,954 | 25,287 | 1,416 | 1,338 | 1,468 | 2,080 | 25,838 | 28,705 |
i) Agriculture | 6,506 | 8,268 | 249 | 243 | 612 | 1,225 | 7,367 | 9,735 |
ii) Small Scale Industries | 5,843 | 5,805 | 490 | 359 | 155 | 292 | 6,488 | 6,456 |
iii) Others | 10,604 | 11,214 | 677 | 737 | 702 | 563 | 11,983 | 12,514 |
B. Public Sector | 490 | 299 | 0 | 0 | 3 | 0 | 493 | 299 |
C. Non-Priority Sector | 15,158 | 14,163 | 1,553 | 1,219 | 4,800 | 8,339 | 21,510 | 23,721 |
Total (A+B+C) | 38,602 | 39,749 | 2,969 | 2,557 | 6,271 | 10,419 | 47,841 | 52,725 |
* : Excluding foreign banks.
Source : Based on off-site returns submitted by banks (pertaining
to domestic opertaions only). | Movements
in Provisions for Depreciation on Investments
3.90 The
provisions for depreciation on investments declined by 11.6 per cent at end-March
2008 from their level at end-March 2007 as a result of lower provisions made during
the year than the write-offs and write-back of excess provisions. The reduction
in provisions was despite the increase in investments during the year (Table
III.35).
Capital Adequacy
3.91
The overall CRAR of all SCBs improved to 13.0 per cent at end-March 2008 from
12.3 per cent a year ago, reflecting a relatively higher growth rate in capital
funds maintained by banks than risk-weighted assets. While the growth in risk-weighted
assets moderated in line with overall deceleration in credit growth during 2007-08,
capital funds increased at a higher rate on account of raising of resources by
banks from the capital market and increase in resources required for ensuing implementation
of Basel II norms. Thus, the CRAR of the banking system at 13.0 per cent was significantly
above the stipulated minimum of 9.0 per cent (Table III.36).
3.92 As a result of resources raised by banks from the capital market during
2007-08 and increase in reserves, the Tier I capital ratio of SCBs improved to
9.1 per cent at end-March 2008 from 8.3 per cent a year ago. However,the Tier
II capital declined marginally to 3.9 per cent at end-March 2008 from 4.0 per
cent a year ago (Chart III.19). Tier I CRAR was more than
the present stipulated requirement of 4.5 per cent and also above the 6.0 per
cent norm prescribed in the final guidelines for implementation of Basel II released
by the Reserve Bank on April 27, 2007.
Table
III.35: Movements in Provisions for Depreciation on Investment - Bank Group-wise |
(Amount
in Rs. crore) | Item |
| Scheduled | Public | Nationalised | State | Old
Private | New
Private | Foreign |
|
| Commercial | Sector | Banks | Bank | Sector | Sector | Banks |
|
| Banks | Banks |
| Group | Banks | Banks |
|
|
| (79) | (28) | (20*) | (8) | (15) | (8) | (28) |
1 |
| 2 | 3 | 4 | 5 | 6 | 7 | 8 |
Provision for Depreciation
on Investment | | | | | | | |
As at end-March 2007 | 11,492 | 8,904 | 6,616 | 2,288 | 321 | 819 | 1,448 |
Add : Provision made during
the year | 3,229 | 2,539 | 1,691 | 848 | 67 | 427 | 196 |
Less : Write-off, write-back
of excess | | | | | | | |
| during
the year | 4,566 | 3,881 | 2,120 | 1,762 | 72 | 317 | 296 |
As at end-March 2008 | 10,155 | 7,561 | 6,187 | 1,374 | 316 | 929 | 1,349 |
*: Includes IDBI Bank Ltd. | | | | | | | |
Note : Figures
in parentheses indicate the number of banks for 2007-08.
Source :
Balance sheets of respective banks. |
Table
III.36: Scheduled Commercial Banks -
Component-wise CRAR |
(Amount
in Rs. crore) | Item
/ End-March | 2006 | 2007 | 2008 |
1 | 2 | 3 | 4 |
A. | Capital
Funds (i+ii) | 2,21,363 | 2,96,191 | 4,06,835 |
| i) | Tier
I Capital | 1,66,538 | 2,00,386 | 2,83,339 |
| | of
which: | | | |
| | Paid-up
Capital | 25,142 | 29,462 | 41,178 |
| | Unallocated/Remittable | | | |
| | Surplus | 11,075 | 20,387 | 23,846 |
| | Deductions
for Tier-I | | | |
| | Capital | 11,271 | 13,662 | 21,933 |
| | | | | |
| ii) | Tier-II
Capital | 54,825 | 95,794 | 1,23,496 |
| | of
which: | | | |
| | Discounted
Subordinated Debt 43,214 | 63,834 | 73,297 |
| | | | | |
B. | Risk-weighted
Assets | 17,97,207 | 24,12,236 | 31,28,093 |
| of
which: | | | |
| Risk-weighted
Loans and | | | |
| Advances | 12,38,163 | 17,17,810 | 21,66,234 |
| | | | | |
C. | CRAR
(A as per cent of B) | 12.3 | 12.3 | 13.0 |
| of
which: | | | |
| Tier
I | 9.3 | 8.3 | 9.1 |
| Tier
II | 3.1 | 4.0 | 3.9 |
Source: Based
on off-site returns submitted by banks. | 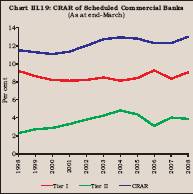
3.93 During 2007-08, the improvement in CRAR was observed across all bank groups.
The improvement was, however, more pronounced in respect of new and old private
sector banks, followed by SBI and associates. As at end-March 2008, the CRAR of
nationalised banks at 12.5 per cent was below the industry average (13.0 per cent),
while that of all other groups was above the industry level (Table
III.37).
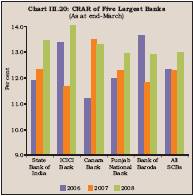
3.94 The CRAR of the five largest banks showed an improvement
during 2007-08 barring a marginal decline in the CRAR of Canara Bank. All the
five banks, however, maintained a CRAR of more than 12 per cent. Of the five largest
SCBs, four are in the public sector, while ICICI Bank is in the private sector
(Chart III.20).
Table
III.37: Capital Adequacy Ratio - Bank Group-wise |
(Per
cent) | Bank
Group/End-March | 2000 | 2001 | 2002 | 2003 | 2004 | 2005 | 2006 | 2007 | 2008 |
1 | 2 | 3 | 4 | 5 | 6 | 7 | 8 | 9 | 10 |
Scheduled Commercial Banks | 11.1 | 11.4 | 12.0 | 12.7 | 12.9 | 12.8 | 12.3 | 12.3 | 13.0 |
Public Sector Banks | 10.7 | 11.2 | 11.8 | 12.6 | 13.2 | 12.9 | 12.2 | 12.4 | 12.5 |
Nationalised Banks | 10.1 | 10.2 | 10.9 | 12.2 | 13.1 | 13.2 | 12.3 | 12.4 | 12.1 |
SBI Group | 11.6 | 12.7 | 13.3 | 13.4 | 13.4 | 12.4 | 11.9 | 12.3 | 13.2 |
Old Private Sector Banks | 12.4 | 11.9 | 12.5 | 12.8 | 13.7 | 12.5 | 11.7 | 12.1 | 14.1 |
New Private Sector Banks | 13.4 | 11.5 | 12.3 | 11.3 | 10.2 | 12.1 | 12.6 | 12.0 | 14.4 |
Foreign Banks | 11.9 | 12.6 | 12.9 | 15.2 | 15.0 | 14.0 | 13.0 | 12.4 | 13.1 |
Source : Based
on off-site returns submitted by banks. | 3.95
At the individual bank level, the CRAR of all SCBs was above the prescribed requirement
of 9 per cent at end-March 2008. While the CRAR of as many as 77 banks was Rs.30,455
crore during 2007-08 as against Rs.1,066 crore during 2006-07. In view of good
performance of banking scrips in the secondary market, strong financial results
of banks, the need to raise capital in the face of the ensuing Basel II norms
and tightening of prudential norms for sensitive sectors, five banks entered the
capital market with six issues during 2007-08. Out of six issues, five were equity
issues, of which two were floated by public sector banks for Rs.17,552 crore (including
premium) and four issues by private sector banks (including one debt issue) for
Rs.12,903 crore (including premium on equity issues) (Table III.39).
Table
III.38: Distribution of Scheduled Commercial Banks by CRAR |
(Number
of banks) | Bank
Group | 2006-07 | 2007-08 |
| Below | Between | Between | Between | 12
per | Below | Between | Between | Between | 12
per | | 4
per | 4-9
per | 9-10
per | 10-12
per | cent | 4
per | 4-9
per | 9-10
per | 10-12 | cent |
| cent | cent | cent | cent | &
above | cent | cent | cent | per
cent | &
above | 1 | 2 | 3 | 4 | 5 | 6 | 7 | 8 | 9 | 10 | 11 |
Nationalised Banks | - | - | - | 8 | 12 | - | - | - | 11 | 9 |
State Bank Group | - | - | - | 3 | 5 | - | - | - | 2 | 6 |
Old Private Sector Banks | 1 | - | 2 | 5 | 9 | - | - | 1 | 3 | 11 |
New Private Sector Banks | - | - | - | 4 | 4 | - | - | - | 2 | 6 |
Foreign Banks | - | - | - | 7 | 22 | - | - | 1 | 3 | 24 |
Total | 1 | - | 2 | 27 | 52 | - | - | 2 | 21 | 56 |
- : Nil/Negligible | | | | | | | | | | |
* : Includes data for IDBI
Bank Ltd. | | | | | | | | |
Source: Balance
sheets of respective banks |
Table
III.39: Public Issues by the Banking Sector |
(Rs.
crore) | Year | Public
Sector Banks | Private
Sector Banks |
| Total |
| Grand
Total |
| Equity | Debt | Equity | Debt | Equity |
| Debt |
|
1 | 2 | 3 | 4 | 5 | 6 |
| 7 | 8 |
2004-05 | 3,336 | - | 4,108 | 1,478 | 7,444 | | 1,478 | 8,922 |
2005-06 | 5,413 | - | 5,654 | - | 11,067 | | - | 11,067 |
2006-07 | 782 | - | 284 | - | 1,066 | | - | 1,066 |
2007-08 | 17,552 | - | 12,403 | 500 | 29,955 | | 500 | 30,455 |
2007 (April-Oct) | 816 | - | 10,063 | 500 | 10,879 | | 500 | 11,379 |
2008 (April-Oct) | - | - | - | - | - | | - | - |
-: Nil/Negligible | | | | | | | | |
3.97 Total premium raised by public sector banks was Rs.17,367 crore
and that by private sector banks was Rs.12,179 crore (Table III.40).
3.98 Resources raised by banks through debt issues in the private placement
market during 2007-08 declined by 15.5 per cent to Rs.26,199 crore (Table
III.41).During April-September 2008, resources mobilised by public sector
banks declined considerably by 58.3 per cent to Rs.4,558 crore, while resource
mobilisation by private sector banks increased substantially by 203.0 per cent
to Rs.2,251 crore.
Performance of Banking Stocks in the Secondary
Market
3.99 During 2007-08, the banking stocks as represented
by the Bankex (comprising 18 banking scrips) underperformed the BSE Sensex, the
broad-based index - the BSE 500, and other major sectoral indices, except IT and
consumer durables. Banking stocks, however, performed better than the BSE Sensex,
BSE 500 and the sectoral indices like capital goods and consumer durables during
the current financial year so far (up to December 08, 2008) (Table
III.42). Slowdown in GDP growth, particularly industrial growth and sharp
rise in domestic inflation appeared to have adversely affecting the banking stocks.
Banking sector stock also came under pressure due to concerns over the global
financial turmoil.
Table
III.40: Resources Raised by Banks
through Public Issues -
2007-08 | Bank
Face Value | Issue
Price | Size
of issue (Rs. crore) |
| (Rs.) | (Rs.) | Amount | Premium | Total |
1 | 2 | 3 | 4 | 5 | 6 |
Public Sector Bank | | | | | |
Central Bank of India | 10 | 92 | 80 | 736 | 816 |
State Bank of India | 10 | 1,580 | 105 | 16,631 | 16,736 |
A. Sub-total | | - | 185 | 17,367 | 17,552 |
Private Sector Banks | | | | | |
ICICI Bank Ltd. | 10 | 940 | 107 | 9,956 | 10,063 |
ICICI Bank Ltd. | | | | | |
(Debt Issue) | - | - | 500 | - | 500 |
Federal Bank of India | 10 | 250 | 85 | 2,056 | 2,141 |
Dhanalakshmi Bank Ltd. | 10 | 62 | 32 | 167 | 199 |
B. Sub-total | - | - | 724 | 12,179 | 12,903 |
Total (A+B) | - | - | 909 | 29,546 | 30,455 |
-: Not Applicable.
Source
: Securities and Exchange Board of India (SEBI). |
3.100 Banking stocks also showed significantly higher volatility during 2007-08
than volatility in the BSE Sensex (Table III.43). However,
during 2008-09 so far (up to December 08, 2008), volatility in BSE Sensex exceeded
that of BSE Bankex.
3.101 Notwithstanding the under-performance at
the industry level, at an individual bank level, the stocks of public
Table
III.41: Resources Raised by Banks
through Private Placements |
(Amount
in Rs. crore) | Category | Public
Sector | Private
Sector | Total |
| Banks | Banks |
|
|
| No.
of | Amount | No.
of | Amount | No.
of | Amount |
| Issues |
| Issues |
| Issues |
|
1 | 2 | 3 | 4 | 5 | 6 | 7 |
2006-07 | 26 | 6,639 | 64 | 24,355 | 90 | 30,994 |
2007-08 | 10 | 2,090 | 58 | 24,109 | 68 | 26,199 |
2007 (April-Sept) | 6 | 743 | 21 | 10,924 | 27 | 11,687 |
2008 (April-Sept) | 6 | 2,251 | 12 | 4,558 | 18 | 6,809 |
Source: Merchant
Bankers and Financial Institutions. | |


