RbiSearchHeader

Press escape key to go back

Past Searches

Theme
Theme
Text Size
Text Size
S2

RbiAnnouncementWeb

RBI Announcements
RBI Announcements

Asset Publisher

83741380

Order Books, Inventories and Capacity Utilisation Survey on the Manufacturing sector for Q2:2022-23

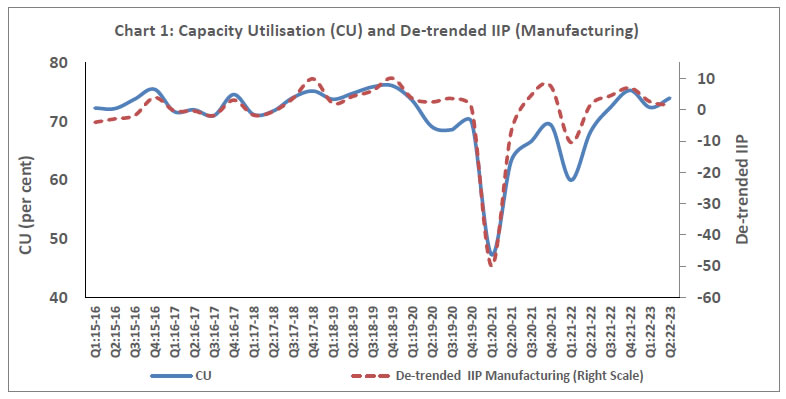
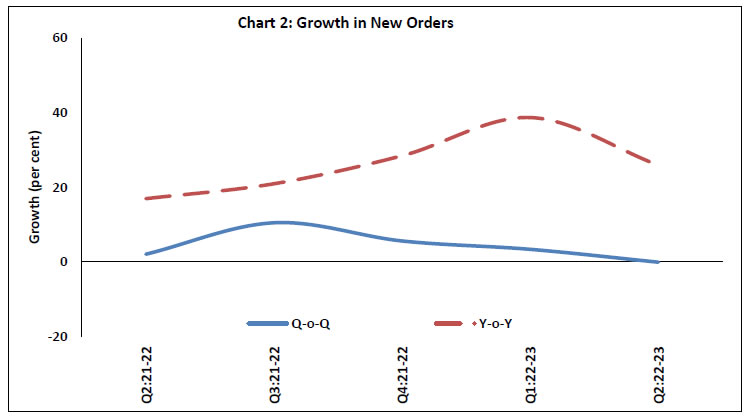
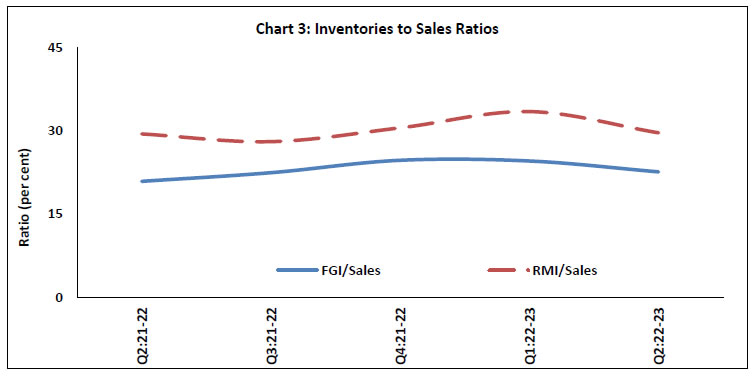
Today, the Reserve Bank released the results of its 59th round of the quarterly Order Books, Inventories and Capacity Utilisation Survey (OBICUS) conducted during Q3:2022-23 covering 800 manufacturing companies. The survey1 provides a snapshot of demand conditions in India’s manufacturing sector during July-September 2022.

Highlights:

  • The aggregate level capacity utilisation (CU) for the manufacturing sector improved to 74.0 per cent in Q2:2022-23 from 72.4 per cent in the previous quarter. The seasonally adjusted CU for Q2:2022-23 also increased by 20 basis points (bps) to 74.5 per cent from its level in the previous quarter (Chart 1 and Table 1).
Chart 1: Capacity Utilisation (CU) and De-trended IIP (Manufacturing)
  • New orders received by manufacturing companies during Q2:2022-23 were close to their level in the previous quarters but they were substantially higher than that in the corresponding quarter a year ago. (Chart 2 and Table 2A).
Chart 2: Growth in New Orders
  • Both raw material inventory (RMI) to sales and finished goods inventory (FGI) to sales ratios declined in Q2:2022-23 as compared to the previous quarter, which was commensurate with higher sales growth and similar level of new orders on sequential basis (Chart 3 and Table 3A).
Chart 3: Inventories to Sales Ratios

Note- Please see the excel file for time series data.


ANNEX 1: Data Tables

Table 1: IIP*-Manufacturing and Capacity Utilisation (CU)
Quarter Number of responding companies Capacity Utilisation IIP-Manufacturing (Quarterly Average) De-trended Quarterly IIP-Manufacturing
Q2:2021-22 728 68.3 131.6 1.6
Q3:2021-22 757 72.4 135.0 4.5
Q4:2021-22 727 75.3 138.1 7.0
Q1:2022-23 692 72.4 134.3 2.6
Q2:2022-23 745 74.0 133.7 1.4
*: Index of Industrial Production (Base: 2011-12)

Table 2A: Order Books Growth (Q2:2021-22 to Q2:2022-23)
Quarter Number of companies Q-o-Q Growth # (per cent) ** Y-o-Y Growth # (per cent)
Backlog Orders New Order Book Pending Orders Backlog Orders New Order Book Pending Orders
Q2:2021-22 184 10.8 2.1 3.9 10.2 16.9 15.1
Q3:2021-22 205 3.5 10.5 7.8 19.5 20.9 20.5
Q4:2021-22 207 4.7 5.6 4.6 14.2 28.4 25.1
Q1:2022-23 233 0.3 3.4 4.2 15.2 38.7 10.3
Q2:2022-23 265 4.6 -0.1 10.8 11.4 25.9 20.1
#: Growth rates are calculated using three rounds common set of companies, namely, companies responded in the current quarter, one quarter ago and the same quarter a year ago.
**: Not seasonally adjusted.

Table 2B: Average Size of Order Books (Q2:2021-22 to Q2:2022-23)
Quarter Number of companies Average Amount (₹ Crores)
Backlog Orders New Order Book Pending Orders
Q2:2021-22 184 197.9 195.7 207.4
Q3:2021-22 205 182.3 224.4 196.6
Q4:2021-22 207 176.3 222.4 184.2
Q1:2022-23 233 221.7 244.8 231.5
Q2:2022-23 265 208.8 307.9 232.4

Table 3A: Inventory to Sales Ratios (Q2:2021-22 to Q2:2022-23)
Quarter Number of Companies Ratio (per cent) #
Total Inventory / Sales Finished Goods Inventory / Sales Raw Material Inventory / Sales
Q2:2021-22 537 60.5 20.9 29.4
Q3:2021-22 681 58.1 22.4 28.0
Q4:2021-22 651 65.2 24.7 30.5
Q1:2022-23 630 69.6 24.6 33.5
Q2:2022-23 721 61.8 22.6 29.6
#: Weighted average of industry level ratios using GVA as weights

Table 3B: Average Sales and Inventories (Q2:2021-22 to Q2:2022-23)
Quarter Number of Companies Average Amount (₹ Crores)
Sales Total Inventory Finished Goods Inventory Work in progress Inventory Raw Material Inventory
Q2:2021-22 537 1012.6 494.4 200.0 78.6 215.8
Q3:2021-22 681 1027.9 465.0 193.5 62.0 209.5
Q4:2021-22 651 1123.2 530.2 219.2 79.8 231.2
Q1:2022-23 630 1238.3 591.8 238.3 87.3 266.2
Q2:2022-23 721 1285.8 508.2 217.6 73.2 217.4

Note: The computations of order book growths and inventory to sales ratios are based on methodology given in the RBI press release dated October 8, 2021 (link: /en/web/rbi/-/publications/obicus-survey-on-the-manufacturing-sector-for-q1-2021-22-20650) and not on the basis of averages given in the above tables.


1 The survey responses are voluntary. Results of the previous survey round were released on the Bank’s website on September 30, 2022.

RbiTtsCommonUtility

प्ले हो रहा है
ऐका

Related Assets

RBI-Install-RBI-Content-Global

RbiSocialMediaUtility

भारतीय रिझर्व्ह बँक मोबाईल ॲप्लिकेशन इंस्टॉल करा आणि नवीनतम बातम्यांचा त्वरित ॲक्सेस मिळवा!

Scan Your QR code to Install our app

RbiWasItHelpfulUtility

हे पेज उपयुक्त होते का?